

Key Insights
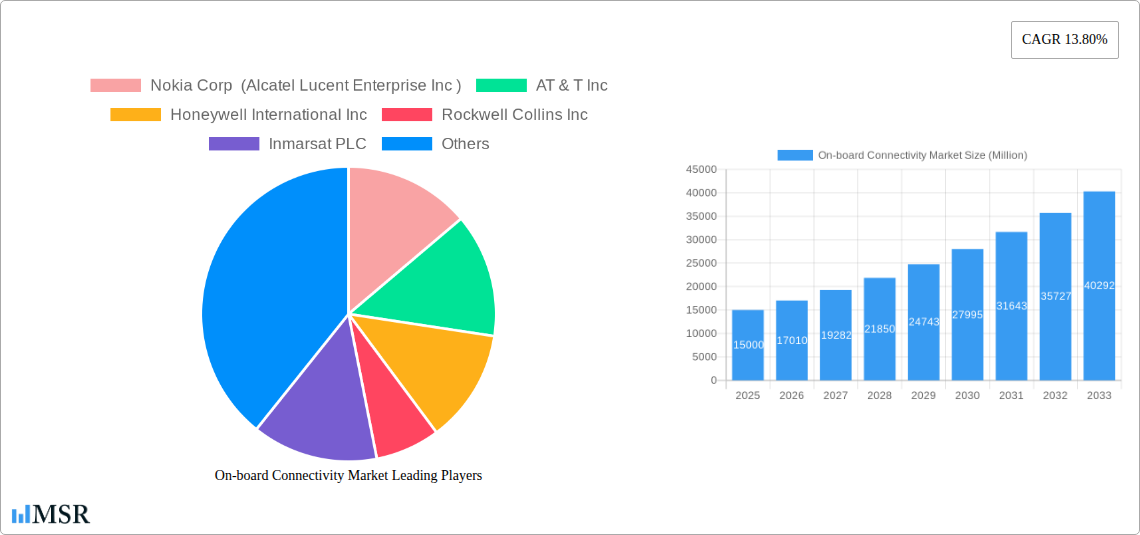
The onboard connectivity market is experiencing robust growth, driven by the increasing demand for seamless communication and entertainment services across various transportation modes. The market's Compound Annual Growth Rate (CAGR) of 13.80% from 2019 to 2024 suggests a significant expansion, projected to continue into the forecast period (2025-2033). Key drivers include the rising adoption of smart devices, the proliferation of high-speed internet access, and the increasing need for real-time data transmission in transportation and logistics. Passenger expectations for in-flight Wi-Fi, reliable connectivity on trains and buses, and improved communication for safety and efficiency are shaping market trends. While the initial investment in infrastructure can be a restraint, the long-term benefits of enhanced operational efficiency and passenger satisfaction are driving adoption. The market is segmented by type (solution and service) and end-user industry (transportation, including railway, entertainment, monitoring, and communication). Major players like Nokia, AT&T, Honeywell, and others are actively investing in research and development to improve connectivity technologies and cater to the evolving market needs. The market is geographically diverse with North America, Europe, and Asia Pacific representing significant revenue streams. Given the 13.80% CAGR from 2019-2024, and assuming a slightly moderated but still significant growth in the future, a reasonable estimate places the 2025 market size at approximately $15 billion. This estimation considers the continued investment in infrastructure and ongoing technological advancements within the sector.
On-board Connectivity Market Market Size (In Billion)
The future of the onboard connectivity market looks bright, propelled by advancements in 5G technology, satellite communication, and improved network infrastructure. The integration of IoT devices and the development of sophisticated data analytics solutions for optimizing transportation operations will further stimulate market growth. Competitive landscape analysis reveals a mix of established telecommunication companies, aerospace manufacturers, and technology providers vying for market share. Strategic partnerships and collaborations are anticipated to become increasingly prominent as companies strive to offer comprehensive solutions to meet the diverse needs of different transportation segments. The continued focus on enhancing passenger experience, improving safety, and optimizing operational efficiency will continue to be central to the onboard connectivity market's success in the coming years. The market's expansion will be influenced by factors such as government regulations, technological innovation, and economic conditions in various regions.

On-board Connectivity Market Company Market Share
On-Board Connectivity Market Report: 2019-2033 Forecast
Dive deep into the lucrative On-board Connectivity Market with this comprehensive report, offering actionable insights for strategic decision-making. This in-depth analysis covers the period from 2019 to 2033, with a base year of 2025 and a forecast period spanning 2025-2033. The report provides a granular view of market dynamics, key players, and emerging trends, enabling businesses to capitalize on significant growth opportunities within the transportation, railway, and other sectors. The global market is projected to reach xx Million by 2033, exhibiting a CAGR of xx% during the forecast period.
On-board Connectivity Market Market Concentration & Dynamics
The On-board Connectivity market exhibits a moderately concentrated landscape, with key players like Nokia Corp (Alcatel Lucent Enterprise Inc), AT&T Inc, Honeywell International Inc, and others holding significant market share. Market concentration is influenced by factors such as technological advancements, regulatory frameworks, and the increasing demand for reliable connectivity solutions across various transportation modes. The market is characterized by an active innovation ecosystem, with companies continuously investing in R&D to improve network performance, security, and bandwidth capabilities. Regulatory frameworks, particularly concerning data privacy and security, play a crucial role in shaping market dynamics. Substitute products, such as terrestrial communication networks, compete with on-board connectivity solutions, particularly in areas with robust ground-based infrastructure. End-user trends, including rising passenger expectations for seamless connectivity and the proliferation of smart devices, are driving market growth. Furthermore, M&A activities are prevalent, with xx M&A deals recorded between 2019 and 2024, indicating a strategic push for consolidation and expansion within the industry.
- Market Share: Top 5 players hold approximately xx% of the market share in 2025.
- M&A Activity: An average of xx M&A deals per year were observed between 2019 and 2024.
- Innovation Focus: Key innovations include 5G integration, satellite-based solutions, and improved cybersecurity measures.
On-board Connectivity Market Industry Insights & Trends
The On-board Connectivity market is experiencing robust growth, driven by several key factors. The increasing adoption of connected devices, coupled with growing demand for seamless connectivity in various transportation modes (air, rail, road), is a primary catalyst. Technological advancements, such as the deployment of 5G and satellite communication technologies, are further boosting market expansion. The rising need for real-time data monitoring and enhanced passenger experience in public transportation systems is also contributing to the growth. Evolving consumer behaviors, characterized by increased reliance on mobile devices and the expectation of ubiquitous connectivity, are significantly influencing market dynamics. Market size reached xx Million in 2024, and is projected to reach xx Million in 2025, reflecting a strong growth trajectory. The market is anticipated to maintain a steady CAGR of xx% throughout the forecast period (2025-2033). Challenges remain, such as the need for robust cybersecurity protocols and the complexities of integrating diverse network technologies.
Key Markets & Segments Leading On-board Connectivity Market
The North American region currently dominates the on-board connectivity market, followed by Europe and Asia-Pacific. This dominance is attributed to high levels of technological advancement, significant investments in infrastructure development, and strong regulatory support for deploying advanced communication networks within transportation systems. The "Solution" segment under "Type" and the "Transportation" segment under "End-user Industry" currently hold the largest market share.
Drivers of North American Dominance:
- Advanced infrastructure development.
- High adoption of connected devices.
- Strong regulatory support for technological upgrades.
- High disposable incomes leading to greater demand for premium on-board connectivity services.
Drivers of the Solution Segment Dominance:
- High demand for customized solutions that cater to specific needs and technological requirements.
- Growing number of transportation companies seeking to integrate complete connectivity packages.
Drivers of the Transportation Segment Dominance:
- High concentration of passengers who demand connectivity.
- Significant technological advancements in this sector compared to railway.
Detailed Dominance Analysis: The North American region's dominance stems from early adoption of advanced technologies, robust regulatory frameworks, and a mature market for connected services. The "Solution" segment captures a large portion of the market due to its flexible and comprehensive approach to fulfilling connectivity needs across diverse transportation types. The "Transportation" segment's leading position is propelled by the increasing passenger base and the growing imperative for a seamless connected experience within various transport modalities like airlines and automobiles.
On-board Connectivity Market Product Developments
Recent product innovations focus on enhancing bandwidth, improving security protocols, and integrating advanced technologies like 5G and satellite communication to deliver seamless connectivity experiences in various environments. These advancements aim to meet the increasing demand for high-speed internet access, real-time data transmission, and robust security measures, creating a competitive edge for businesses offering superior solutions. The development of integrated platforms that provide multiple services, like entertainment, communication, and monitoring, is also gaining traction.
Challenges in the On-board Connectivity Market Market
The On-board Connectivity market faces challenges including high initial infrastructure costs, concerns about data security and privacy, and the need to meet diverse regulatory requirements across different regions and transportation modes. Supply chain disruptions and intense competition from established players and new entrants also impact market growth. These challenges collectively impose a significant impact, estimated to restrain market growth by approximately xx% during the forecast period.
Forces Driving On-board Connectivity Market Growth
Key growth drivers include: the rising adoption of smart devices and the escalating demand for high-speed internet access, increasing investments in infrastructure development to facilitate seamless connectivity, and the growing emphasis on enhancing passenger experience through advanced in-flight entertainment and communication systems. Favorable government regulations promoting technological advancements in transportation also contribute to market growth.
Challenges in the On-board Connectivity Market Market
Long-term growth hinges on strategic partnerships, technological innovations (such as 6G integration), and expansion into emerging markets. Collaborations between telecom providers, technology companies, and transportation operators are pivotal in developing comprehensive and cost-effective solutions. Continuous improvements in security protocols and enhanced data analytics capabilities will also fuel the market's sustained growth.
Emerging Opportunities in On-board Connectivity Market
Emerging opportunities lie in the expansion into new transportation segments (e.g., autonomous vehicles, drones), the integration of advanced analytics and artificial intelligence to improve network efficiency and service quality, and the development of innovative applications targeting specific end-user needs within the transportation and railway sectors. The potential for personalized in-cabin experiences driven by sophisticated connectivity also presents a compelling opportunity.
Leading Players in the On-board Connectivity Market Sector
- Nokia Corp (Alcatel Lucent Enterprise Inc)
- AT&T Inc
- Honeywell International Inc
- Rockwell Collins Inc
- Inmarsat PLC
- Huawei Technologies Co Ltd
- ZTE Corporation
- Viasat Inc
- Bombardier Aerospace Inc
- Panasonic Corporation
Key Milestones in On-board Connectivity Market Industry
- 2020: Increased investment in 5G infrastructure for in-flight connectivity.
- 2021: Launch of several low-earth orbit (LEO) satellite constellations for improved global coverage.
- 2022: Significant advancements in security protocols to address data privacy concerns.
- 2023: Development of integrated platforms offering multiple services within transportation.
- 2024: Growth in M&A activity as companies seek to expand their market reach.
Strategic Outlook for On-board Connectivity Market Market
The On-board Connectivity market presents substantial long-term growth potential driven by technological innovations, strategic partnerships, and the expansion into new and emerging markets. Strategic opportunities exist for companies that can effectively leverage advanced technologies, develop cost-effective solutions, and address evolving regulatory requirements to meet growing demand for high-speed connectivity in various transportation modes. Focus on security enhancements and innovative applications will be crucial for long-term success within this dynamic market.
On-board Connectivity Market Segmentation
- 1. Production Analysis
- 2. Consumption Analysis
- 3. Import Market Analysis (Value & Volume)
- 4. Export Market Analysis (Value & Volume)
- 5. Price Trend Analysis
On-board Connectivity Market Segmentation By Geography
-
1. North America
- 1.1. United States
- 1.2. Canada
- 1.3. Mexico
-
2. South America
- 2.1. Brazil
- 2.2. Argentina
- 2.3. Rest of South America
-
3. Europe
- 3.1. United Kingdom
- 3.2. Germany
- 3.3. France
- 3.4. Italy
- 3.5. Spain
- 3.6. Russia
- 3.7. Benelux
- 3.8. Nordics
- 3.9. Rest of Europe
-
4. Middle East & Africa
- 4.1. Turkey
- 4.2. Israel
- 4.3. GCC
- 4.4. North Africa
- 4.5. South Africa
- 4.6. Rest of Middle East & Africa
-
5. Asia Pacific
- 5.1. China
- 5.2. India
- 5.3. Japan
- 5.4. South Korea
- 5.5. ASEAN
- 5.6. Oceania
- 5.7. Rest of Asia Pacific
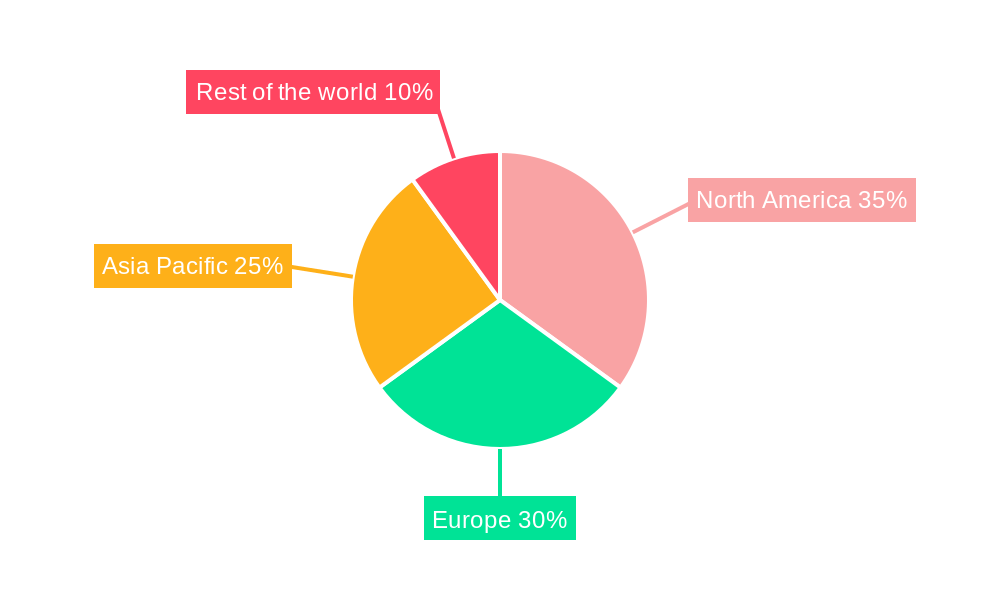
On-board Connectivity Market Regional Market Share
Geographic Coverage of On-board Connectivity Market
On-board Connectivity Market REPORT HIGHLIGHTS
| Aspects | Details |
|---|---|
| Study Period | 2020-2034 |
| Base Year | 2025 |
| Estimated Year | 2026 |
| Forecast Period | 2026-2034 |
| Historical Period | 2020-2025 |
| Growth Rate | CAGR of 13.5% from 2020-2034 |
| Segmentation |
|
Table of Contents
- 1. Introduction
- 1.1. Research Scope
- 1.2. Market Segmentation
- 1.3. Research Objective
- 1.4. Definitions and Assumptions
- 2. Executive Summary
- 2.1. Market Snapshot
- 3. Market Dynamics
- 3.1. Market Drivers
- 3.2. Market Restrains
- 3.3. Market Trends
- 3.4. Market Opportunities
- 4. Market Factor Analysis
- 4.1. Porters Five Forces
- 4.1.1. Bargaining Power of Suppliers
- 4.1.2. Bargaining Power of Buyers
- 4.1.3. Threat of New Entrants
- 4.1.4. Threat of Substitutes
- 4.1.5. Competitive Rivalry
- 4.2. PESTEL analysis
- 4.3. BCG Analysis
- 4.3.1. Stars (High Growth, High Market Share)
- 4.3.2. Cash Cows (Low Growth, High Market Share)
- 4.3.3. Question Mark (High Growth, Low Market Share)
- 4.3.4. Dogs (Low Growth, Low Market Share)
- 4.4. Ansoff Matrix Analysis
- 4.5. Supply Chain Analysis
- 4.6. Regulatory Landscape
- 4.7. Current Market Potential and Opportunity Assessment (TAM–SAM–SOM Framework)
- 4.8. MSR Analyst Note
- 4.1. Porters Five Forces
- 5. Market Analysis, Insights and Forecast 2021-2033
- 5.1. Market Analysis, Insights and Forecast - by Production Analysis
- 5.2. Market Analysis, Insights and Forecast - by Consumption Analysis
- 5.3. Market Analysis, Insights and Forecast - by Import Market Analysis (Value & Volume)
- 5.4. Market Analysis, Insights and Forecast - by Export Market Analysis (Value & Volume)
- 5.5. Market Analysis, Insights and Forecast - by Price Trend Analysis
- 5.6. Market Analysis, Insights and Forecast - by Region
- 5.6.1. North America
- 5.6.2. South America
- 5.6.3. Europe
- 5.6.4. Middle East & Africa
- 5.6.5. Asia Pacific
- 6. Global On-board Connectivity Market Analysis, Insights and Forecast, 2021-2033
- 6.1. Market Analysis, Insights and Forecast - by Production Analysis
- 6.2. Market Analysis, Insights and Forecast - by Consumption Analysis
- 6.3. Market Analysis, Insights and Forecast - by Import Market Analysis (Value & Volume)
- 6.4. Market Analysis, Insights and Forecast - by Export Market Analysis (Value & Volume)
- 6.5. Market Analysis, Insights and Forecast - by Price Trend Analysis
- 7. North America On-board Connectivity Market Analysis, Insights and Forecast, 2020-2032
- 7.1. Market Analysis, Insights and Forecast - by Production Analysis
- 7.2. Market Analysis, Insights and Forecast - by Consumption Analysis
- 7.3. Market Analysis, Insights and Forecast - by Import Market Analysis (Value & Volume)
- 7.4. Market Analysis, Insights and Forecast - by Export Market Analysis (Value & Volume)
- 7.5. Market Analysis, Insights and Forecast - by Price Trend Analysis
- 8. South America On-board Connectivity Market Analysis, Insights and Forecast, 2020-2032
- 8.1. Market Analysis, Insights and Forecast - by Production Analysis
- 8.2. Market Analysis, Insights and Forecast - by Consumption Analysis
- 8.3. Market Analysis, Insights and Forecast - by Import Market Analysis (Value & Volume)
- 8.4. Market Analysis, Insights and Forecast - by Export Market Analysis (Value & Volume)
- 8.5. Market Analysis, Insights and Forecast - by Price Trend Analysis
- 9. Europe On-board Connectivity Market Analysis, Insights and Forecast, 2020-2032
- 9.1. Market Analysis, Insights and Forecast - by Production Analysis
- 9.2. Market Analysis, Insights and Forecast - by Consumption Analysis
- 9.3. Market Analysis, Insights and Forecast - by Import Market Analysis (Value & Volume)
- 9.4. Market Analysis, Insights and Forecast - by Export Market Analysis (Value & Volume)
- 9.5. Market Analysis, Insights and Forecast - by Price Trend Analysis
- 10. Middle East & Africa On-board Connectivity Market Analysis, Insights and Forecast, 2020-2032
- 10.1. Market Analysis, Insights and Forecast - by Production Analysis
- 10.2. Market Analysis, Insights and Forecast - by Consumption Analysis
- 10.3. Market Analysis, Insights and Forecast - by Import Market Analysis (Value & Volume)
- 10.4. Market Analysis, Insights and Forecast - by Export Market Analysis (Value & Volume)
- 10.5. Market Analysis, Insights and Forecast - by Price Trend Analysis
- 11. Asia Pacific On-board Connectivity Market Analysis, Insights and Forecast, 2020-2032
- 11.1. Market Analysis, Insights and Forecast - by Production Analysis
- 11.2. Market Analysis, Insights and Forecast - by Consumption Analysis
- 11.3. Market Analysis, Insights and Forecast - by Import Market Analysis (Value & Volume)
- 11.4. Market Analysis, Insights and Forecast - by Export Market Analysis (Value & Volume)
- 11.5. Market Analysis, Insights and Forecast - by Price Trend Analysis
- 12. Competitive Analysis
- 12.1. Company Profiles
- 12.1.1 Nokia Corp (Alcatel Lucent Enterprise Inc )
- 12.1.1.1. Company Overview
- 12.1.1.2. Products
- 12.1.1.3. Company Financials
- 12.1.1.4. SWOT Analysis
- 12.1.2 AT & T Inc
- 12.1.2.1. Company Overview
- 12.1.2.2. Products
- 12.1.2.3. Company Financials
- 12.1.2.4. SWOT Analysis
- 12.1.3 Honeywell International Inc
- 12.1.3.1. Company Overview
- 12.1.3.2. Products
- 12.1.3.3. Company Financials
- 12.1.3.4. SWOT Analysis
- 12.1.4 Rockwell Collins Inc
- 12.1.4.1. Company Overview
- 12.1.4.2. Products
- 12.1.4.3. Company Financials
- 12.1.4.4. SWOT Analysis
- 12.1.5 Inmarsat PLC
- 12.1.5.1. Company Overview
- 12.1.5.2. Products
- 12.1.5.3. Company Financials
- 12.1.5.4. SWOT Analysis
- 12.1.6 Huawei Technologies Co Ltd
- 12.1.6.1. Company Overview
- 12.1.6.2. Products
- 12.1.6.3. Company Financials
- 12.1.6.4. SWOT Analysis
- 12.1.7 ZTE Corporation
- 12.1.7.1. Company Overview
- 12.1.7.2. Products
- 12.1.7.3. Company Financials
- 12.1.7.4. SWOT Analysis
- 12.1.8 Viasat Inc *List Not Exhaustive
- 12.1.8.1. Company Overview
- 12.1.8.2. Products
- 12.1.8.3. Company Financials
- 12.1.8.4. SWOT Analysis
- 12.1.9 Bombardier Aerospace Inc
- 12.1.9.1. Company Overview
- 12.1.9.2. Products
- 12.1.9.3. Company Financials
- 12.1.9.4. SWOT Analysis
- 12.1.10 Panasonic Corporation
- 12.1.10.1. Company Overview
- 12.1.10.2. Products
- 12.1.10.3. Company Financials
- 12.1.10.4. SWOT Analysis
- 12.1.1 Nokia Corp (Alcatel Lucent Enterprise Inc )
- 12.2. Market Entropy
- 12.2.1 Company's Key Areas Served
- 12.2.2 Recent Developments
- 12.3. Company Market Share Analysis 2025
- 12.3.1 Top 5 Companies Market Share Analysis
- 12.3.2 Top 3 Companies Market Share Analysis
- 12.4. List of Potential Customers
- 13. Research Methodology
List of Figures
- Figure 1: Global On-board Connectivity Market Revenue Breakdown (billion, %) by Region 2025 & 2033
- Figure 2: North America On-board Connectivity Market Revenue (billion), by Production Analysis 2025 & 2033
- Figure 3: North America On-board Connectivity Market Revenue Share (%), by Production Analysis 2025 & 2033
- Figure 4: North America On-board Connectivity Market Revenue (billion), by Consumption Analysis 2025 & 2033
- Figure 5: North America On-board Connectivity Market Revenue Share (%), by Consumption Analysis 2025 & 2033
- Figure 6: North America On-board Connectivity Market Revenue (billion), by Import Market Analysis (Value & Volume) 2025 & 2033
- Figure 7: North America On-board Connectivity Market Revenue Share (%), by Import Market Analysis (Value & Volume) 2025 & 2033
- Figure 8: North America On-board Connectivity Market Revenue (billion), by Export Market Analysis (Value & Volume) 2025 & 2033
- Figure 9: North America On-board Connectivity Market Revenue Share (%), by Export Market Analysis (Value & Volume) 2025 & 2033
- Figure 10: North America On-board Connectivity Market Revenue (billion), by Price Trend Analysis 2025 & 2033
- Figure 11: North America On-board Connectivity Market Revenue Share (%), by Price Trend Analysis 2025 & 2033
- Figure 12: North America On-board Connectivity Market Revenue (billion), by Country 2025 & 2033
- Figure 13: North America On-board Connectivity Market Revenue Share (%), by Country 2025 & 2033
- Figure 14: South America On-board Connectivity Market Revenue (billion), by Production Analysis 2025 & 2033
- Figure 15: South America On-board Connectivity Market Revenue Share (%), by Production Analysis 2025 & 2033
- Figure 16: South America On-board Connectivity Market Revenue (billion), by Consumption Analysis 2025 & 2033
- Figure 17: South America On-board Connectivity Market Revenue Share (%), by Consumption Analysis 2025 & 2033
- Figure 18: South America On-board Connectivity Market Revenue (billion), by Import Market Analysis (Value & Volume) 2025 & 2033
- Figure 19: South America On-board Connectivity Market Revenue Share (%), by Import Market Analysis (Value & Volume) 2025 & 2033
- Figure 20: South America On-board Connectivity Market Revenue (billion), by Export Market Analysis (Value & Volume) 2025 & 2033
- Figure 21: South America On-board Connectivity Market Revenue Share (%), by Export Market Analysis (Value & Volume) 2025 & 2033
- Figure 22: South America On-board Connectivity Market Revenue (billion), by Price Trend Analysis 2025 & 2033
- Figure 23: South America On-board Connectivity Market Revenue Share (%), by Price Trend Analysis 2025 & 2033
- Figure 24: South America On-board Connectivity Market Revenue (billion), by Country 2025 & 2033
- Figure 25: South America On-board Connectivity Market Revenue Share (%), by Country 2025 & 2033
- Figure 26: Europe On-board Connectivity Market Revenue (billion), by Production Analysis 2025 & 2033
- Figure 27: Europe On-board Connectivity Market Revenue Share (%), by Production Analysis 2025 & 2033
- Figure 28: Europe On-board Connectivity Market Revenue (billion), by Consumption Analysis 2025 & 2033
- Figure 29: Europe On-board Connectivity Market Revenue Share (%), by Consumption Analysis 2025 & 2033
- Figure 30: Europe On-board Connectivity Market Revenue (billion), by Import Market Analysis (Value & Volume) 2025 & 2033
- Figure 31: Europe On-board Connectivity Market Revenue Share (%), by Import Market Analysis (Value & Volume) 2025 & 2033
- Figure 32: Europe On-board Connectivity Market Revenue (billion), by Export Market Analysis (Value & Volume) 2025 & 2033
- Figure 33: Europe On-board Connectivity Market Revenue Share (%), by Export Market Analysis (Value & Volume) 2025 & 2033
- Figure 34: Europe On-board Connectivity Market Revenue (billion), by Price Trend Analysis 2025 & 2033
- Figure 35: Europe On-board Connectivity Market Revenue Share (%), by Price Trend Analysis 2025 & 2033
- Figure 36: Europe On-board Connectivity Market Revenue (billion), by Country 2025 & 2033
- Figure 37: Europe On-board Connectivity Market Revenue Share (%), by Country 2025 & 2033
- Figure 38: Middle East & Africa On-board Connectivity Market Revenue (billion), by Production Analysis 2025 & 2033
- Figure 39: Middle East & Africa On-board Connectivity Market Revenue Share (%), by Production Analysis 2025 & 2033
- Figure 40: Middle East & Africa On-board Connectivity Market Revenue (billion), by Consumption Analysis 2025 & 2033
- Figure 41: Middle East & Africa On-board Connectivity Market Revenue Share (%), by Consumption Analysis 2025 & 2033
- Figure 42: Middle East & Africa On-board Connectivity Market Revenue (billion), by Import Market Analysis (Value & Volume) 2025 & 2033
- Figure 43: Middle East & Africa On-board Connectivity Market Revenue Share (%), by Import Market Analysis (Value & Volume) 2025 & 2033
- Figure 44: Middle East & Africa On-board Connectivity Market Revenue (billion), by Export Market Analysis (Value & Volume) 2025 & 2033
- Figure 45: Middle East & Africa On-board Connectivity Market Revenue Share (%), by Export Market Analysis (Value & Volume) 2025 & 2033
- Figure 46: Middle East & Africa On-board Connectivity Market Revenue (billion), by Price Trend Analysis 2025 & 2033
- Figure 47: Middle East & Africa On-board Connectivity Market Revenue Share (%), by Price Trend Analysis 2025 & 2033
- Figure 48: Middle East & Africa On-board Connectivity Market Revenue (billion), by Country 2025 & 2033
- Figure 49: Middle East & Africa On-board Connectivity Market Revenue Share (%), by Country 2025 & 2033
- Figure 50: Asia Pacific On-board Connectivity Market Revenue (billion), by Production Analysis 2025 & 2033
- Figure 51: Asia Pacific On-board Connectivity Market Revenue Share (%), by Production Analysis 2025 & 2033
- Figure 52: Asia Pacific On-board Connectivity Market Revenue (billion), by Consumption Analysis 2025 & 2033
- Figure 53: Asia Pacific On-board Connectivity Market Revenue Share (%), by Consumption Analysis 2025 & 2033
- Figure 54: Asia Pacific On-board Connectivity Market Revenue (billion), by Import Market Analysis (Value & Volume) 2025 & 2033
- Figure 55: Asia Pacific On-board Connectivity Market Revenue Share (%), by Import Market Analysis (Value & Volume) 2025 & 2033
- Figure 56: Asia Pacific On-board Connectivity Market Revenue (billion), by Export Market Analysis (Value & Volume) 2025 & 2033
- Figure 57: Asia Pacific On-board Connectivity Market Revenue Share (%), by Export Market Analysis (Value & Volume) 2025 & 2033
- Figure 58: Asia Pacific On-board Connectivity Market Revenue (billion), by Price Trend Analysis 2025 & 2033
- Figure 59: Asia Pacific On-board Connectivity Market Revenue Share (%), by Price Trend Analysis 2025 & 2033
- Figure 60: Asia Pacific On-board Connectivity Market Revenue (billion), by Country 2025 & 2033
- Figure 61: Asia Pacific On-board Connectivity Market Revenue Share (%), by Country 2025 & 2033
List of Tables
- Table 1: Global On-board Connectivity Market Revenue billion Forecast, by Production Analysis 2020 & 2033
- Table 2: Global On-board Connectivity Market Revenue billion Forecast, by Consumption Analysis 2020 & 2033
- Table 3: Global On-board Connectivity Market Revenue billion Forecast, by Import Market Analysis (Value & Volume) 2020 & 2033
- Table 4: Global On-board Connectivity Market Revenue billion Forecast, by Export Market Analysis (Value & Volume) 2020 & 2033
- Table 5: Global On-board Connectivity Market Revenue billion Forecast, by Price Trend Analysis 2020 & 2033
- Table 6: Global On-board Connectivity Market Revenue billion Forecast, by Region 2020 & 2033
- Table 7: Global On-board Connectivity Market Revenue billion Forecast, by Production Analysis 2020 & 2033
- Table 8: Global On-board Connectivity Market Revenue billion Forecast, by Consumption Analysis 2020 & 2033
- Table 9: Global On-board Connectivity Market Revenue billion Forecast, by Import Market Analysis (Value & Volume) 2020 & 2033
- Table 10: Global On-board Connectivity Market Revenue billion Forecast, by Export Market Analysis (Value & Volume) 2020 & 2033
- Table 11: Global On-board Connectivity Market Revenue billion Forecast, by Price Trend Analysis 2020 & 2033
- Table 12: Global On-board Connectivity Market Revenue billion Forecast, by Country 2020 & 2033
- Table 13: United States On-board Connectivity Market Revenue (billion) Forecast, by Application 2020 & 2033
- Table 14: Canada On-board Connectivity Market Revenue (billion) Forecast, by Application 2020 & 2033
- Table 15: Mexico On-board Connectivity Market Revenue (billion) Forecast, by Application 2020 & 2033
- Table 16: Global On-board Connectivity Market Revenue billion Forecast, by Production Analysis 2020 & 2033
- Table 17: Global On-board Connectivity Market Revenue billion Forecast, by Consumption Analysis 2020 & 2033
- Table 18: Global On-board Connectivity Market Revenue billion Forecast, by Import Market Analysis (Value & Volume) 2020 & 2033
- Table 19: Global On-board Connectivity Market Revenue billion Forecast, by Export Market Analysis (Value & Volume) 2020 & 2033
- Table 20: Global On-board Connectivity Market Revenue billion Forecast, by Price Trend Analysis 2020 & 2033
- Table 21: Global On-board Connectivity Market Revenue billion Forecast, by Country 2020 & 2033
- Table 22: Brazil On-board Connectivity Market Revenue (billion) Forecast, by Application 2020 & 2033
- Table 23: Argentina On-board Connectivity Market Revenue (billion) Forecast, by Application 2020 & 2033
- Table 24: Rest of South America On-board Connectivity Market Revenue (billion) Forecast, by Application 2020 & 2033
- Table 25: Global On-board Connectivity Market Revenue billion Forecast, by Production Analysis 2020 & 2033
- Table 26: Global On-board Connectivity Market Revenue billion Forecast, by Consumption Analysis 2020 & 2033
- Table 27: Global On-board Connectivity Market Revenue billion Forecast, by Import Market Analysis (Value & Volume) 2020 & 2033
- Table 28: Global On-board Connectivity Market Revenue billion Forecast, by Export Market Analysis (Value & Volume) 2020 & 2033
- Table 29: Global On-board Connectivity Market Revenue billion Forecast, by Price Trend Analysis 2020 & 2033
- Table 30: Global On-board Connectivity Market Revenue billion Forecast, by Country 2020 & 2033
- Table 31: United Kingdom On-board Connectivity Market Revenue (billion) Forecast, by Application 2020 & 2033
- Table 32: Germany On-board Connectivity Market Revenue (billion) Forecast, by Application 2020 & 2033
- Table 33: France On-board Connectivity Market Revenue (billion) Forecast, by Application 2020 & 2033
- Table 34: Italy On-board Connectivity Market Revenue (billion) Forecast, by Application 2020 & 2033
- Table 35: Spain On-board Connectivity Market Revenue (billion) Forecast, by Application 2020 & 2033
- Table 36: Russia On-board Connectivity Market Revenue (billion) Forecast, by Application 2020 & 2033
- Table 37: Benelux On-board Connectivity Market Revenue (billion) Forecast, by Application 2020 & 2033
- Table 38: Nordics On-board Connectivity Market Revenue (billion) Forecast, by Application 2020 & 2033
- Table 39: Rest of Europe On-board Connectivity Market Revenue (billion) Forecast, by Application 2020 & 2033
- Table 40: Global On-board Connectivity Market Revenue billion Forecast, by Production Analysis 2020 & 2033
- Table 41: Global On-board Connectivity Market Revenue billion Forecast, by Consumption Analysis 2020 & 2033
- Table 42: Global On-board Connectivity Market Revenue billion Forecast, by Import Market Analysis (Value & Volume) 2020 & 2033
- Table 43: Global On-board Connectivity Market Revenue billion Forecast, by Export Market Analysis (Value & Volume) 2020 & 2033
- Table 44: Global On-board Connectivity Market Revenue billion Forecast, by Price Trend Analysis 2020 & 2033
- Table 45: Global On-board Connectivity Market Revenue billion Forecast, by Country 2020 & 2033
- Table 46: Turkey On-board Connectivity Market Revenue (billion) Forecast, by Application 2020 & 2033
- Table 47: Israel On-board Connectivity Market Revenue (billion) Forecast, by Application 2020 & 2033
- Table 48: GCC On-board Connectivity Market Revenue (billion) Forecast, by Application 2020 & 2033
- Table 49: North Africa On-board Connectivity Market Revenue (billion) Forecast, by Application 2020 & 2033
- Table 50: South Africa On-board Connectivity Market Revenue (billion) Forecast, by Application 2020 & 2033
- Table 51: Rest of Middle East & Africa On-board Connectivity Market Revenue (billion) Forecast, by Application 2020 & 2033
- Table 52: Global On-board Connectivity Market Revenue billion Forecast, by Production Analysis 2020 & 2033
- Table 53: Global On-board Connectivity Market Revenue billion Forecast, by Consumption Analysis 2020 & 2033
- Table 54: Global On-board Connectivity Market Revenue billion Forecast, by Import Market Analysis (Value & Volume) 2020 & 2033
- Table 55: Global On-board Connectivity Market Revenue billion Forecast, by Export Market Analysis (Value & Volume) 2020 & 2033
- Table 56: Global On-board Connectivity Market Revenue billion Forecast, by Price Trend Analysis 2020 & 2033
- Table 57: Global On-board Connectivity Market Revenue billion Forecast, by Country 2020 & 2033
- Table 58: China On-board Connectivity Market Revenue (billion) Forecast, by Application 2020 & 2033
- Table 59: India On-board Connectivity Market Revenue (billion) Forecast, by Application 2020 & 2033
- Table 60: Japan On-board Connectivity Market Revenue (billion) Forecast, by Application 2020 & 2033
- Table 61: South Korea On-board Connectivity Market Revenue (billion) Forecast, by Application 2020 & 2033
- Table 62: ASEAN On-board Connectivity Market Revenue (billion) Forecast, by Application 2020 & 2033
- Table 63: Oceania On-board Connectivity Market Revenue (billion) Forecast, by Application 2020 & 2033
- Table 64: Rest of Asia Pacific On-board Connectivity Market Revenue (billion) Forecast, by Application 2020 & 2033
Frequently Asked Questions
1. What is the projected Compound Annual Growth Rate (CAGR) of the On-board Connectivity Market?
The projected CAGR is approximately 13.5%.
2. Which companies are prominent players in the On-board Connectivity Market?
Key companies in the market include Nokia Corp (Alcatel Lucent Enterprise Inc ), AT & T Inc, Honeywell International Inc, Rockwell Collins Inc, Inmarsat PLC, Huawei Technologies Co Ltd, ZTE Corporation, Viasat Inc *List Not Exhaustive, Bombardier Aerospace Inc, Panasonic Corporation.
3. What are the main segments of the On-board Connectivity Market?
The market segments include Production Analysis, Consumption Analysis, Import Market Analysis (Value & Volume), Export Market Analysis (Value & Volume), Price Trend Analysis.
4. Can you provide details about the market size?
The market size is estimated to be USD 10.4 billion as of 2022.
5. What are some drivers contributing to market growth?
; Increasing Number Of Air Passengers; Use Of Portable Electronic Devices.
6. What are the notable trends driving market growth?
Aviation Industry Expected to Witness Significant Growth.
7. Are there any restraints impacting market growth?
; High Cost Of Connectivity Equipments.
8. Can you provide examples of recent developments in the market?
N/A
9. What pricing options are available for accessing the report?
Pricing options include single-user, multi-user, and enterprise licenses priced at USD 4750, USD 5250, and USD 8750 respectively.
10. Is the market size provided in terms of value or volume?
The market size is provided in terms of value, measured in billion.
11. Are there any specific market keywords associated with the report?
Yes, the market keyword associated with the report is "On-board Connectivity Market," which aids in identifying and referencing the specific market segment covered.
12. How do I determine which pricing option suits my needs best?
The pricing options vary based on user requirements and access needs. Individual users may opt for single-user licenses, while businesses requiring broader access may choose multi-user or enterprise licenses for cost-effective access to the report.
13. Are there any additional resources or data provided in the On-board Connectivity Market report?
While the report offers comprehensive insights, it's advisable to review the specific contents or supplementary materials provided to ascertain if additional resources or data are available.
14. How can I stay updated on further developments or reports in the On-board Connectivity Market?
To stay informed about further developments, trends, and reports in the On-board Connectivity Market, consider subscribing to industry newsletters, following relevant companies and organizations, or regularly checking reputable industry news sources and publications.
Methodology
Step 1 - Identification of Relevant Samples Size from Population Database


Step 2 - Approaches for Defining Global Market Size (Value, Volume* & Price*)

Note*: In applicable scenarios
Step 3 - Data Sources
Primary Research
- Web Analytics
- Survey Reports
- Research Institute
- Latest Research Reports
- Opinion Leaders
Secondary Research
- Annual Reports
- White Paper
- Latest Press Release
- Industry Association
- Paid Database
- Investor Presentations

Step 4 - Data Triangulation
Involves using different sources of information in order to increase the validity of a study
These sources are likely to be stakeholders in a program - participants, other researchers, program staff, other community members, and so on.
Then we put all data in single framework & apply various statistical tools to find out the dynamic on the market.
During the analysis stage, feedback from the stakeholder groups would be compared to determine areas of agreement as well as areas of divergence