

Key Insights
The remote sensing technology market is poised for substantial expansion, driven by escalating demand across critical industries. Innovations in satellite technology, sensor miniaturization, and advanced data analytics are key growth enablers. Applications range from commercial sectors like precision agriculture, environmental monitoring, and urban planning to essential government and defense operations, including surveillance and disaster response. The market is projected to reach $25.37 billion by 2025, with an estimated compound annual growth rate (CAGR) of 11.59%. The commercial sector shows robust growth fueled by private investment in Earth observation. Within satellite mass, the 100-500kg segment is anticipated to lead due to its optimal balance of payload capacity and launch costs. Similarly, the Low Earth Orbit (LEO) segment is expected to dominate orbit classes, offering superior resolution and data acquisition capabilities. A competitive landscape features established aerospace companies and agile startups.
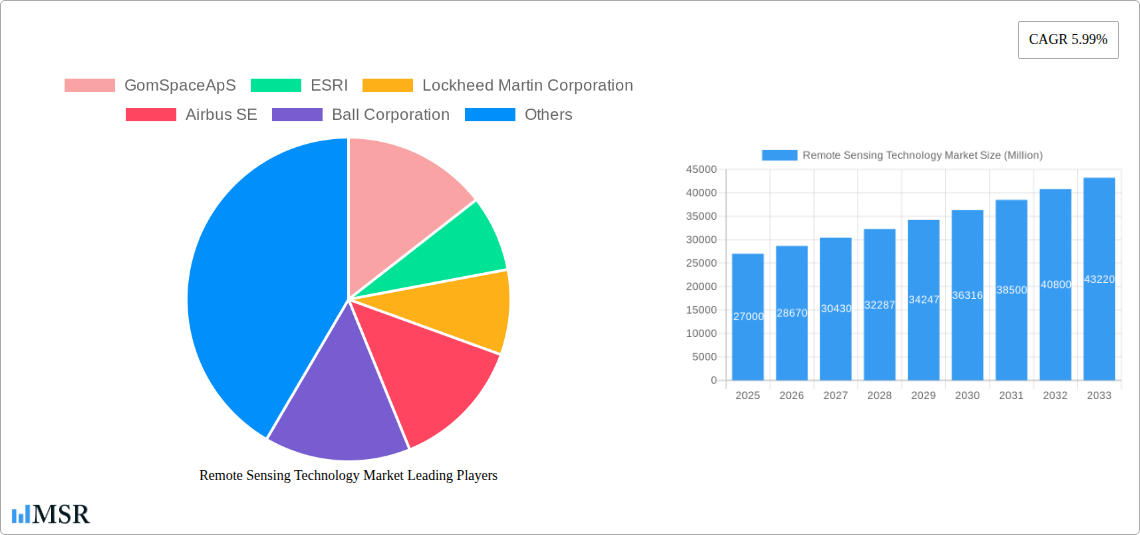
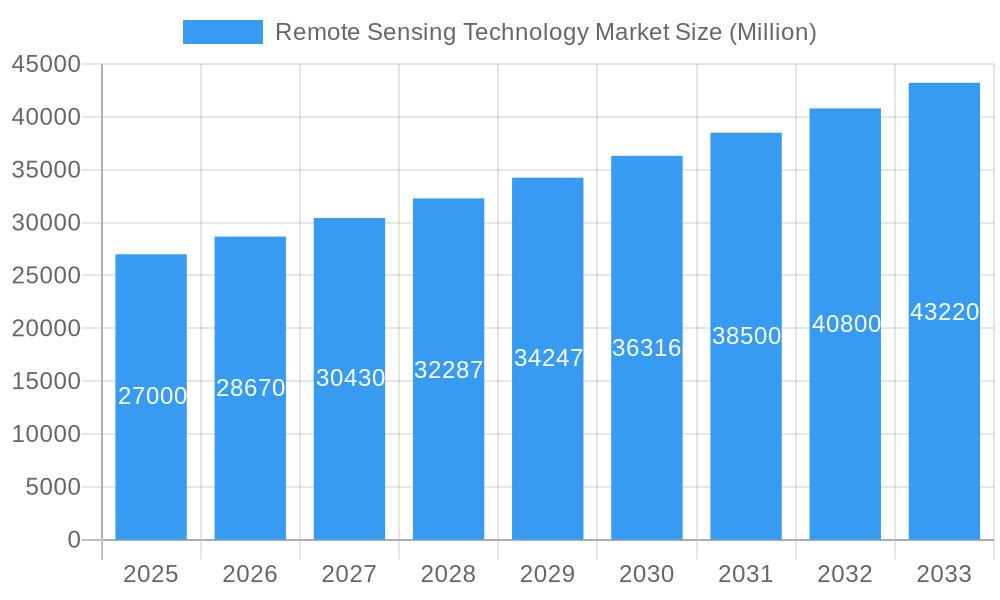
Remote Sensing Technology Market Market Size (In Billion)
Future market growth will be shaped by emerging technologies such as hyperspectral imaging, enhanced sensor resolution, and AI-driven data analysis. Government initiatives supporting space exploration and environmental monitoring, alongside increased adoption in resource management and infrastructure development, will further accelerate market penetration. Key challenges include the high cost of satellite development and launch, data security considerations, and the development of comprehensive regulatory frameworks for satellite data management. Despite these hurdles, the long-term outlook for the remote sensing technology market is highly positive, with sustained growth anticipated through 2033, driven by the ever-increasing demand for data-driven insights across diverse applications.
Remote Sensing Technology Market Company Market Share
Remote Sensing Technology Market: A Comprehensive Report (2019-2033)
This comprehensive report provides an in-depth analysis of the Remote Sensing Technology Market, offering actionable insights for industry stakeholders. Covering the period 2019-2033, with a base year of 2025 and a forecast period of 2025-2033, this report unveils market dynamics, key segments, leading players, and future growth opportunities. The global market size is estimated to reach xx Million by 2033, exhibiting a CAGR of xx% during the forecast period.
Remote Sensing Technology Market Market Concentration & Dynamics
The Remote Sensing Technology market exhibits a moderately concentrated landscape, with a few major players holding significant market share. However, the emergence of innovative startups and the increasing accessibility of space technologies are fostering a more competitive environment. Market concentration is influenced by factors like technological advancements, regulatory landscapes, and M&A activities.
Market Share: The top 5 players collectively account for approximately xx% of the global market share in 2025, with Maxar Technologies Inc., Airbus SE, and Lockheed Martin Corporation holding leading positions. However, smaller players are gaining traction through niche applications and specialized services.
Innovation Ecosystems: Robust R&D investments and collaborations between government agencies, research institutions, and private companies drive innovation. The development of miniaturized satellites and advanced sensors is reshaping the market landscape.
Regulatory Frameworks: National and international regulations regarding space debris, data privacy, and spectrum allocation significantly impact market growth. Harmonized regulations are essential for fostering market expansion.
Substitute Products: While traditional methods of data acquisition still exist, the cost-effectiveness and precision of remote sensing technologies are driving substitution.
End-User Trends: The increasing demand for real-time data across various sectors, including agriculture, urban planning, and environmental monitoring, fuels market growth. The commercial sector is a rapidly expanding segment, driven by the need for efficient resource management and improved decision-making.
M&A Activities: The past five years have witnessed a notable increase in mergers and acquisitions, reflecting the consolidation trend within the industry. xx M&A deals were recorded between 2019 and 2024, primarily driven by the pursuit of technological capabilities and market expansion.
Remote Sensing Technology Market Industry Insights & Trends
The Remote Sensing Technology market is experiencing significant growth, driven by several factors. The increasing demand for high-resolution imagery, coupled with advancements in sensor technology, data analytics, and satellite constellations, is fueling market expansion. The global market size was valued at xx Million in 2024 and is projected to reach xx Million by 2033. The market is witnessing a steady increase in the adoption of remote sensing solutions by both commercial and government sectors. Technological disruptions, such as the proliferation of small satellites and the use of Artificial Intelligence (AI) for image processing, are further accelerating growth. Evolving consumer behavior, characterized by a heightened demand for data-driven insights and personalized services, is also driving market transformation. The market's CAGR during the forecast period is projected to be xx%. Growth is further fueled by the increasing need for environmental monitoring, disaster management, and infrastructure development across various regions globally. The integration of IoT technologies with remote sensing platforms is creating new opportunities, improving data collection efficiency, and expanding application possibilities.
Key Markets & Segments Leading Remote Sensing Technology Market
The North American region currently holds a leading position in the global remote sensing technology market. This dominance is primarily attributed to the strong presence of key players, substantial investments in R&D, and robust government support for space-related initiatives.
Leading End-User Segments:
- Military & Government: This segment remains a significant driver, primarily due to the critical role of remote sensing in defense and national security applications.
- Commercial: Rapid growth in this sector is fueled by the rising need for precision agriculture, infrastructure monitoring, and environmental management.
Dominant Satellite Mass Segments:
- 10-100kg: This segment is witnessing rapid expansion due to the increasing affordability and ease of deploying smaller satellites.
- 100-500kg: This segment caters to applications requiring higher payload capacity and advanced sensor technologies.
Key Orbit Class Segments:
- LEO: Low Earth Orbit satellites are preferred for high-resolution imaging and frequent data acquisition.
- GEO: Geostationary Earth Orbit satellites are crucial for continuous monitoring of specific regions.
Prominent Satellite Subsystem Segments:
- Satellite Bus & Subsystems: This segment is essential for the overall functionality of the satellite, driving significant market demand.
- Solar Array & Power Hardware: Continuous power supply is critical for satellite operation, resulting in high demand for efficient solar arrays.
Market Drivers:
- Economic Growth: Investments in infrastructure, urbanization, and technological advancement fuel the demand for remote sensing data.
- Government Initiatives: Government support for space exploration and environmental monitoring initiatives boosts market growth.
- Technological Advancements: Miniaturization of satellites and advancements in sensor technologies enhance data quality and affordability.
Remote Sensing Technology Market Product Developments
Recent advancements focus on miniaturization, improved sensor technologies (hyperspectral, LiDAR), and advanced data analytics. These innovations offer higher resolution, increased accuracy, and cost-effective solutions. The integration of AI and machine learning algorithms enhances image processing and data interpretation, providing valuable insights for various applications. This translates to improved decision-making across multiple sectors and a competitive edge for market players.
Challenges in the Remote Sensing Technology Market Market
Significant challenges include high initial investment costs, data security concerns, regulatory hurdles in accessing and utilizing space-based data, and potential supply chain disruptions affecting component availability. The competitive landscape, marked by both established players and emerging startups, further increases market pressures. These challenges collectively impact market expansion and profitability.
Forces Driving Remote Sensing Technology Market Growth
Key growth drivers include government initiatives promoting space exploration and data access, increasing private sector investments in satellite technology, and advancements in sensor and data analytics capabilities. The expanding application of remote sensing across various sectors, such as precision agriculture, urban planning, and disaster management, fuels further market growth.
Long-Term Growth Catalysts in the Remote Sensing Technology Market
Long-term growth is fueled by continuous technological innovation, expanding international collaborations, and the integration of emerging technologies like AI and IoT. Expanding the accessibility of remote sensing data and fostering partnerships between public and private sectors are crucial catalysts. New market expansions in emerging economies also promise significant long-term potential.
Emerging Opportunities in Remote Sensing Technology Market
Emerging opportunities include the use of CubeSats for cost-effective Earth observation, the growing demand for high-resolution 3D mapping and modeling, and the development of advanced analytics platforms for interpreting remote sensing data. New application areas in areas like climate change monitoring and environmental protection present further opportunities.
Leading Players in the Remote Sensing Technology Market Sector
- GomSpace ApS
- ESRI
- Lockheed Martin Corporation
- Airbus SE
- Ball Corporation
- Japan Aerospace Exploration Agency (JAXA)
- China Aerospace Science and Technology Corporation (CASC)
- Maxar Technologies Inc
- ROSCOSMOS
- Thale
- Planet Labs Inc
- Northrop Grumman Corporation
- Indian Space Research Organisation (ISRO)
- IHI Corporation
- Spire Global Inc
Key Milestones in Remote Sensing Technology Market Industry
- March 2023: JAXA launched the H3 Launch Vehicle with ALOS-3, demonstrating advancements in Earth observation capabilities.
- February 2023: NASA and Esri's collaboration expands access to geospatial data, boosting research and development.
- January 2023: Airbus Defence and Space secured a contract with Poland for two high-performance Earth observation satellites, signifying increased demand for advanced systems.
Strategic Outlook for Remote Sensing Technology Market Market
The Remote Sensing Technology market holds significant long-term growth potential. Continued technological advancements, strategic partnerships, and expanding applications across various sectors will drive market expansion. Companies focused on innovation, data analytics, and efficient service delivery will be best positioned to capitalize on future opportunities. The market's trajectory indicates a bright future for players embracing technological disruptions and meeting the growing demand for data-driven insights.
Remote Sensing Technology Market Segmentation
-
1. Satellite Mass
- 1.1. 10-100kg
- 1.2. 100-500kg
- 1.3. 500-1000kg
- 1.4. Below 10 Kg
- 1.5. above 1000kg
-
2. Orbit Class
- 2.1. GEO
- 2.2. LEO
- 2.3. MEO
-
3. Satellite Subsystem
- 3.1. Propulsion Hardware and Propellant
- 3.2. Satellite Bus & Subsystems
- 3.3. Solar Array & Power Hardware
- 3.4. Structures, Harness & Mechanisms
-
4. End User
- 4.1. Commercial
- 4.2. Military & Government
- 4.3. Other
Remote Sensing Technology Market Segmentation By Geography
-
1. North America
- 1.1. United States
- 1.2. Canada
- 1.3. Mexico
-
2. South America
- 2.1. Brazil
- 2.2. Argentina
- 2.3. Rest of South America
-
3. Europe
- 3.1. United Kingdom
- 3.2. Germany
- 3.3. France
- 3.4. Italy
- 3.5. Spain
- 3.6. Russia
- 3.7. Benelux
- 3.8. Nordics
- 3.9. Rest of Europe
-
4. Middle East & Africa
- 4.1. Turkey
- 4.2. Israel
- 4.3. GCC
- 4.4. North Africa
- 4.5. South Africa
- 4.6. Rest of Middle East & Africa
-
5. Asia Pacific
- 5.1. China
- 5.2. India
- 5.3. Japan
- 5.4. South Korea
- 5.5. ASEAN
- 5.6. Oceania
- 5.7. Rest of Asia Pacific
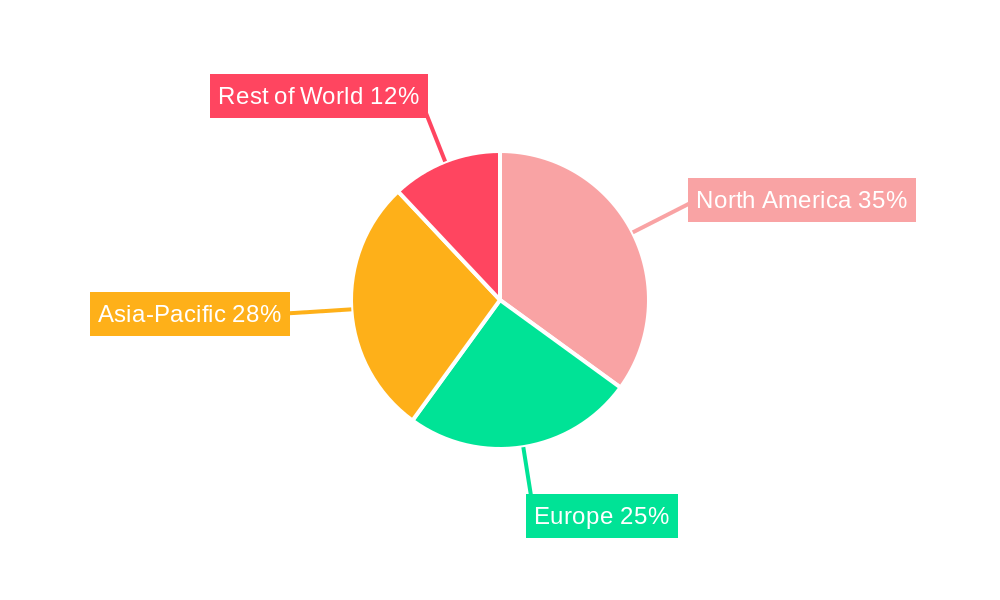
Remote Sensing Technology Market Regional Market Share
Geographic Coverage of Remote Sensing Technology Market
Remote Sensing Technology Market REPORT HIGHLIGHTS
| Aspects | Details |
|---|---|
| Study Period | 2020-2034 |
| Base Year | 2025 |
| Estimated Year | 2026 |
| Forecast Period | 2026-2034 |
| Historical Period | 2020-2025 |
| Growth Rate | CAGR of 11.59% from 2020-2034 |
| Segmentation |
|
Table of Contents
- 1. Introduction
- 1.1. Research Scope
- 1.2. Market Segmentation
- 1.3. Research Objective
- 1.4. Definitions and Assumptions
- 2. Executive Summary
- 2.1. Market Snapshot
- 3. Market Dynamics
- 3.1. Market Drivers
- 3.2. Market Restrains
- 3.3. Market Trends
- 3.4. Market Opportunities
- 4. Market Factor Analysis
- 4.1. Porters Five Forces
- 4.1.1. Bargaining Power of Suppliers
- 4.1.2. Bargaining Power of Buyers
- 4.1.3. Threat of New Entrants
- 4.1.4. Threat of Substitutes
- 4.1.5. Competitive Rivalry
- 4.2. PESTEL analysis
- 4.3. BCG Analysis
- 4.3.1. Stars (High Growth, High Market Share)
- 4.3.2. Cash Cows (Low Growth, High Market Share)
- 4.3.3. Question Mark (High Growth, Low Market Share)
- 4.3.4. Dogs (Low Growth, Low Market Share)
- 4.4. Ansoff Matrix Analysis
- 4.5. Supply Chain Analysis
- 4.6. Regulatory Landscape
- 4.7. Current Market Potential and Opportunity Assessment (TAM–SAM–SOM Framework)
- 4.8. MSR Analyst Note
- 4.1. Porters Five Forces
- 5. Market Analysis, Insights and Forecast 2021-2033
- 5.1. Market Analysis, Insights and Forecast - by Satellite Mass
- 5.1.1. 10-100kg
- 5.1.2. 100-500kg
- 5.1.3. 500-1000kg
- 5.1.4. Below 10 Kg
- 5.1.5. above 1000kg
- 5.2. Market Analysis, Insights and Forecast - by Orbit Class
- 5.2.1. GEO
- 5.2.2. LEO
- 5.2.3. MEO
- 5.3. Market Analysis, Insights and Forecast - by Satellite Subsystem
- 5.3.1. Propulsion Hardware and Propellant
- 5.3.2. Satellite Bus & Subsystems
- 5.3.3. Solar Array & Power Hardware
- 5.3.4. Structures, Harness & Mechanisms
- 5.4. Market Analysis, Insights and Forecast - by End User
- 5.4.1. Commercial
- 5.4.2. Military & Government
- 5.4.3. Other
- 5.5. Market Analysis, Insights and Forecast - by Region
- 5.5.1. North America
- 5.5.2. South America
- 5.5.3. Europe
- 5.5.4. Middle East & Africa
- 5.5.5. Asia Pacific
- 5.1. Market Analysis, Insights and Forecast - by Satellite Mass
- 6. Global Remote Sensing Technology Market Analysis, Insights and Forecast, 2021-2033
- 6.1. Market Analysis, Insights and Forecast - by Satellite Mass
- 6.1.1. 10-100kg
- 6.1.2. 100-500kg
- 6.1.3. 500-1000kg
- 6.1.4. Below 10 Kg
- 6.1.5. above 1000kg
- 6.2. Market Analysis, Insights and Forecast - by Orbit Class
- 6.2.1. GEO
- 6.2.2. LEO
- 6.2.3. MEO
- 6.3. Market Analysis, Insights and Forecast - by Satellite Subsystem
- 6.3.1. Propulsion Hardware and Propellant
- 6.3.2. Satellite Bus & Subsystems
- 6.3.3. Solar Array & Power Hardware
- 6.3.4. Structures, Harness & Mechanisms
- 6.4. Market Analysis, Insights and Forecast - by End User
- 6.4.1. Commercial
- 6.4.2. Military & Government
- 6.4.3. Other
- 6.1. Market Analysis, Insights and Forecast - by Satellite Mass
- 7. North America Remote Sensing Technology Market Analysis, Insights and Forecast, 2020-2032
- 7.1. Market Analysis, Insights and Forecast - by Satellite Mass
- 7.1.1. 10-100kg
- 7.1.2. 100-500kg
- 7.1.3. 500-1000kg
- 7.1.4. Below 10 Kg
- 7.1.5. above 1000kg
- 7.2. Market Analysis, Insights and Forecast - by Orbit Class
- 7.2.1. GEO
- 7.2.2. LEO
- 7.2.3. MEO
- 7.3. Market Analysis, Insights and Forecast - by Satellite Subsystem
- 7.3.1. Propulsion Hardware and Propellant
- 7.3.2. Satellite Bus & Subsystems
- 7.3.3. Solar Array & Power Hardware
- 7.3.4. Structures, Harness & Mechanisms
- 7.4. Market Analysis, Insights and Forecast - by End User
- 7.4.1. Commercial
- 7.4.2. Military & Government
- 7.4.3. Other
- 7.1. Market Analysis, Insights and Forecast - by Satellite Mass
- 8. South America Remote Sensing Technology Market Analysis, Insights and Forecast, 2020-2032
- 8.1. Market Analysis, Insights and Forecast - by Satellite Mass
- 8.1.1. 10-100kg
- 8.1.2. 100-500kg
- 8.1.3. 500-1000kg
- 8.1.4. Below 10 Kg
- 8.1.5. above 1000kg
- 8.2. Market Analysis, Insights and Forecast - by Orbit Class
- 8.2.1. GEO
- 8.2.2. LEO
- 8.2.3. MEO
- 8.3. Market Analysis, Insights and Forecast - by Satellite Subsystem
- 8.3.1. Propulsion Hardware and Propellant
- 8.3.2. Satellite Bus & Subsystems
- 8.3.3. Solar Array & Power Hardware
- 8.3.4. Structures, Harness & Mechanisms
- 8.4. Market Analysis, Insights and Forecast - by End User
- 8.4.1. Commercial
- 8.4.2. Military & Government
- 8.4.3. Other
- 8.1. Market Analysis, Insights and Forecast - by Satellite Mass
- 9. Europe Remote Sensing Technology Market Analysis, Insights and Forecast, 2020-2032
- 9.1. Market Analysis, Insights and Forecast - by Satellite Mass
- 9.1.1. 10-100kg
- 9.1.2. 100-500kg
- 9.1.3. 500-1000kg
- 9.1.4. Below 10 Kg
- 9.1.5. above 1000kg
- 9.2. Market Analysis, Insights and Forecast - by Orbit Class
- 9.2.1. GEO
- 9.2.2. LEO
- 9.2.3. MEO
- 9.3. Market Analysis, Insights and Forecast - by Satellite Subsystem
- 9.3.1. Propulsion Hardware and Propellant
- 9.3.2. Satellite Bus & Subsystems
- 9.3.3. Solar Array & Power Hardware
- 9.3.4. Structures, Harness & Mechanisms
- 9.4. Market Analysis, Insights and Forecast - by End User
- 9.4.1. Commercial
- 9.4.2. Military & Government
- 9.4.3. Other
- 9.1. Market Analysis, Insights and Forecast - by Satellite Mass
- 10. Middle East & Africa Remote Sensing Technology Market Analysis, Insights and Forecast, 2020-2032
- 10.1. Market Analysis, Insights and Forecast - by Satellite Mass
- 10.1.1. 10-100kg
- 10.1.2. 100-500kg
- 10.1.3. 500-1000kg
- 10.1.4. Below 10 Kg
- 10.1.5. above 1000kg
- 10.2. Market Analysis, Insights and Forecast - by Orbit Class
- 10.2.1. GEO
- 10.2.2. LEO
- 10.2.3. MEO
- 10.3. Market Analysis, Insights and Forecast - by Satellite Subsystem
- 10.3.1. Propulsion Hardware and Propellant
- 10.3.2. Satellite Bus & Subsystems
- 10.3.3. Solar Array & Power Hardware
- 10.3.4. Structures, Harness & Mechanisms
- 10.4. Market Analysis, Insights and Forecast - by End User
- 10.4.1. Commercial
- 10.4.2. Military & Government
- 10.4.3. Other
- 10.1. Market Analysis, Insights and Forecast - by Satellite Mass
- 11. Asia Pacific Remote Sensing Technology Market Analysis, Insights and Forecast, 2020-2032
- 11.1. Market Analysis, Insights and Forecast - by Satellite Mass
- 11.1.1. 10-100kg
- 11.1.2. 100-500kg
- 11.1.3. 500-1000kg
- 11.1.4. Below 10 Kg
- 11.1.5. above 1000kg
- 11.2. Market Analysis, Insights and Forecast - by Orbit Class
- 11.2.1. GEO
- 11.2.2. LEO
- 11.2.3. MEO
- 11.3. Market Analysis, Insights and Forecast - by Satellite Subsystem
- 11.3.1. Propulsion Hardware and Propellant
- 11.3.2. Satellite Bus & Subsystems
- 11.3.3. Solar Array & Power Hardware
- 11.3.4. Structures, Harness & Mechanisms
- 11.4. Market Analysis, Insights and Forecast - by End User
- 11.4.1. Commercial
- 11.4.2. Military & Government
- 11.4.3. Other
- 11.1. Market Analysis, Insights and Forecast - by Satellite Mass
- 12. Competitive Analysis
- 12.1. Company Profiles
- 12.1.1 GomSpaceApS
- 12.1.1.1. Company Overview
- 12.1.1.2. Products
- 12.1.1.3. Company Financials
- 12.1.1.4. SWOT Analysis
- 12.1.2 ESRI
- 12.1.2.1. Company Overview
- 12.1.2.2. Products
- 12.1.2.3. Company Financials
- 12.1.2.4. SWOT Analysis
- 12.1.3 Lockheed Martin Corporation
- 12.1.3.1. Company Overview
- 12.1.3.2. Products
- 12.1.3.3. Company Financials
- 12.1.3.4. SWOT Analysis
- 12.1.4 Airbus SE
- 12.1.4.1. Company Overview
- 12.1.4.2. Products
- 12.1.4.3. Company Financials
- 12.1.4.4. SWOT Analysis
- 12.1.5 Ball Corporation
- 12.1.5.1. Company Overview
- 12.1.5.2. Products
- 12.1.5.3. Company Financials
- 12.1.5.4. SWOT Analysis
- 12.1.6 Japan Aerospace Exploration Agency (JAXA)
- 12.1.6.1. Company Overview
- 12.1.6.2. Products
- 12.1.6.3. Company Financials
- 12.1.6.4. SWOT Analysis
- 12.1.7 China Aerospace Science and Technology Corporation (CASC)
- 12.1.7.1. Company Overview
- 12.1.7.2. Products
- 12.1.7.3. Company Financials
- 12.1.7.4. SWOT Analysis
- 12.1.8 Maxar Technologies Inc
- 12.1.8.1. Company Overview
- 12.1.8.2. Products
- 12.1.8.3. Company Financials
- 12.1.8.4. SWOT Analysis
- 12.1.9 ROSCOSMOS
- 12.1.9.1. Company Overview
- 12.1.9.2. Products
- 12.1.9.3. Company Financials
- 12.1.9.4. SWOT Analysis
- 12.1.10 Thale
- 12.1.10.1. Company Overview
- 12.1.10.2. Products
- 12.1.10.3. Company Financials
- 12.1.10.4. SWOT Analysis
- 12.1.11 Planet Labs Inc
- 12.1.11.1. Company Overview
- 12.1.11.2. Products
- 12.1.11.3. Company Financials
- 12.1.11.4. SWOT Analysis
- 12.1.12 Northrop Grumman Corporation
- 12.1.12.1. Company Overview
- 12.1.12.2. Products
- 12.1.12.3. Company Financials
- 12.1.12.4. SWOT Analysis
- 12.1.13 Indian Space Research Organisation (ISRO)
- 12.1.13.1. Company Overview
- 12.1.13.2. Products
- 12.1.13.3. Company Financials
- 12.1.13.4. SWOT Analysis
- 12.1.14 IHI Corporation
- 12.1.14.1. Company Overview
- 12.1.14.2. Products
- 12.1.14.3. Company Financials
- 12.1.14.4. SWOT Analysis
- 12.1.15 Spire Global Inc
- 12.1.15.1. Company Overview
- 12.1.15.2. Products
- 12.1.15.3. Company Financials
- 12.1.15.4. SWOT Analysis
- 12.1.1 GomSpaceApS
- 12.2. Market Entropy
- 12.2.1 Company's Key Areas Served
- 12.2.2 Recent Developments
- 12.3. Company Market Share Analysis 2025
- 12.3.1 Top 5 Companies Market Share Analysis
- 12.3.2 Top 3 Companies Market Share Analysis
- 12.4. List of Potential Customers
- 13. Research Methodology
List of Figures
- Figure 1: Global Remote Sensing Technology Market Revenue Breakdown (billion, %) by Region 2025 & 2033
- Figure 2: North America Remote Sensing Technology Market Revenue (billion), by Satellite Mass 2025 & 2033
- Figure 3: North America Remote Sensing Technology Market Revenue Share (%), by Satellite Mass 2025 & 2033
- Figure 4: North America Remote Sensing Technology Market Revenue (billion), by Orbit Class 2025 & 2033
- Figure 5: North America Remote Sensing Technology Market Revenue Share (%), by Orbit Class 2025 & 2033
- Figure 6: North America Remote Sensing Technology Market Revenue (billion), by Satellite Subsystem 2025 & 2033
- Figure 7: North America Remote Sensing Technology Market Revenue Share (%), by Satellite Subsystem 2025 & 2033
- Figure 8: North America Remote Sensing Technology Market Revenue (billion), by End User 2025 & 2033
- Figure 9: North America Remote Sensing Technology Market Revenue Share (%), by End User 2025 & 2033
- Figure 10: North America Remote Sensing Technology Market Revenue (billion), by Country 2025 & 2033
- Figure 11: North America Remote Sensing Technology Market Revenue Share (%), by Country 2025 & 2033
- Figure 12: South America Remote Sensing Technology Market Revenue (billion), by Satellite Mass 2025 & 2033
- Figure 13: South America Remote Sensing Technology Market Revenue Share (%), by Satellite Mass 2025 & 2033
- Figure 14: South America Remote Sensing Technology Market Revenue (billion), by Orbit Class 2025 & 2033
- Figure 15: South America Remote Sensing Technology Market Revenue Share (%), by Orbit Class 2025 & 2033
- Figure 16: South America Remote Sensing Technology Market Revenue (billion), by Satellite Subsystem 2025 & 2033
- Figure 17: South America Remote Sensing Technology Market Revenue Share (%), by Satellite Subsystem 2025 & 2033
- Figure 18: South America Remote Sensing Technology Market Revenue (billion), by End User 2025 & 2033
- Figure 19: South America Remote Sensing Technology Market Revenue Share (%), by End User 2025 & 2033
- Figure 20: South America Remote Sensing Technology Market Revenue (billion), by Country 2025 & 2033
- Figure 21: South America Remote Sensing Technology Market Revenue Share (%), by Country 2025 & 2033
- Figure 22: Europe Remote Sensing Technology Market Revenue (billion), by Satellite Mass 2025 & 2033
- Figure 23: Europe Remote Sensing Technology Market Revenue Share (%), by Satellite Mass 2025 & 2033
- Figure 24: Europe Remote Sensing Technology Market Revenue (billion), by Orbit Class 2025 & 2033
- Figure 25: Europe Remote Sensing Technology Market Revenue Share (%), by Orbit Class 2025 & 2033
- Figure 26: Europe Remote Sensing Technology Market Revenue (billion), by Satellite Subsystem 2025 & 2033
- Figure 27: Europe Remote Sensing Technology Market Revenue Share (%), by Satellite Subsystem 2025 & 2033
- Figure 28: Europe Remote Sensing Technology Market Revenue (billion), by End User 2025 & 2033
- Figure 29: Europe Remote Sensing Technology Market Revenue Share (%), by End User 2025 & 2033
- Figure 30: Europe Remote Sensing Technology Market Revenue (billion), by Country 2025 & 2033
- Figure 31: Europe Remote Sensing Technology Market Revenue Share (%), by Country 2025 & 2033
- Figure 32: Middle East & Africa Remote Sensing Technology Market Revenue (billion), by Satellite Mass 2025 & 2033
- Figure 33: Middle East & Africa Remote Sensing Technology Market Revenue Share (%), by Satellite Mass 2025 & 2033
- Figure 34: Middle East & Africa Remote Sensing Technology Market Revenue (billion), by Orbit Class 2025 & 2033
- Figure 35: Middle East & Africa Remote Sensing Technology Market Revenue Share (%), by Orbit Class 2025 & 2033
- Figure 36: Middle East & Africa Remote Sensing Technology Market Revenue (billion), by Satellite Subsystem 2025 & 2033
- Figure 37: Middle East & Africa Remote Sensing Technology Market Revenue Share (%), by Satellite Subsystem 2025 & 2033
- Figure 38: Middle East & Africa Remote Sensing Technology Market Revenue (billion), by End User 2025 & 2033
- Figure 39: Middle East & Africa Remote Sensing Technology Market Revenue Share (%), by End User 2025 & 2033
- Figure 40: Middle East & Africa Remote Sensing Technology Market Revenue (billion), by Country 2025 & 2033
- Figure 41: Middle East & Africa Remote Sensing Technology Market Revenue Share (%), by Country 2025 & 2033
- Figure 42: Asia Pacific Remote Sensing Technology Market Revenue (billion), by Satellite Mass 2025 & 2033
- Figure 43: Asia Pacific Remote Sensing Technology Market Revenue Share (%), by Satellite Mass 2025 & 2033
- Figure 44: Asia Pacific Remote Sensing Technology Market Revenue (billion), by Orbit Class 2025 & 2033
- Figure 45: Asia Pacific Remote Sensing Technology Market Revenue Share (%), by Orbit Class 2025 & 2033
- Figure 46: Asia Pacific Remote Sensing Technology Market Revenue (billion), by Satellite Subsystem 2025 & 2033
- Figure 47: Asia Pacific Remote Sensing Technology Market Revenue Share (%), by Satellite Subsystem 2025 & 2033
- Figure 48: Asia Pacific Remote Sensing Technology Market Revenue (billion), by End User 2025 & 2033
- Figure 49: Asia Pacific Remote Sensing Technology Market Revenue Share (%), by End User 2025 & 2033
- Figure 50: Asia Pacific Remote Sensing Technology Market Revenue (billion), by Country 2025 & 2033
- Figure 51: Asia Pacific Remote Sensing Technology Market Revenue Share (%), by Country 2025 & 2033
List of Tables
- Table 1: Global Remote Sensing Technology Market Revenue billion Forecast, by Satellite Mass 2020 & 2033
- Table 2: Global Remote Sensing Technology Market Revenue billion Forecast, by Orbit Class 2020 & 2033
- Table 3: Global Remote Sensing Technology Market Revenue billion Forecast, by Satellite Subsystem 2020 & 2033
- Table 4: Global Remote Sensing Technology Market Revenue billion Forecast, by End User 2020 & 2033
- Table 5: Global Remote Sensing Technology Market Revenue billion Forecast, by Region 2020 & 2033
- Table 6: Global Remote Sensing Technology Market Revenue billion Forecast, by Satellite Mass 2020 & 2033
- Table 7: Global Remote Sensing Technology Market Revenue billion Forecast, by Orbit Class 2020 & 2033
- Table 8: Global Remote Sensing Technology Market Revenue billion Forecast, by Satellite Subsystem 2020 & 2033
- Table 9: Global Remote Sensing Technology Market Revenue billion Forecast, by End User 2020 & 2033
- Table 10: Global Remote Sensing Technology Market Revenue billion Forecast, by Country 2020 & 2033
- Table 11: United States Remote Sensing Technology Market Revenue (billion) Forecast, by Application 2020 & 2033
- Table 12: Canada Remote Sensing Technology Market Revenue (billion) Forecast, by Application 2020 & 2033
- Table 13: Mexico Remote Sensing Technology Market Revenue (billion) Forecast, by Application 2020 & 2033
- Table 14: Global Remote Sensing Technology Market Revenue billion Forecast, by Satellite Mass 2020 & 2033
- Table 15: Global Remote Sensing Technology Market Revenue billion Forecast, by Orbit Class 2020 & 2033
- Table 16: Global Remote Sensing Technology Market Revenue billion Forecast, by Satellite Subsystem 2020 & 2033
- Table 17: Global Remote Sensing Technology Market Revenue billion Forecast, by End User 2020 & 2033
- Table 18: Global Remote Sensing Technology Market Revenue billion Forecast, by Country 2020 & 2033
- Table 19: Brazil Remote Sensing Technology Market Revenue (billion) Forecast, by Application 2020 & 2033
- Table 20: Argentina Remote Sensing Technology Market Revenue (billion) Forecast, by Application 2020 & 2033
- Table 21: Rest of South America Remote Sensing Technology Market Revenue (billion) Forecast, by Application 2020 & 2033
- Table 22: Global Remote Sensing Technology Market Revenue billion Forecast, by Satellite Mass 2020 & 2033
- Table 23: Global Remote Sensing Technology Market Revenue billion Forecast, by Orbit Class 2020 & 2033
- Table 24: Global Remote Sensing Technology Market Revenue billion Forecast, by Satellite Subsystem 2020 & 2033
- Table 25: Global Remote Sensing Technology Market Revenue billion Forecast, by End User 2020 & 2033
- Table 26: Global Remote Sensing Technology Market Revenue billion Forecast, by Country 2020 & 2033
- Table 27: United Kingdom Remote Sensing Technology Market Revenue (billion) Forecast, by Application 2020 & 2033
- Table 28: Germany Remote Sensing Technology Market Revenue (billion) Forecast, by Application 2020 & 2033
- Table 29: France Remote Sensing Technology Market Revenue (billion) Forecast, by Application 2020 & 2033
- Table 30: Italy Remote Sensing Technology Market Revenue (billion) Forecast, by Application 2020 & 2033
- Table 31: Spain Remote Sensing Technology Market Revenue (billion) Forecast, by Application 2020 & 2033
- Table 32: Russia Remote Sensing Technology Market Revenue (billion) Forecast, by Application 2020 & 2033
- Table 33: Benelux Remote Sensing Technology Market Revenue (billion) Forecast, by Application 2020 & 2033
- Table 34: Nordics Remote Sensing Technology Market Revenue (billion) Forecast, by Application 2020 & 2033
- Table 35: Rest of Europe Remote Sensing Technology Market Revenue (billion) Forecast, by Application 2020 & 2033
- Table 36: Global Remote Sensing Technology Market Revenue billion Forecast, by Satellite Mass 2020 & 2033
- Table 37: Global Remote Sensing Technology Market Revenue billion Forecast, by Orbit Class 2020 & 2033
- Table 38: Global Remote Sensing Technology Market Revenue billion Forecast, by Satellite Subsystem 2020 & 2033
- Table 39: Global Remote Sensing Technology Market Revenue billion Forecast, by End User 2020 & 2033
- Table 40: Global Remote Sensing Technology Market Revenue billion Forecast, by Country 2020 & 2033
- Table 41: Turkey Remote Sensing Technology Market Revenue (billion) Forecast, by Application 2020 & 2033
- Table 42: Israel Remote Sensing Technology Market Revenue (billion) Forecast, by Application 2020 & 2033
- Table 43: GCC Remote Sensing Technology Market Revenue (billion) Forecast, by Application 2020 & 2033
- Table 44: North Africa Remote Sensing Technology Market Revenue (billion) Forecast, by Application 2020 & 2033
- Table 45: South Africa Remote Sensing Technology Market Revenue (billion) Forecast, by Application 2020 & 2033
- Table 46: Rest of Middle East & Africa Remote Sensing Technology Market Revenue (billion) Forecast, by Application 2020 & 2033
- Table 47: Global Remote Sensing Technology Market Revenue billion Forecast, by Satellite Mass 2020 & 2033
- Table 48: Global Remote Sensing Technology Market Revenue billion Forecast, by Orbit Class 2020 & 2033
- Table 49: Global Remote Sensing Technology Market Revenue billion Forecast, by Satellite Subsystem 2020 & 2033
- Table 50: Global Remote Sensing Technology Market Revenue billion Forecast, by End User 2020 & 2033
- Table 51: Global Remote Sensing Technology Market Revenue billion Forecast, by Country 2020 & 2033
- Table 52: China Remote Sensing Technology Market Revenue (billion) Forecast, by Application 2020 & 2033
- Table 53: India Remote Sensing Technology Market Revenue (billion) Forecast, by Application 2020 & 2033
- Table 54: Japan Remote Sensing Technology Market Revenue (billion) Forecast, by Application 2020 & 2033
- Table 55: South Korea Remote Sensing Technology Market Revenue (billion) Forecast, by Application 2020 & 2033
- Table 56: ASEAN Remote Sensing Technology Market Revenue (billion) Forecast, by Application 2020 & 2033
- Table 57: Oceania Remote Sensing Technology Market Revenue (billion) Forecast, by Application 2020 & 2033
- Table 58: Rest of Asia Pacific Remote Sensing Technology Market Revenue (billion) Forecast, by Application 2020 & 2033
Frequently Asked Questions
1. What is the projected Compound Annual Growth Rate (CAGR) of the Remote Sensing Technology Market?
The projected CAGR is approximately 11.59%.
2. Which companies are prominent players in the Remote Sensing Technology Market?
Key companies in the market include GomSpaceApS, ESRI, Lockheed Martin Corporation, Airbus SE, Ball Corporation, Japan Aerospace Exploration Agency (JAXA), China Aerospace Science and Technology Corporation (CASC), Maxar Technologies Inc, ROSCOSMOS, Thale, Planet Labs Inc, Northrop Grumman Corporation, Indian Space Research Organisation (ISRO), IHI Corporation, Spire Global Inc.
3. What are the main segments of the Remote Sensing Technology Market?
The market segments include Satellite Mass, Orbit Class, Satellite Subsystem, End User.
4. Can you provide details about the market size?
The market size is estimated to be USD 25.37 billion as of 2022.
5. What are some drivers contributing to market growth?
N/A
6. What are the notable trends driving market growth?
OTHER KEY INDUSTRY TRENDS COVERED IN THE REPORT.
7. Are there any restraints impacting market growth?
N/A
8. Can you provide examples of recent developments in the market?
March 2023: The Japan Aerospace Exploration Agency (JAXA) had scheduled the launch of the first H3 Launch Vehicle with the Advanced Land Observing Satellite "Daichi 3" (ALOS-3) onboard from the Tanegashima Space Center.February 2023: NASA and geographic information service provider Esri will grant wider access to the space agency's geospatial content for research and exploration purposes through the Space Act Agreement.January 2023: Airbus Defence and Space has signed a contract with Poland to provide a geospatial intelligence system including the development, manufacture, launch and delivery in orbit of two high-performance optical Earth observation satellites.
9. What pricing options are available for accessing the report?
Pricing options include single-user, multi-user, and enterprise licenses priced at USD 3800, USD 4500, and USD 5800 respectively.
10. Is the market size provided in terms of value or volume?
The market size is provided in terms of value, measured in billion.
11. Are there any specific market keywords associated with the report?
Yes, the market keyword associated with the report is "Remote Sensing Technology Market," which aids in identifying and referencing the specific market segment covered.
12. How do I determine which pricing option suits my needs best?
The pricing options vary based on user requirements and access needs. Individual users may opt for single-user licenses, while businesses requiring broader access may choose multi-user or enterprise licenses for cost-effective access to the report.
13. Are there any additional resources or data provided in the Remote Sensing Technology Market report?
While the report offers comprehensive insights, it's advisable to review the specific contents or supplementary materials provided to ascertain if additional resources or data are available.
14. How can I stay updated on further developments or reports in the Remote Sensing Technology Market?
To stay informed about further developments, trends, and reports in the Remote Sensing Technology Market, consider subscribing to industry newsletters, following relevant companies and organizations, or regularly checking reputable industry news sources and publications.
Methodology
Step 1 - Identification of Relevant Samples Size from Population Database


Step 2 - Approaches for Defining Global Market Size (Value, Volume* & Price*)

Note*: In applicable scenarios
Step 3 - Data Sources
Primary Research
- Web Analytics
- Survey Reports
- Research Institute
- Latest Research Reports
- Opinion Leaders
Secondary Research
- Annual Reports
- White Paper
- Latest Press Release
- Industry Association
- Paid Database
- Investor Presentations

Step 4 - Data Triangulation
Involves using different sources of information in order to increase the validity of a study
These sources are likely to be stakeholders in a program - participants, other researchers, program staff, other community members, and so on.
Then we put all data in single framework & apply various statistical tools to find out the dynamic on the market.
During the analysis stage, feedback from the stakeholder groups would be compared to determine areas of agreement as well as areas of divergence