

Key Insights
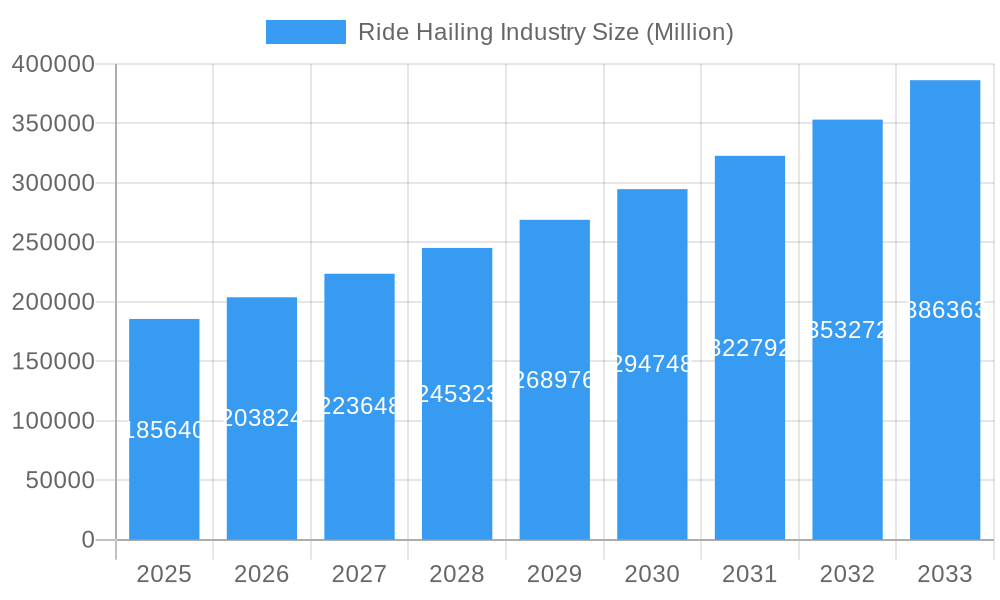
The ride-hailing market, valued at $185.64 billion in 2025, is experiencing robust growth, projected to expand at a Compound Annual Growth Rate (CAGR) of 9.64% from 2025 to 2033. This expansion is driven by several key factors. Increasing urbanization and the rising preference for convenient and affordable transportation options are fueling demand, particularly in densely populated areas. Technological advancements, such as improved ride-matching algorithms and the integration of GPS technology, enhance efficiency and user experience. Furthermore, the expanding adoption of electric vehicles (EVs) within the ride-hailing sector presents a significant opportunity for growth, aligning with global sustainability initiatives and potentially reducing operational costs for companies. The market is segmented by vehicle type (motorcycles, cars, vans, buses) and propulsion type (Internal Combustion Engine (ICE) and electric), with the car segment currently dominating. Competition among major players like Uber, Didi, Ola, and Grab, along with emerging regional players, is intense, leading to dynamic pricing strategies and service innovations. Regulatory challenges, including licensing requirements and safety concerns, pose significant restraints on market growth, varying considerably across different geographic regions.
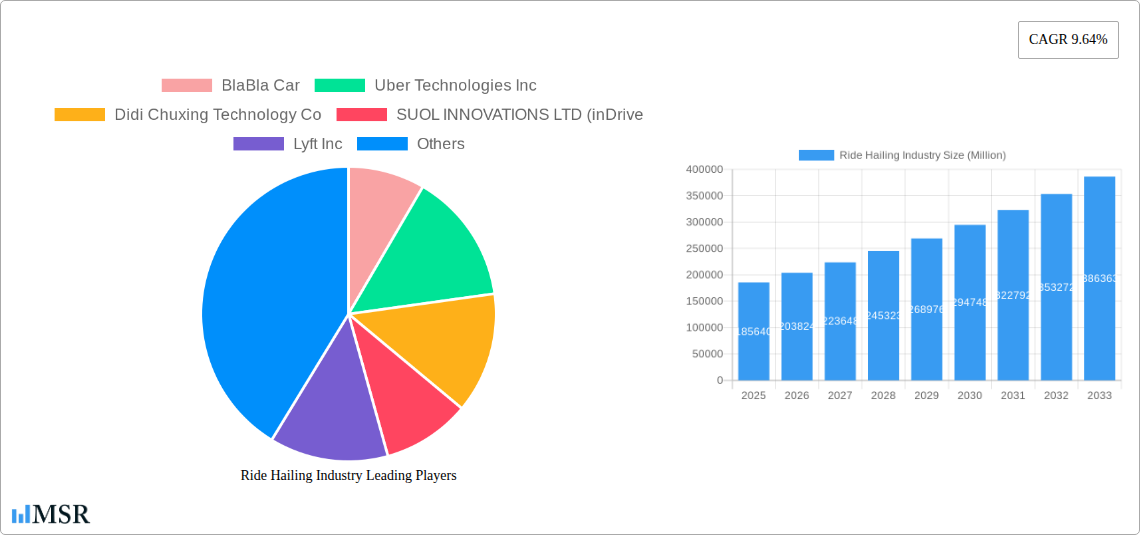
Ride Hailing Industry Market Size (In Billion)
Growth is geographically diverse, with North America and Asia Pacific representing substantial market shares, driven by high population densities and strong technological adoption rates. Europe also shows significant growth potential, although regulatory frameworks might influence its pace. The increasing use of ride-hailing services for last-mile delivery and business travel further contributes to market expansion. However, challenges remain in areas such as driver compensation, maintaining service quality across various markets, and adapting to evolving consumer preferences and expectations. The industry's continued success will hinge on its ability to address these challenges, including providing a safe and reliable service while ensuring profitable operations for participating companies. The integration of innovative technologies such as autonomous driving, while presenting long-term growth opportunities, requires overcoming significant technological and regulatory hurdles.
Ride Hailing Industry Company Market Share
Ride Hailing Industry Market Report: 2019-2033
This comprehensive report provides an in-depth analysis of the global ride-hailing industry, encompassing market size, growth drivers, key players, and future trends. The study period covers 2019-2033, with 2025 as the base year and a forecast period of 2025-2033. This report is essential for industry stakeholders, investors, and anyone seeking to understand the dynamics of this rapidly evolving sector. The global market size is estimated at $xx Million in 2025, exhibiting a CAGR of xx% during the forecast period.
Ride Hailing Industry Market Concentration & Dynamics
The ride-hailing market exhibits high concentration, dominated by a few global giants and regional players. Market share is constantly shifting due to aggressive expansion strategies, technological innovations, and regulatory changes. The industry is characterized by intense competition, with companies focusing on pricing strategies, service differentiation, and technological advancements to gain a competitive edge. Uber Technologies Inc. and Didi Chuxing Technology Co. currently hold significant market share, while regional players like Grab Holdings Inc. and GoTo Group (GoJek) dominate specific geographic areas.
- Market Concentration: High, with top 5 players accounting for approximately xx% of the global market in 2025.
- Innovation Ecosystems: Rapid technological advancements in areas like autonomous driving and AI are reshaping the industry landscape.
- Regulatory Frameworks: Vary significantly across countries, influencing operational costs and market entry barriers.
- Substitute Products: Public transportation, personal vehicles, and alternative mobility services present competition.
- End-User Trends: Growing preference for convenient and affordable transportation fuels market growth.
- M&A Activities: Numerous mergers and acquisitions have taken place in the past five years (xx deals in the 2019-2024 historical period), driven by consolidation and expansion strategies.
Ride Hailing Industry Industry Insights & Trends
The ride-hailing industry is experiencing robust growth fueled by several key factors. The increasing urbanization and rising disposable incomes are driving demand for convenient and affordable transportation solutions. The adoption of smartphones and the penetration of mobile internet are facilitating the seamless access and use of ride-hailing apps. Moreover, technological innovations in autonomous vehicles and AI-powered services are poised to revolutionize the industry. The market is further characterized by shifting consumer preferences towards on-demand services and a growing focus on sustainability, leading to an increase in the adoption of electric vehicles within the ride-hailing sector.
The global ride-hailing market size is projected to reach $xx Million by 2033, exhibiting a compound annual growth rate (CAGR) of xx% during the forecast period (2025-2033). This growth is primarily driven by factors such as increasing smartphone penetration, rising urbanization, and the growing adoption of ride-sharing services. Technological advancements, particularly in the area of autonomous vehicles, are also expected to significantly impact market growth in the coming years.
Key Markets & Segments Leading Ride Hailing Industry
The Asia-Pacific region is currently the leading market for ride-hailing services, driven by high population density, rapid urbanization, and increasing smartphone penetration. Within the segments, the car segment dominates due to its versatility and affordability, although the motorcycle segment holds a strong position in specific regions. The ICE propulsion type currently dominates, but the electric segment is expected to witness significant growth due to environmental concerns and government regulations.
By Vehicle Type:
- Cars: Largest segment due to versatility and widespread appeal.
- Motorcycles: Significant share in densely populated Asian markets.
- Vans: Growing demand for group travel and logistics.
- Buses: Niche segment focusing on mass transit solutions.
By Propulsion Type:
- Internal Combustion Engine (ICE): Currently the dominant propulsion type.
- Electric: Rapidly growing due to environmental concerns and government incentives. Market growth drivers include favorable government policies, technological advancements, and the increasing adoption of electric vehicles.
Dominant Regions and Countries: Asia-Pacific (China, India, Southeast Asia) shows the most significant market dominance. Drivers include rapid urbanization, increasing middle class, and high smartphone penetration.
Ride Hailing Industry Product Developments
Recent innovations include advancements in ride-sharing algorithms, optimized route planning, and integration of payment systems. The development of autonomous vehicle technology is expected to significantly disrupt the market, offering improved efficiency and safety. Integration with other mobility services and the rise of micro-mobility solutions are further shaping the product landscape. These developments provide competitive edges for companies who can offer seamless, efficient, and cost-effective services.
Challenges in the Ride Hailing Industry Market
The ride-hailing industry faces various challenges, including stringent regulatory frameworks that vary across different regions, leading to operational complexities and increased costs. Supply chain disruptions and fluctuations in fuel prices affect profitability. Intense competition from established players and the emergence of new entrants necessitates constant innovation and adaptability. Furthermore, driver shortages and safety concerns impact service reliability.
Forces Driving Ride Hailing Industry Growth
Technological advancements, particularly in autonomous driving and AI, are major growth catalysts. Favorable government policies encouraging the adoption of ride-hailing services and investments in transportation infrastructure also contribute to market expansion. Economic growth and increasing urbanization further fuel demand for convenient and efficient transportation solutions. Specific examples include government subsidies for electric vehicles and the development of smart city initiatives.
Challenges in the Ride Hailing Industry Market
Long-term growth hinges on addressing regulatory uncertainties, fostering collaboration with governments to establish clear guidelines, and investing in sustainable transportation solutions, including a wider adoption of electric vehicle fleets. Strategic partnerships with other businesses, especially in the logistics and tourism sectors, are key to broadening market reach. Expansion into new and underserved markets globally presents further opportunities.
Emerging Opportunities in Ride Hailing Industry
The integration of ride-hailing platforms with public transportation systems presents a significant opportunity. The expansion into last-mile delivery and logistics offers diversification and new revenue streams. The growing demand for sustainable transportation opens avenues for electric vehicle integration and carbon offsetting initiatives. Finally, personalized and customized services, catering to specific user preferences, represent an emerging niche.
Leading Players in the Ride Hailing Industry Sector
Key Milestones in Ride Hailing Industry Industry
- December 2023: TH International Limited partners with Didi Chuxing for a brand-building campaign.
- March 2024: Waymo launches its free ride-hailing service, Waymo One, in Los Angeles.
- April 2024: Japan legalizes and implements the use of private ride-hailing services through mobile apps.
Strategic Outlook for Ride Hailing Industry Market
The future of the ride-hailing industry is bright, driven by technological innovations, strategic partnerships, and expansion into new markets. The integration of autonomous vehicles and the development of sustainable transportation solutions are poised to shape the industry landscape. Companies that effectively adapt to regulatory changes, embrace technological advancements, and focus on providing superior customer experiences will thrive in this dynamic market. The long-term potential for growth remains significant, especially in emerging economies and developing regions.
Ride Hailing Industry Segmentation
-
1. Vehicle Type
- 1.1. Motorcycles
- 1.2. Cars
- 1.3. Vans
- 1.4. Buses
-
2. Propulsion Type
- 2.1. Internal Combustion Engine (ICE)
- 2.2. Electric
Ride Hailing Industry Segmentation By Geography
-
1. North America
- 1.1. United States
- 1.2. Canada
- 1.3. Rest of North America
-
2. Europe
- 2.1. Germany
- 2.2. United Kingdom
- 2.3. France
- 2.4. Italy
- 2.5. Rest of Europe
-
3. Asia Pacific
- 3.1. China
- 3.2. India
- 3.3. Japan
- 3.4. South Korea
- 3.5. Rest of Asia Pacific
-
4. Rest of the World
- 4.1. South America
- 4.2. Middle East and Africa
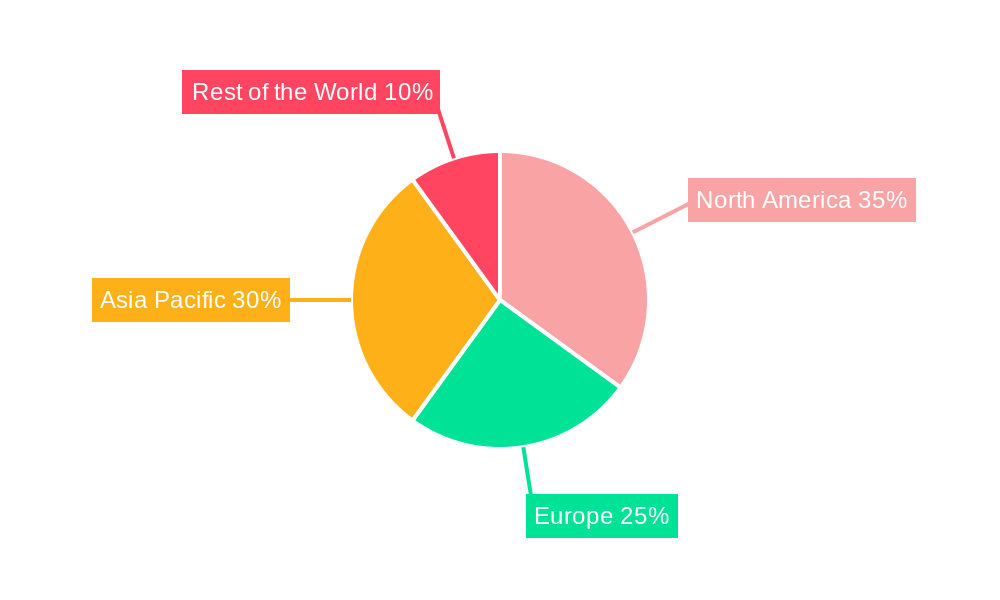
Ride Hailing Industry Regional Market Share
Geographic Coverage of Ride Hailing Industry
Ride Hailing Industry REPORT HIGHLIGHTS
| Aspects | Details |
|---|---|
| Study Period | 2020-2034 |
| Base Year | 2025 |
| Estimated Year | 2026 |
| Forecast Period | 2026-2034 |
| Historical Period | 2020-2025 |
| Growth Rate | CAGR of 9.64% from 2020-2034 |
| Segmentation |
|
Table of Contents
- 1. Introduction
- 1.1. Research Scope
- 1.2. Market Segmentation
- 1.3. Research Objective
- 1.4. Definitions and Assumptions
- 2. Executive Summary
- 2.1. Market Snapshot
- 3. Market Dynamics
- 3.1. Market Drivers
- 3.2. Market Restrains
- 3.3. Market Trends
- 3.4. Market Opportunities
- 4. Market Factor Analysis
- 4.1. Porters Five Forces
- 4.1.1. Bargaining Power of Suppliers
- 4.1.2. Bargaining Power of Buyers
- 4.1.3. Threat of New Entrants
- 4.1.4. Threat of Substitutes
- 4.1.5. Competitive Rivalry
- 4.2. PESTEL analysis
- 4.3. BCG Analysis
- 4.3.1. Stars (High Growth, High Market Share)
- 4.3.2. Cash Cows (Low Growth, High Market Share)
- 4.3.3. Question Mark (High Growth, Low Market Share)
- 4.3.4. Dogs (Low Growth, Low Market Share)
- 4.4. Ansoff Matrix Analysis
- 4.5. Supply Chain Analysis
- 4.6. Regulatory Landscape
- 4.7. Current Market Potential and Opportunity Assessment (TAM–SAM–SOM Framework)
- 4.8. MSR Analyst Note
- 4.1. Porters Five Forces
- 5. Market Analysis, Insights and Forecast 2021-2033
- 5.1. Market Analysis, Insights and Forecast - by Vehicle Type
- 5.1.1. Motorcycles
- 5.1.2. Cars
- 5.1.3. Vans
- 5.1.4. Buses
- 5.2. Market Analysis, Insights and Forecast - by Propulsion Type
- 5.2.1. Internal Combustion Engine (ICE)
- 5.2.2. Electric
- 5.3. Market Analysis, Insights and Forecast - by Region
- 5.3.1. North America
- 5.3.2. Europe
- 5.3.3. Asia Pacific
- 5.3.4. Rest of the World
- 5.1. Market Analysis, Insights and Forecast - by Vehicle Type
- 6. Global Ride Hailing Industry Analysis, Insights and Forecast, 2021-2033
- 6.1. Market Analysis, Insights and Forecast - by Vehicle Type
- 6.1.1. Motorcycles
- 6.1.2. Cars
- 6.1.3. Vans
- 6.1.4. Buses
- 6.2. Market Analysis, Insights and Forecast - by Propulsion Type
- 6.2.1. Internal Combustion Engine (ICE)
- 6.2.2. Electric
- 6.1. Market Analysis, Insights and Forecast - by Vehicle Type
- 7. North America Ride Hailing Industry Analysis, Insights and Forecast, 2020-2032
- 7.1. Market Analysis, Insights and Forecast - by Vehicle Type
- 7.1.1. Motorcycles
- 7.1.2. Cars
- 7.1.3. Vans
- 7.1.4. Buses
- 7.2. Market Analysis, Insights and Forecast - by Propulsion Type
- 7.2.1. Internal Combustion Engine (ICE)
- 7.2.2. Electric
- 7.1. Market Analysis, Insights and Forecast - by Vehicle Type
- 8. Europe Ride Hailing Industry Analysis, Insights and Forecast, 2020-2032
- 8.1. Market Analysis, Insights and Forecast - by Vehicle Type
- 8.1.1. Motorcycles
- 8.1.2. Cars
- 8.1.3. Vans
- 8.1.4. Buses
- 8.2. Market Analysis, Insights and Forecast - by Propulsion Type
- 8.2.1. Internal Combustion Engine (ICE)
- 8.2.2. Electric
- 8.1. Market Analysis, Insights and Forecast - by Vehicle Type
- 9. Asia Pacific Ride Hailing Industry Analysis, Insights and Forecast, 2020-2032
- 9.1. Market Analysis, Insights and Forecast - by Vehicle Type
- 9.1.1. Motorcycles
- 9.1.2. Cars
- 9.1.3. Vans
- 9.1.4. Buses
- 9.2. Market Analysis, Insights and Forecast - by Propulsion Type
- 9.2.1. Internal Combustion Engine (ICE)
- 9.2.2. Electric
- 9.1. Market Analysis, Insights and Forecast - by Vehicle Type
- 10. Rest of the World Ride Hailing Industry Analysis, Insights and Forecast, 2020-2032
- 10.1. Market Analysis, Insights and Forecast - by Vehicle Type
- 10.1.1. Motorcycles
- 10.1.2. Cars
- 10.1.3. Vans
- 10.1.4. Buses
- 10.2. Market Analysis, Insights and Forecast - by Propulsion Type
- 10.2.1. Internal Combustion Engine (ICE)
- 10.2.2. Electric
- 10.1. Market Analysis, Insights and Forecast - by Vehicle Type
- 11. Competitive Analysis
- 11.1. Company Profiles
- 11.1.1 BlaBla Car
- 11.1.1.1. Company Overview
- 11.1.1.2. Products
- 11.1.1.3. Company Financials
- 11.1.1.4. SWOT Analysis
- 11.1.2 Uber Technologies Inc
- 11.1.2.1. Company Overview
- 11.1.2.2. Products
- 11.1.2.3. Company Financials
- 11.1.2.4. SWOT Analysis
- 11.1.3 Didi Chuxing Technology Co
- 11.1.3.1. Company Overview
- 11.1.3.2. Products
- 11.1.3.3. Company Financials
- 11.1.3.4. SWOT Analysis
- 11.1.4 SUOL INNOVATIONS LTD (inDrive
- 11.1.4.1. Company Overview
- 11.1.4.2. Products
- 11.1.4.3. Company Financials
- 11.1.4.4. SWOT Analysis
- 11.1.5 Lyft Inc
- 11.1.5.1. Company Overview
- 11.1.5.2. Products
- 11.1.5.3. Company Financials
- 11.1.5.4. SWOT Analysis
- 11.1.6 Ani Technologies Pvt Ltd (OLA)
- 11.1.6.1. Company Overview
- 11.1.6.2. Products
- 11.1.6.3. Company Financials
- 11.1.6.4. SWOT Analysis
- 11.1.7 Gett Group
- 11.1.7.1. Company Overview
- 11.1.7.2. Products
- 11.1.7.3. Company Financials
- 11.1.7.4. SWOT Analysis
- 11.1.8 Bolt Technology OU
- 11.1.8.1. Company Overview
- 11.1.8.2. Products
- 11.1.8.3. Company Financials
- 11.1.8.4. SWOT Analysis
- 11.1.9 Maxi Mobility SL (Cabify)
- 11.1.9.1. Company Overview
- 11.1.9.2. Products
- 11.1.9.3. Company Financials
- 11.1.9.4. SWOT Analysis
- 11.1.10 GoTo Group (GoJek)
- 11.1.10.1. Company Overview
- 11.1.10.2. Products
- 11.1.10.3. Company Financials
- 11.1.10.4. SWOT Analysis
- 11.1.11 Xanh SM (GSM)
- 11.1.11.1. Company Overview
- 11.1.11.2. Products
- 11.1.11.3. Company Financials
- 11.1.11.4. SWOT Analysis
- 11.1.12 Grab Holdings Inc
- 11.1.12.1. Company Overview
- 11.1.12.2. Products
- 11.1.12.3. Company Financials
- 11.1.12.4. SWOT Analysis
- 11.1.1 BlaBla Car
- 11.2. Market Entropy
- 11.2.1 Company's Key Areas Served
- 11.2.2 Recent Developments
- 11.3. Company Market Share Analysis 2025
- 11.3.1 Top 5 Companies Market Share Analysis
- 11.3.2 Top 3 Companies Market Share Analysis
- 11.4. List of Potential Customers
- 12. Research Methodology
List of Figures
- Figure 1: Global Ride Hailing Industry Revenue Breakdown (Million, %) by Region 2025 & 2033
- Figure 2: North America Ride Hailing Industry Revenue (Million), by Vehicle Type 2025 & 2033
- Figure 3: North America Ride Hailing Industry Revenue Share (%), by Vehicle Type 2025 & 2033
- Figure 4: North America Ride Hailing Industry Revenue (Million), by Propulsion Type 2025 & 2033
- Figure 5: North America Ride Hailing Industry Revenue Share (%), by Propulsion Type 2025 & 2033
- Figure 6: North America Ride Hailing Industry Revenue (Million), by Country 2025 & 2033
- Figure 7: North America Ride Hailing Industry Revenue Share (%), by Country 2025 & 2033
- Figure 8: Europe Ride Hailing Industry Revenue (Million), by Vehicle Type 2025 & 2033
- Figure 9: Europe Ride Hailing Industry Revenue Share (%), by Vehicle Type 2025 & 2033
- Figure 10: Europe Ride Hailing Industry Revenue (Million), by Propulsion Type 2025 & 2033
- Figure 11: Europe Ride Hailing Industry Revenue Share (%), by Propulsion Type 2025 & 2033
- Figure 12: Europe Ride Hailing Industry Revenue (Million), by Country 2025 & 2033
- Figure 13: Europe Ride Hailing Industry Revenue Share (%), by Country 2025 & 2033
- Figure 14: Asia Pacific Ride Hailing Industry Revenue (Million), by Vehicle Type 2025 & 2033
- Figure 15: Asia Pacific Ride Hailing Industry Revenue Share (%), by Vehicle Type 2025 & 2033
- Figure 16: Asia Pacific Ride Hailing Industry Revenue (Million), by Propulsion Type 2025 & 2033
- Figure 17: Asia Pacific Ride Hailing Industry Revenue Share (%), by Propulsion Type 2025 & 2033
- Figure 18: Asia Pacific Ride Hailing Industry Revenue (Million), by Country 2025 & 2033
- Figure 19: Asia Pacific Ride Hailing Industry Revenue Share (%), by Country 2025 & 2033
- Figure 20: Rest of the World Ride Hailing Industry Revenue (Million), by Vehicle Type 2025 & 2033
- Figure 21: Rest of the World Ride Hailing Industry Revenue Share (%), by Vehicle Type 2025 & 2033
- Figure 22: Rest of the World Ride Hailing Industry Revenue (Million), by Propulsion Type 2025 & 2033
- Figure 23: Rest of the World Ride Hailing Industry Revenue Share (%), by Propulsion Type 2025 & 2033
- Figure 24: Rest of the World Ride Hailing Industry Revenue (Million), by Country 2025 & 2033
- Figure 25: Rest of the World Ride Hailing Industry Revenue Share (%), by Country 2025 & 2033
List of Tables
- Table 1: Global Ride Hailing Industry Revenue Million Forecast, by Vehicle Type 2020 & 2033
- Table 2: Global Ride Hailing Industry Revenue Million Forecast, by Propulsion Type 2020 & 2033
- Table 3: Global Ride Hailing Industry Revenue Million Forecast, by Region 2020 & 2033
- Table 4: Global Ride Hailing Industry Revenue Million Forecast, by Vehicle Type 2020 & 2033
- Table 5: Global Ride Hailing Industry Revenue Million Forecast, by Propulsion Type 2020 & 2033
- Table 6: Global Ride Hailing Industry Revenue Million Forecast, by Country 2020 & 2033
- Table 7: United States Ride Hailing Industry Revenue (Million) Forecast, by Application 2020 & 2033
- Table 8: Canada Ride Hailing Industry Revenue (Million) Forecast, by Application 2020 & 2033
- Table 9: Rest of North America Ride Hailing Industry Revenue (Million) Forecast, by Application 2020 & 2033
- Table 10: Global Ride Hailing Industry Revenue Million Forecast, by Vehicle Type 2020 & 2033
- Table 11: Global Ride Hailing Industry Revenue Million Forecast, by Propulsion Type 2020 & 2033
- Table 12: Global Ride Hailing Industry Revenue Million Forecast, by Country 2020 & 2033
- Table 13: Germany Ride Hailing Industry Revenue (Million) Forecast, by Application 2020 & 2033
- Table 14: United Kingdom Ride Hailing Industry Revenue (Million) Forecast, by Application 2020 & 2033
- Table 15: France Ride Hailing Industry Revenue (Million) Forecast, by Application 2020 & 2033
- Table 16: Italy Ride Hailing Industry Revenue (Million) Forecast, by Application 2020 & 2033
- Table 17: Rest of Europe Ride Hailing Industry Revenue (Million) Forecast, by Application 2020 & 2033
- Table 18: Global Ride Hailing Industry Revenue Million Forecast, by Vehicle Type 2020 & 2033
- Table 19: Global Ride Hailing Industry Revenue Million Forecast, by Propulsion Type 2020 & 2033
- Table 20: Global Ride Hailing Industry Revenue Million Forecast, by Country 2020 & 2033
- Table 21: China Ride Hailing Industry Revenue (Million) Forecast, by Application 2020 & 2033
- Table 22: India Ride Hailing Industry Revenue (Million) Forecast, by Application 2020 & 2033
- Table 23: Japan Ride Hailing Industry Revenue (Million) Forecast, by Application 2020 & 2033
- Table 24: South Korea Ride Hailing Industry Revenue (Million) Forecast, by Application 2020 & 2033
- Table 25: Rest of Asia Pacific Ride Hailing Industry Revenue (Million) Forecast, by Application 2020 & 2033
- Table 26: Global Ride Hailing Industry Revenue Million Forecast, by Vehicle Type 2020 & 2033
- Table 27: Global Ride Hailing Industry Revenue Million Forecast, by Propulsion Type 2020 & 2033
- Table 28: Global Ride Hailing Industry Revenue Million Forecast, by Country 2020 & 2033
- Table 29: South America Ride Hailing Industry Revenue (Million) Forecast, by Application 2020 & 2033
- Table 30: Middle East and Africa Ride Hailing Industry Revenue (Million) Forecast, by Application 2020 & 2033
Frequently Asked Questions
1. What is the projected Compound Annual Growth Rate (CAGR) of the Ride Hailing Industry?
The projected CAGR is approximately 9.64%.
2. Which companies are prominent players in the Ride Hailing Industry?
Key companies in the market include BlaBla Car, Uber Technologies Inc, Didi Chuxing Technology Co, SUOL INNOVATIONS LTD (inDrive, Lyft Inc, Ani Technologies Pvt Ltd (OLA), Gett Group, Bolt Technology OU, Maxi Mobility SL (Cabify), GoTo Group (GoJek), Xanh SM (GSM), Grab Holdings Inc.
3. What are the main segments of the Ride Hailing Industry?
The market segments include Vehicle Type, Propulsion Type.
4. Can you provide details about the market size?
The market size is estimated to be USD 185.64 Million as of 2022.
5. What are some drivers contributing to market growth?
Rising Traffic Congestion and Increasing Urban Population to Foster Market Growth.
6. What are the notable trends driving market growth?
The Cars Segment is Expected to Gain Traction During the Forecast Period.
7. Are there any restraints impacting market growth?
Strict Government Regulations and Policies Toward Ride-hailing Services Impact the Market Growth.
8. Can you provide examples of recent developments in the market?
April 2024: The Japanese government implemented the use of private ride-hailing services, which are accessible through mobile applications such as Uber and Go.
9. What pricing options are available for accessing the report?
Pricing options include single-user, multi-user, and enterprise licenses priced at USD 4750, USD 5250, and USD 8750 respectively.
10. Is the market size provided in terms of value or volume?
The market size is provided in terms of value, measured in Million.
11. Are there any specific market keywords associated with the report?
Yes, the market keyword associated with the report is "Ride Hailing Industry," which aids in identifying and referencing the specific market segment covered.
12. How do I determine which pricing option suits my needs best?
The pricing options vary based on user requirements and access needs. Individual users may opt for single-user licenses, while businesses requiring broader access may choose multi-user or enterprise licenses for cost-effective access to the report.
13. Are there any additional resources or data provided in the Ride Hailing Industry report?
While the report offers comprehensive insights, it's advisable to review the specific contents or supplementary materials provided to ascertain if additional resources or data are available.
14. How can I stay updated on further developments or reports in the Ride Hailing Industry?
To stay informed about further developments, trends, and reports in the Ride Hailing Industry, consider subscribing to industry newsletters, following relevant companies and organizations, or regularly checking reputable industry news sources and publications.
Methodology
Step 1 - Identification of Relevant Samples Size from Population Database


Step 2 - Approaches for Defining Global Market Size (Value, Volume* & Price*)

Note*: In applicable scenarios
Step 3 - Data Sources
Primary Research
- Web Analytics
- Survey Reports
- Research Institute
- Latest Research Reports
- Opinion Leaders
Secondary Research
- Annual Reports
- White Paper
- Latest Press Release
- Industry Association
- Paid Database
- Investor Presentations

Step 4 - Data Triangulation
Involves using different sources of information in order to increase the validity of a study
These sources are likely to be stakeholders in a program - participants, other researchers, program staff, other community members, and so on.
Then we put all data in single framework & apply various statistical tools to find out the dynamic on the market.
During the analysis stage, feedback from the stakeholder groups would be compared to determine areas of agreement as well as areas of divergence