

Key Insights
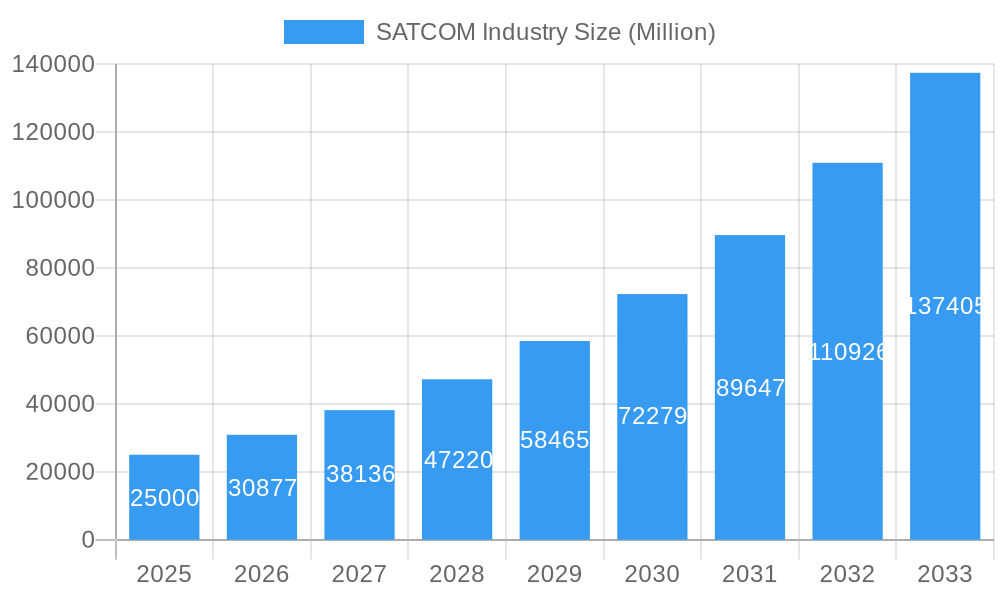
The global Satellite Communication (SATCOM) market is poised for substantial expansion, driven by escalating demand for high-bandwidth, reliable connectivity across diverse industries. The market is currently valued at $98.28 billion in the base year of 2025 and is projected to grow at a Compound Annual Growth Rate (CAGR) of 11% through 2033. Key growth drivers include the burgeoning proliferation of IoT devices requiring ubiquitous connectivity, the expanding adoption of satellite broadband in unserved and underserved regions, significant advancements in satellite technology offering higher throughput and lower latency, and the increasing strategic importance of SATCOM for defense and government applications. Analysis of market segments indicates that the 100-500kg satellite mass category holds a significant share due to its cost-efficiency and application versatility. Within orbit classes, Low Earth Orbit (LEO) constellations are leading, providing superior latency and coverage compared to Geostationary Earth Orbit (GEO) satellites. Broadcasting and Mobile Communication remain dominant application types, with a notable increase in demand within the 'Other' category, encompassing emerging applications like Earth observation and navigation.
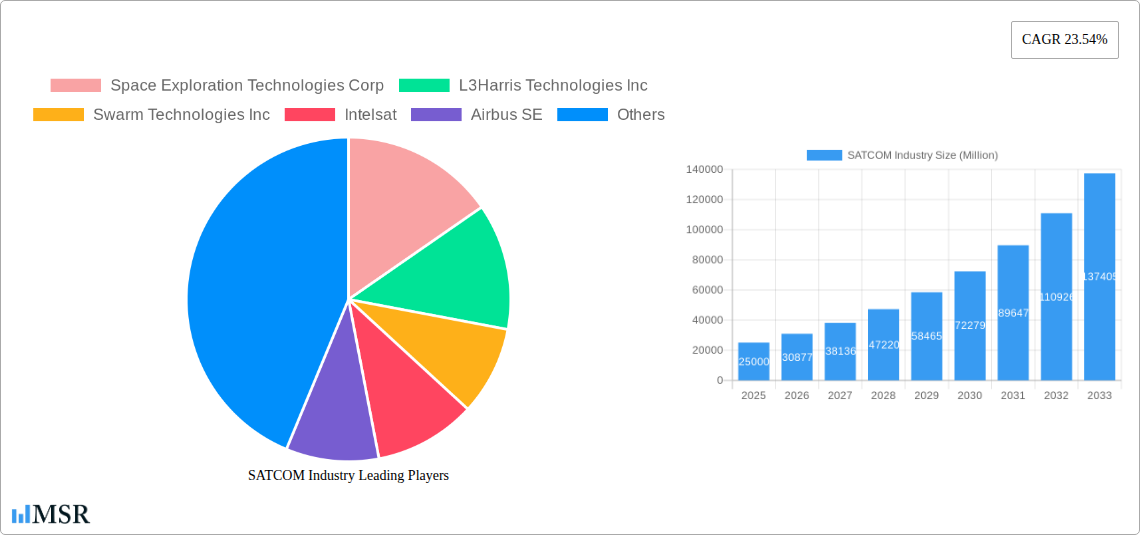
SATCOM Industry Market Size (In Billion)
The competitive environment features a dynamic interplay between established industry leaders and emerging innovators. Major contributors such as SpaceX, Intelsat, and Airbus SE leverage their extensive infrastructure and technological prowess. Concurrently, agile startups are increasingly capturing market share by focusing on specialized niches and pioneering new technologies. Market restraints include the significant capital investment required for satellite development and launch, evolving regulatory frameworks, and the persistent challenge of space debris. Despite these obstacles, the long-term outlook for the SATCOM industry remains exceptionally positive, underpinned by ongoing technological innovation and the unabated global demand for robust connectivity solutions.
SATCOM Industry Company Market Share
SATCOM Industry Market Report: 2019-2033 Forecast
This comprehensive report provides a detailed analysis of the global Satellite Communication (SATCOM) industry, covering market size, growth drivers, key segments, leading players, and future opportunities. The study period spans from 2019 to 2033, with 2025 serving as the base and estimated year. The report leverages extensive market research to deliver actionable insights for industry stakeholders, investors, and strategists. The global SATCOM market is projected to reach xx Million by 2033, exhibiting a CAGR of xx% during the forecast period (2025-2033).
SATCOM Industry Market Concentration & Dynamics
The SATCOM industry exhibits a moderately concentrated market structure, with a few dominant players controlling a significant share. However, the emergence of new entrants, particularly in the LEO segment, is increasing competition. Innovation is driven by advancements in satellite technology, including miniaturization, increased bandwidth, and improved efficiency. Regulatory frameworks vary across regions, impacting market access and operations. Substitute technologies, such as terrestrial fiber optics and 5G, pose a challenge, particularly in areas with robust terrestrial infrastructure. End-user trends are shifting towards higher bandwidth demands and more sophisticated communication services. M&A activities are frequent, reflecting industry consolidation and strategic expansion efforts. Based on our analysis in 2025, the top 5 players hold approximately xx% of the market share, while the remaining share is distributed among numerous smaller players. The number of M&A deals in the sector averaged xx per year during the historical period (2019-2024).
- Market Share Concentration: Top 5 players hold approximately xx% of the global market.
- M&A Activity: An average of xx M&A deals per year during 2019-2024.
- Regulatory Landscape: Varies significantly across regions, impacting market access and investment decisions.
- Substitute Technologies: Terrestrial fiber optics and 5G networks present competitive pressure.
- End-User Trends: Increasing demand for higher bandwidth and advanced communication services.
SATCOM Industry Insights & Trends
The SATCOM market is experiencing robust growth fueled by several factors, including increasing demand for broadband internet access in remote and underserved areas, the expansion of government and military applications, and the rise of the Internet of Things (IoT). Technological advancements, such as the deployment of Low Earth Orbit (LEO) constellations, are significantly impacting market dynamics, offering higher bandwidth and lower latency. Evolving consumer behaviors, characterized by a growing reliance on data-intensive applications and connected devices, are further driving market expansion. The market size in 2025 is estimated at xx Million, with projected growth to xx Million by 2033.
Key Markets & Segments Leading SATCOM Industry
The commercial segment is the largest end-user segment, driven by robust growth in broadband services, IoT, and enterprise applications. Within satellite mass, the 100-500kg segment holds a significant share due to its cost-effectiveness and capability. GEO remains a dominant orbit class, catering to established broadcasting and communication services. However, LEO is rapidly gaining traction due to its potential for higher bandwidth and lower latency. Mobile communication and broadcasting are major communication types. Key regional markets include North America, Europe, and Asia-Pacific.
- Dominant Segment: Commercial end-user segment.
- Dominant Satellite Mass: 100-500kg segment.
- Dominant Orbit Class: GEO, with rapid LEO growth.
- Dominant Communication Type: Mobile communication and broadcasting.
- Key Regional Markets: North America, Europe, and Asia-Pacific.
- Growth Drivers:
- Economic growth and increasing disposable incomes.
- Expanding infrastructure in developing nations.
- Government initiatives to bridge the digital divide.
SATCOM Industry Product Developments
Recent innovations include the development of smaller, more efficient satellites, high-throughput satellites (HTS), and advanced ground segment technologies. These advancements are enabling higher bandwidth, lower latency, and improved cost-effectiveness. Competition is intensifying as companies strive to differentiate their offerings through enhanced capabilities, innovative service packages, and strategic partnerships. These developments are shaping the competitive landscape and driving market growth.
Challenges in the SATCOM Industry Market
The SATCOM industry faces challenges including stringent regulatory approvals, complex supply chains susceptible to disruptions, and intense competition from terrestrial technologies. These factors impact market entry, operational costs, and profitability. Furthermore, the high capital investment required for satellite development and deployment poses a significant barrier to entry for new players. These challenges can lead to xx% reduction in overall market growth each year, if not mitigated effectively.
Forces Driving SATCOM Industry Growth
Technological advancements, such as the deployment of mega-constellations, are driving market expansion. Increased demand for high-speed internet access in underserved areas, particularly in developing countries, is also fueling growth. Government initiatives to enhance national security and communication infrastructure provide additional impetus. The increasing adoption of IoT devices further supports the growth trajectory.
Challenges in the SATCOM Industry Market
Long-term growth will be driven by continued investment in advanced technologies, strategic partnerships to leverage expertise and resources, and expansion into new markets. Focus on enhancing service reliability, reducing latency, and providing cost-effective solutions will be crucial for sustaining market growth. Increased collaboration between government and private sector companies will aid the market evolution and expansion.
Emerging Opportunities in SATCOM Industry
Emerging opportunities include the growing demand for satellite-based IoT solutions, the expansion of satellite broadband services in developing countries, and the integration of SATCOM with other technologies, such as AI and machine learning. The increasing adoption of space-based services will further drive opportunities within the sector. New applications like precision agriculture, disaster response, and remote sensing are also opening up new market segments.
Leading Players in the SATCOM Industry Sector
- Space Exploration Technologies Corp
- L3Harris Technologies Inc
- Swarm Technologies Inc
- Intelsat
- Airbus SE
- Viasat Inc
- Cobham Limited
- China Aerospace Science and Technology Corporation (CASC)
- Thales
- SKY Perfect JSAT Corporation
- SES S A
- Maxar Technologies Inc
- Thuraya Telecommunications Company
- EchoStar Corporation
Key Milestones in SATCOM Industry Industry
- February 2023: Anuvu and Telesat partnered to develop new antennas and ground station infrastructure for the Anuvu Constellation, expanding high-speed connectivity solutions.
- February 2023: SES, ThinKom, and Hughes launched a multi-orbit service for government aerial missions, showcasing the ThinAir Ka2517 terminal's capabilities.
- January 2023: Viasat secured a contract with the U.S. Marine Corps, extending its satellite communications support. These developments illustrate the industry's focus on enhancing capabilities and expanding into new applications.
Strategic Outlook for SATCOM Industry Market
The SATCOM industry is poised for continued growth, driven by technological innovation, increasing demand for connectivity, and expanding applications. Strategic opportunities include focusing on LEO constellations for higher bandwidth and lower latency, developing new applications for IoT and other emerging technologies, and pursuing strategic partnerships to leverage expertise and resources. The market presents significant potential for companies that can adapt to evolving technological advancements and consumer needs.
SATCOM Industry Segmentation
-
1. Satellite Mass
- 1.1. 10-100kg
- 1.2. 100-500kg
- 1.3. 500-1000kg
- 1.4. Below 10 Kg
- 1.5. above 1000kg
-
2. Orbit Class
- 2.1. GEO
- 2.2. LEO
- 2.3. MEO
-
3. Communication Type
- 3.1. Broadcasting
- 3.2. Mobile Communication
- 3.3. Satellite Phone
- 3.4. Others
-
4. End User
- 4.1. Commercial
- 4.2. Military & Government
- 4.3. Other
SATCOM Industry Segmentation By Geography
-
1. North America
- 1.1. United States
- 1.2. Canada
- 1.3. Mexico
-
2. South America
- 2.1. Brazil
- 2.2. Argentina
- 2.3. Rest of South America
-
3. Europe
- 3.1. United Kingdom
- 3.2. Germany
- 3.3. France
- 3.4. Italy
- 3.5. Spain
- 3.6. Russia
- 3.7. Benelux
- 3.8. Nordics
- 3.9. Rest of Europe
-
4. Middle East & Africa
- 4.1. Turkey
- 4.2. Israel
- 4.3. GCC
- 4.4. North Africa
- 4.5. South Africa
- 4.6. Rest of Middle East & Africa
-
5. Asia Pacific
- 5.1. China
- 5.2. India
- 5.3. Japan
- 5.4. South Korea
- 5.5. ASEAN
- 5.6. Oceania
- 5.7. Rest of Asia Pacific
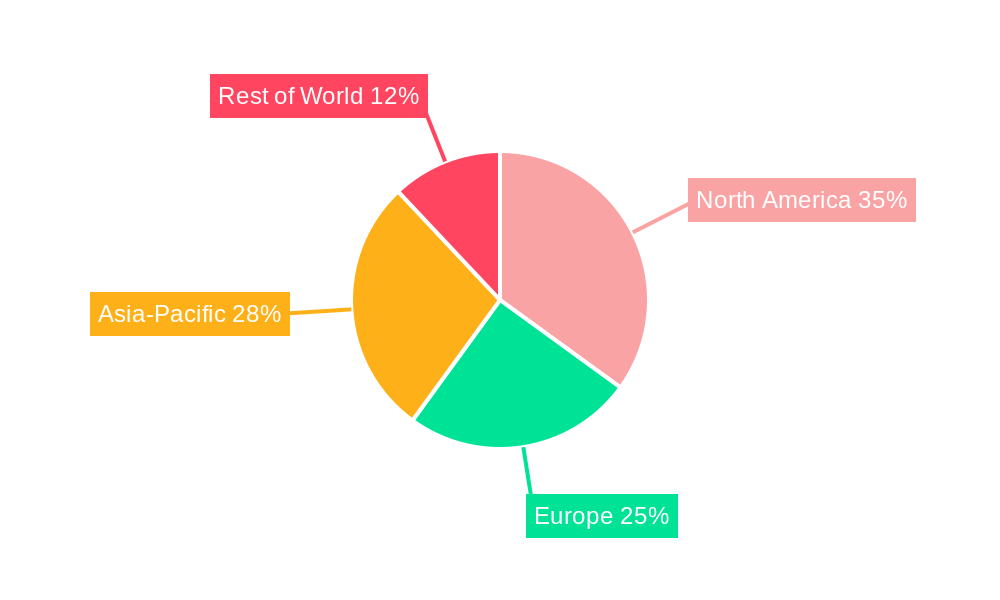
SATCOM Industry Regional Market Share
Geographic Coverage of SATCOM Industry
SATCOM Industry REPORT HIGHLIGHTS
| Aspects | Details |
|---|---|
| Study Period | 2020-2034 |
| Base Year | 2025 |
| Estimated Year | 2026 |
| Forecast Period | 2026-2034 |
| Historical Period | 2020-2025 |
| Growth Rate | CAGR of 11% from 2020-2034 |
| Segmentation |
|
Table of Contents
- 1. Introduction
- 1.1. Research Scope
- 1.2. Market Segmentation
- 1.3. Research Objective
- 1.4. Definitions and Assumptions
- 2. Executive Summary
- 2.1. Market Snapshot
- 3. Market Dynamics
- 3.1. Market Drivers
- 3.2. Market Restrains
- 3.3. Market Trends
- 3.4. Market Opportunities
- 4. Market Factor Analysis
- 4.1. Porters Five Forces
- 4.1.1. Bargaining Power of Suppliers
- 4.1.2. Bargaining Power of Buyers
- 4.1.3. Threat of New Entrants
- 4.1.4. Threat of Substitutes
- 4.1.5. Competitive Rivalry
- 4.2. PESTEL analysis
- 4.3. BCG Analysis
- 4.3.1. Stars (High Growth, High Market Share)
- 4.3.2. Cash Cows (Low Growth, High Market Share)
- 4.3.3. Question Mark (High Growth, Low Market Share)
- 4.3.4. Dogs (Low Growth, Low Market Share)
- 4.4. Ansoff Matrix Analysis
- 4.5. Supply Chain Analysis
- 4.6. Regulatory Landscape
- 4.7. Current Market Potential and Opportunity Assessment (TAM–SAM–SOM Framework)
- 4.8. MSR Analyst Note
- 4.1. Porters Five Forces
- 5. Market Analysis, Insights and Forecast 2021-2033
- 5.1. Market Analysis, Insights and Forecast - by Satellite Mass
- 5.1.1. 10-100kg
- 5.1.2. 100-500kg
- 5.1.3. 500-1000kg
- 5.1.4. Below 10 Kg
- 5.1.5. above 1000kg
- 5.2. Market Analysis, Insights and Forecast - by Orbit Class
- 5.2.1. GEO
- 5.2.2. LEO
- 5.2.3. MEO
- 5.3. Market Analysis, Insights and Forecast - by Communication Type
- 5.3.1. Broadcasting
- 5.3.2. Mobile Communication
- 5.3.3. Satellite Phone
- 5.3.4. Others
- 5.4. Market Analysis, Insights and Forecast - by End User
- 5.4.1. Commercial
- 5.4.2. Military & Government
- 5.4.3. Other
- 5.5. Market Analysis, Insights and Forecast - by Region
- 5.5.1. North America
- 5.5.2. South America
- 5.5.3. Europe
- 5.5.4. Middle East & Africa
- 5.5.5. Asia Pacific
- 5.1. Market Analysis, Insights and Forecast - by Satellite Mass
- 6. Global SATCOM Industry Analysis, Insights and Forecast, 2021-2033
- 6.1. Market Analysis, Insights and Forecast - by Satellite Mass
- 6.1.1. 10-100kg
- 6.1.2. 100-500kg
- 6.1.3. 500-1000kg
- 6.1.4. Below 10 Kg
- 6.1.5. above 1000kg
- 6.2. Market Analysis, Insights and Forecast - by Orbit Class
- 6.2.1. GEO
- 6.2.2. LEO
- 6.2.3. MEO
- 6.3. Market Analysis, Insights and Forecast - by Communication Type
- 6.3.1. Broadcasting
- 6.3.2. Mobile Communication
- 6.3.3. Satellite Phone
- 6.3.4. Others
- 6.4. Market Analysis, Insights and Forecast - by End User
- 6.4.1. Commercial
- 6.4.2. Military & Government
- 6.4.3. Other
- 6.1. Market Analysis, Insights and Forecast - by Satellite Mass
- 7. North America SATCOM Industry Analysis, Insights and Forecast, 2020-2032
- 7.1. Market Analysis, Insights and Forecast - by Satellite Mass
- 7.1.1. 10-100kg
- 7.1.2. 100-500kg
- 7.1.3. 500-1000kg
- 7.1.4. Below 10 Kg
- 7.1.5. above 1000kg
- 7.2. Market Analysis, Insights and Forecast - by Orbit Class
- 7.2.1. GEO
- 7.2.2. LEO
- 7.2.3. MEO
- 7.3. Market Analysis, Insights and Forecast - by Communication Type
- 7.3.1. Broadcasting
- 7.3.2. Mobile Communication
- 7.3.3. Satellite Phone
- 7.3.4. Others
- 7.4. Market Analysis, Insights and Forecast - by End User
- 7.4.1. Commercial
- 7.4.2. Military & Government
- 7.4.3. Other
- 7.1. Market Analysis, Insights and Forecast - by Satellite Mass
- 8. South America SATCOM Industry Analysis, Insights and Forecast, 2020-2032
- 8.1. Market Analysis, Insights and Forecast - by Satellite Mass
- 8.1.1. 10-100kg
- 8.1.2. 100-500kg
- 8.1.3. 500-1000kg
- 8.1.4. Below 10 Kg
- 8.1.5. above 1000kg
- 8.2. Market Analysis, Insights and Forecast - by Orbit Class
- 8.2.1. GEO
- 8.2.2. LEO
- 8.2.3. MEO
- 8.3. Market Analysis, Insights and Forecast - by Communication Type
- 8.3.1. Broadcasting
- 8.3.2. Mobile Communication
- 8.3.3. Satellite Phone
- 8.3.4. Others
- 8.4. Market Analysis, Insights and Forecast - by End User
- 8.4.1. Commercial
- 8.4.2. Military & Government
- 8.4.3. Other
- 8.1. Market Analysis, Insights and Forecast - by Satellite Mass
- 9. Europe SATCOM Industry Analysis, Insights and Forecast, 2020-2032
- 9.1. Market Analysis, Insights and Forecast - by Satellite Mass
- 9.1.1. 10-100kg
- 9.1.2. 100-500kg
- 9.1.3. 500-1000kg
- 9.1.4. Below 10 Kg
- 9.1.5. above 1000kg
- 9.2. Market Analysis, Insights and Forecast - by Orbit Class
- 9.2.1. GEO
- 9.2.2. LEO
- 9.2.3. MEO
- 9.3. Market Analysis, Insights and Forecast - by Communication Type
- 9.3.1. Broadcasting
- 9.3.2. Mobile Communication
- 9.3.3. Satellite Phone
- 9.3.4. Others
- 9.4. Market Analysis, Insights and Forecast - by End User
- 9.4.1. Commercial
- 9.4.2. Military & Government
- 9.4.3. Other
- 9.1. Market Analysis, Insights and Forecast - by Satellite Mass
- 10. Middle East & Africa SATCOM Industry Analysis, Insights and Forecast, 2020-2032
- 10.1. Market Analysis, Insights and Forecast - by Satellite Mass
- 10.1.1. 10-100kg
- 10.1.2. 100-500kg
- 10.1.3. 500-1000kg
- 10.1.4. Below 10 Kg
- 10.1.5. above 1000kg
- 10.2. Market Analysis, Insights and Forecast - by Orbit Class
- 10.2.1. GEO
- 10.2.2. LEO
- 10.2.3. MEO
- 10.3. Market Analysis, Insights and Forecast - by Communication Type
- 10.3.1. Broadcasting
- 10.3.2. Mobile Communication
- 10.3.3. Satellite Phone
- 10.3.4. Others
- 10.4. Market Analysis, Insights and Forecast - by End User
- 10.4.1. Commercial
- 10.4.2. Military & Government
- 10.4.3. Other
- 10.1. Market Analysis, Insights and Forecast - by Satellite Mass
- 11. Asia Pacific SATCOM Industry Analysis, Insights and Forecast, 2020-2032
- 11.1. Market Analysis, Insights and Forecast - by Satellite Mass
- 11.1.1. 10-100kg
- 11.1.2. 100-500kg
- 11.1.3. 500-1000kg
- 11.1.4. Below 10 Kg
- 11.1.5. above 1000kg
- 11.2. Market Analysis, Insights and Forecast - by Orbit Class
- 11.2.1. GEO
- 11.2.2. LEO
- 11.2.3. MEO
- 11.3. Market Analysis, Insights and Forecast - by Communication Type
- 11.3.1. Broadcasting
- 11.3.2. Mobile Communication
- 11.3.3. Satellite Phone
- 11.3.4. Others
- 11.4. Market Analysis, Insights and Forecast - by End User
- 11.4.1. Commercial
- 11.4.2. Military & Government
- 11.4.3. Other
- 11.1. Market Analysis, Insights and Forecast - by Satellite Mass
- 12. Competitive Analysis
- 12.1. Company Profiles
- 12.1.1 Space Exploration Technologies Corp
- 12.1.1.1. Company Overview
- 12.1.1.2. Products
- 12.1.1.3. Company Financials
- 12.1.1.4. SWOT Analysis
- 12.1.2 L3Harris Technologies Inc
- 12.1.2.1. Company Overview
- 12.1.2.2. Products
- 12.1.2.3. Company Financials
- 12.1.2.4. SWOT Analysis
- 12.1.3 Swarm Technologies Inc
- 12.1.3.1. Company Overview
- 12.1.3.2. Products
- 12.1.3.3. Company Financials
- 12.1.3.4. SWOT Analysis
- 12.1.4 Intelsat
- 12.1.4.1. Company Overview
- 12.1.4.2. Products
- 12.1.4.3. Company Financials
- 12.1.4.4. SWOT Analysis
- 12.1.5 Airbus SE
- 12.1.5.1. Company Overview
- 12.1.5.2. Products
- 12.1.5.3. Company Financials
- 12.1.5.4. SWOT Analysis
- 12.1.6 Viasat Inc
- 12.1.6.1. Company Overview
- 12.1.6.2. Products
- 12.1.6.3. Company Financials
- 12.1.6.4. SWOT Analysis
- 12.1.7 Cobham Limited
- 12.1.7.1. Company Overview
- 12.1.7.2. Products
- 12.1.7.3. Company Financials
- 12.1.7.4. SWOT Analysis
- 12.1.8 China Aerospace Science and Technology Corporation (CASC)
- 12.1.8.1. Company Overview
- 12.1.8.2. Products
- 12.1.8.3. Company Financials
- 12.1.8.4. SWOT Analysis
- 12.1.9 Thales
- 12.1.9.1. Company Overview
- 12.1.9.2. Products
- 12.1.9.3. Company Financials
- 12.1.9.4. SWOT Analysis
- 12.1.10 SKY Perfect JSAT Corporation
- 12.1.10.1. Company Overview
- 12.1.10.2. Products
- 12.1.10.3. Company Financials
- 12.1.10.4. SWOT Analysis
- 12.1.11 SES S A
- 12.1.11.1. Company Overview
- 12.1.11.2. Products
- 12.1.11.3. Company Financials
- 12.1.11.4. SWOT Analysis
- 12.1.12 Maxar Technologies Inc
- 12.1.12.1. Company Overview
- 12.1.12.2. Products
- 12.1.12.3. Company Financials
- 12.1.12.4. SWOT Analysis
- 12.1.13 Thuraya Telecommunications Company
- 12.1.13.1. Company Overview
- 12.1.13.2. Products
- 12.1.13.3. Company Financials
- 12.1.13.4. SWOT Analysis
- 12.1.14 EchoStar Corporation
- 12.1.14.1. Company Overview
- 12.1.14.2. Products
- 12.1.14.3. Company Financials
- 12.1.14.4. SWOT Analysis
- 12.1.1 Space Exploration Technologies Corp
- 12.2. Market Entropy
- 12.2.1 Company's Key Areas Served
- 12.2.2 Recent Developments
- 12.3. Company Market Share Analysis 2025
- 12.3.1 Top 5 Companies Market Share Analysis
- 12.3.2 Top 3 Companies Market Share Analysis
- 12.4. List of Potential Customers
- 13. Research Methodology
List of Figures
- Figure 1: Global SATCOM Industry Revenue Breakdown (billion, %) by Region 2025 & 2033
- Figure 2: North America SATCOM Industry Revenue (billion), by Satellite Mass 2025 & 2033
- Figure 3: North America SATCOM Industry Revenue Share (%), by Satellite Mass 2025 & 2033
- Figure 4: North America SATCOM Industry Revenue (billion), by Orbit Class 2025 & 2033
- Figure 5: North America SATCOM Industry Revenue Share (%), by Orbit Class 2025 & 2033
- Figure 6: North America SATCOM Industry Revenue (billion), by Communication Type 2025 & 2033
- Figure 7: North America SATCOM Industry Revenue Share (%), by Communication Type 2025 & 2033
- Figure 8: North America SATCOM Industry Revenue (billion), by End User 2025 & 2033
- Figure 9: North America SATCOM Industry Revenue Share (%), by End User 2025 & 2033
- Figure 10: North America SATCOM Industry Revenue (billion), by Country 2025 & 2033
- Figure 11: North America SATCOM Industry Revenue Share (%), by Country 2025 & 2033
- Figure 12: South America SATCOM Industry Revenue (billion), by Satellite Mass 2025 & 2033
- Figure 13: South America SATCOM Industry Revenue Share (%), by Satellite Mass 2025 & 2033
- Figure 14: South America SATCOM Industry Revenue (billion), by Orbit Class 2025 & 2033
- Figure 15: South America SATCOM Industry Revenue Share (%), by Orbit Class 2025 & 2033
- Figure 16: South America SATCOM Industry Revenue (billion), by Communication Type 2025 & 2033
- Figure 17: South America SATCOM Industry Revenue Share (%), by Communication Type 2025 & 2033
- Figure 18: South America SATCOM Industry Revenue (billion), by End User 2025 & 2033
- Figure 19: South America SATCOM Industry Revenue Share (%), by End User 2025 & 2033
- Figure 20: South America SATCOM Industry Revenue (billion), by Country 2025 & 2033
- Figure 21: South America SATCOM Industry Revenue Share (%), by Country 2025 & 2033
- Figure 22: Europe SATCOM Industry Revenue (billion), by Satellite Mass 2025 & 2033
- Figure 23: Europe SATCOM Industry Revenue Share (%), by Satellite Mass 2025 & 2033
- Figure 24: Europe SATCOM Industry Revenue (billion), by Orbit Class 2025 & 2033
- Figure 25: Europe SATCOM Industry Revenue Share (%), by Orbit Class 2025 & 2033
- Figure 26: Europe SATCOM Industry Revenue (billion), by Communication Type 2025 & 2033
- Figure 27: Europe SATCOM Industry Revenue Share (%), by Communication Type 2025 & 2033
- Figure 28: Europe SATCOM Industry Revenue (billion), by End User 2025 & 2033
- Figure 29: Europe SATCOM Industry Revenue Share (%), by End User 2025 & 2033
- Figure 30: Europe SATCOM Industry Revenue (billion), by Country 2025 & 2033
- Figure 31: Europe SATCOM Industry Revenue Share (%), by Country 2025 & 2033
- Figure 32: Middle East & Africa SATCOM Industry Revenue (billion), by Satellite Mass 2025 & 2033
- Figure 33: Middle East & Africa SATCOM Industry Revenue Share (%), by Satellite Mass 2025 & 2033
- Figure 34: Middle East & Africa SATCOM Industry Revenue (billion), by Orbit Class 2025 & 2033
- Figure 35: Middle East & Africa SATCOM Industry Revenue Share (%), by Orbit Class 2025 & 2033
- Figure 36: Middle East & Africa SATCOM Industry Revenue (billion), by Communication Type 2025 & 2033
- Figure 37: Middle East & Africa SATCOM Industry Revenue Share (%), by Communication Type 2025 & 2033
- Figure 38: Middle East & Africa SATCOM Industry Revenue (billion), by End User 2025 & 2033
- Figure 39: Middle East & Africa SATCOM Industry Revenue Share (%), by End User 2025 & 2033
- Figure 40: Middle East & Africa SATCOM Industry Revenue (billion), by Country 2025 & 2033
- Figure 41: Middle East & Africa SATCOM Industry Revenue Share (%), by Country 2025 & 2033
- Figure 42: Asia Pacific SATCOM Industry Revenue (billion), by Satellite Mass 2025 & 2033
- Figure 43: Asia Pacific SATCOM Industry Revenue Share (%), by Satellite Mass 2025 & 2033
- Figure 44: Asia Pacific SATCOM Industry Revenue (billion), by Orbit Class 2025 & 2033
- Figure 45: Asia Pacific SATCOM Industry Revenue Share (%), by Orbit Class 2025 & 2033
- Figure 46: Asia Pacific SATCOM Industry Revenue (billion), by Communication Type 2025 & 2033
- Figure 47: Asia Pacific SATCOM Industry Revenue Share (%), by Communication Type 2025 & 2033
- Figure 48: Asia Pacific SATCOM Industry Revenue (billion), by End User 2025 & 2033
- Figure 49: Asia Pacific SATCOM Industry Revenue Share (%), by End User 2025 & 2033
- Figure 50: Asia Pacific SATCOM Industry Revenue (billion), by Country 2025 & 2033
- Figure 51: Asia Pacific SATCOM Industry Revenue Share (%), by Country 2025 & 2033
List of Tables
- Table 1: Global SATCOM Industry Revenue billion Forecast, by Satellite Mass 2020 & 2033
- Table 2: Global SATCOM Industry Revenue billion Forecast, by Orbit Class 2020 & 2033
- Table 3: Global SATCOM Industry Revenue billion Forecast, by Communication Type 2020 & 2033
- Table 4: Global SATCOM Industry Revenue billion Forecast, by End User 2020 & 2033
- Table 5: Global SATCOM Industry Revenue billion Forecast, by Region 2020 & 2033
- Table 6: Global SATCOM Industry Revenue billion Forecast, by Satellite Mass 2020 & 2033
- Table 7: Global SATCOM Industry Revenue billion Forecast, by Orbit Class 2020 & 2033
- Table 8: Global SATCOM Industry Revenue billion Forecast, by Communication Type 2020 & 2033
- Table 9: Global SATCOM Industry Revenue billion Forecast, by End User 2020 & 2033
- Table 10: Global SATCOM Industry Revenue billion Forecast, by Country 2020 & 2033
- Table 11: United States SATCOM Industry Revenue (billion) Forecast, by Application 2020 & 2033
- Table 12: Canada SATCOM Industry Revenue (billion) Forecast, by Application 2020 & 2033
- Table 13: Mexico SATCOM Industry Revenue (billion) Forecast, by Application 2020 & 2033
- Table 14: Global SATCOM Industry Revenue billion Forecast, by Satellite Mass 2020 & 2033
- Table 15: Global SATCOM Industry Revenue billion Forecast, by Orbit Class 2020 & 2033
- Table 16: Global SATCOM Industry Revenue billion Forecast, by Communication Type 2020 & 2033
- Table 17: Global SATCOM Industry Revenue billion Forecast, by End User 2020 & 2033
- Table 18: Global SATCOM Industry Revenue billion Forecast, by Country 2020 & 2033
- Table 19: Brazil SATCOM Industry Revenue (billion) Forecast, by Application 2020 & 2033
- Table 20: Argentina SATCOM Industry Revenue (billion) Forecast, by Application 2020 & 2033
- Table 21: Rest of South America SATCOM Industry Revenue (billion) Forecast, by Application 2020 & 2033
- Table 22: Global SATCOM Industry Revenue billion Forecast, by Satellite Mass 2020 & 2033
- Table 23: Global SATCOM Industry Revenue billion Forecast, by Orbit Class 2020 & 2033
- Table 24: Global SATCOM Industry Revenue billion Forecast, by Communication Type 2020 & 2033
- Table 25: Global SATCOM Industry Revenue billion Forecast, by End User 2020 & 2033
- Table 26: Global SATCOM Industry Revenue billion Forecast, by Country 2020 & 2033
- Table 27: United Kingdom SATCOM Industry Revenue (billion) Forecast, by Application 2020 & 2033
- Table 28: Germany SATCOM Industry Revenue (billion) Forecast, by Application 2020 & 2033
- Table 29: France SATCOM Industry Revenue (billion) Forecast, by Application 2020 & 2033
- Table 30: Italy SATCOM Industry Revenue (billion) Forecast, by Application 2020 & 2033
- Table 31: Spain SATCOM Industry Revenue (billion) Forecast, by Application 2020 & 2033
- Table 32: Russia SATCOM Industry Revenue (billion) Forecast, by Application 2020 & 2033
- Table 33: Benelux SATCOM Industry Revenue (billion) Forecast, by Application 2020 & 2033
- Table 34: Nordics SATCOM Industry Revenue (billion) Forecast, by Application 2020 & 2033
- Table 35: Rest of Europe SATCOM Industry Revenue (billion) Forecast, by Application 2020 & 2033
- Table 36: Global SATCOM Industry Revenue billion Forecast, by Satellite Mass 2020 & 2033
- Table 37: Global SATCOM Industry Revenue billion Forecast, by Orbit Class 2020 & 2033
- Table 38: Global SATCOM Industry Revenue billion Forecast, by Communication Type 2020 & 2033
- Table 39: Global SATCOM Industry Revenue billion Forecast, by End User 2020 & 2033
- Table 40: Global SATCOM Industry Revenue billion Forecast, by Country 2020 & 2033
- Table 41: Turkey SATCOM Industry Revenue (billion) Forecast, by Application 2020 & 2033
- Table 42: Israel SATCOM Industry Revenue (billion) Forecast, by Application 2020 & 2033
- Table 43: GCC SATCOM Industry Revenue (billion) Forecast, by Application 2020 & 2033
- Table 44: North Africa SATCOM Industry Revenue (billion) Forecast, by Application 2020 & 2033
- Table 45: South Africa SATCOM Industry Revenue (billion) Forecast, by Application 2020 & 2033
- Table 46: Rest of Middle East & Africa SATCOM Industry Revenue (billion) Forecast, by Application 2020 & 2033
- Table 47: Global SATCOM Industry Revenue billion Forecast, by Satellite Mass 2020 & 2033
- Table 48: Global SATCOM Industry Revenue billion Forecast, by Orbit Class 2020 & 2033
- Table 49: Global SATCOM Industry Revenue billion Forecast, by Communication Type 2020 & 2033
- Table 50: Global SATCOM Industry Revenue billion Forecast, by End User 2020 & 2033
- Table 51: Global SATCOM Industry Revenue billion Forecast, by Country 2020 & 2033
- Table 52: China SATCOM Industry Revenue (billion) Forecast, by Application 2020 & 2033
- Table 53: India SATCOM Industry Revenue (billion) Forecast, by Application 2020 & 2033
- Table 54: Japan SATCOM Industry Revenue (billion) Forecast, by Application 2020 & 2033
- Table 55: South Korea SATCOM Industry Revenue (billion) Forecast, by Application 2020 & 2033
- Table 56: ASEAN SATCOM Industry Revenue (billion) Forecast, by Application 2020 & 2033
- Table 57: Oceania SATCOM Industry Revenue (billion) Forecast, by Application 2020 & 2033
- Table 58: Rest of Asia Pacific SATCOM Industry Revenue (billion) Forecast, by Application 2020 & 2033
Frequently Asked Questions
1. What is the projected Compound Annual Growth Rate (CAGR) of the SATCOM Industry?
The projected CAGR is approximately 11%.
2. Which companies are prominent players in the SATCOM Industry?
Key companies in the market include Space Exploration Technologies Corp, L3Harris Technologies Inc, Swarm Technologies Inc, Intelsat, Airbus SE, Viasat Inc, Cobham Limited, China Aerospace Science and Technology Corporation (CASC), Thales, SKY Perfect JSAT Corporation, SES S A, Maxar Technologies Inc, Thuraya Telecommunications Company, EchoStar Corporation.
3. What are the main segments of the SATCOM Industry?
The market segments include Satellite Mass, Orbit Class, Communication Type, End User.
4. Can you provide details about the market size?
The market size is estimated to be USD 98.28 billion as of 2022.
5. What are some drivers contributing to market growth?
N/A
6. What are the notable trends driving market growth?
OTHER KEY INDUSTRY TRENDS COVERED IN THE REPORT.
7. Are there any restraints impacting market growth?
N/A
8. Can you provide examples of recent developments in the market?
February 2023: Anuvu, a provider of high-speed connectivity solutions has signed an agreement with Telesat for new antennas and ground-station infrastructure to support the development of the Anuvu Constellation.February 2023: SES, in partnership with ThinKom and Hughes, has introduced a revolutionary high-performance multi-orbit service capable of supporting multiple solutions for government aerial missions. Open Architecture ThinKom ThinAir Ka2517 aerial satcom terminal has been successfully demonstrated on SES's Medium Earth Orbit (MEO) and Geostationary (GEO) satellite networksJanuary 2023: Satellite communications provider Viasat has been awarded a contract by the United States Marine Corps to provide end-to-end satellite communications support, extending the agreement under which it provides satellite communications solutions under managed services.
9. What pricing options are available for accessing the report?
Pricing options include single-user, multi-user, and enterprise licenses priced at USD 3800, USD 4500, and USD 5800 respectively.
10. Is the market size provided in terms of value or volume?
The market size is provided in terms of value, measured in billion.
11. Are there any specific market keywords associated with the report?
Yes, the market keyword associated with the report is "SATCOM Industry," which aids in identifying and referencing the specific market segment covered.
12. How do I determine which pricing option suits my needs best?
The pricing options vary based on user requirements and access needs. Individual users may opt for single-user licenses, while businesses requiring broader access may choose multi-user or enterprise licenses for cost-effective access to the report.
13. Are there any additional resources or data provided in the SATCOM Industry report?
While the report offers comprehensive insights, it's advisable to review the specific contents or supplementary materials provided to ascertain if additional resources or data are available.
14. How can I stay updated on further developments or reports in the SATCOM Industry?
To stay informed about further developments, trends, and reports in the SATCOM Industry, consider subscribing to industry newsletters, following relevant companies and organizations, or regularly checking reputable industry news sources and publications.
Methodology
Step 1 - Identification of Relevant Samples Size from Population Database


Step 2 - Approaches for Defining Global Market Size (Value, Volume* & Price*)

Note*: In applicable scenarios
Step 3 - Data Sources
Primary Research
- Web Analytics
- Survey Reports
- Research Institute
- Latest Research Reports
- Opinion Leaders
Secondary Research
- Annual Reports
- White Paper
- Latest Press Release
- Industry Association
- Paid Database
- Investor Presentations

Step 4 - Data Triangulation
Involves using different sources of information in order to increase the validity of a study
These sources are likely to be stakeholders in a program - participants, other researchers, program staff, other community members, and so on.
Then we put all data in single framework & apply various statistical tools to find out the dynamic on the market.
During the analysis stage, feedback from the stakeholder groups would be compared to determine areas of agreement as well as areas of divergence