

Key Insights
The Satellite Parts and Components market is projected for significant expansion, driven by escalating demand for satellite-based services across telecommunications, navigation, earth observation, and defense. With a projected Compound Annual Growth Rate (CAGR) of 7%, the market is anticipated to reach $25 billion by 2025. Key growth catalysts include the proliferation of small satellites, advancements in miniaturized high-performance electronics, and the embrace of NewSpace initiatives. Emerging trends such as the integration of Artificial Intelligence (AI) and Machine Learning (ML) in satellite operations, alongside the development of sustainable and cost-effective satellite technologies, further propel market growth. Despite potential restraints like stringent regulatory compliance and high initial investment costs, the long-term outlook remains robust, underscored by advancements in space exploration and the increasing reliance on satellite data. Market segmentation by payload, antenna, and structure reveals a diverse landscape with anticipated growth across all segments due to technological innovation and specialized component demand. Leading players, including BAE Systems, Lockheed Martin, Boeing, and Thales, are actively shaping this market through innovation and strategic alliances. Key regional markets include North America, Europe, and Asia-Pacific.
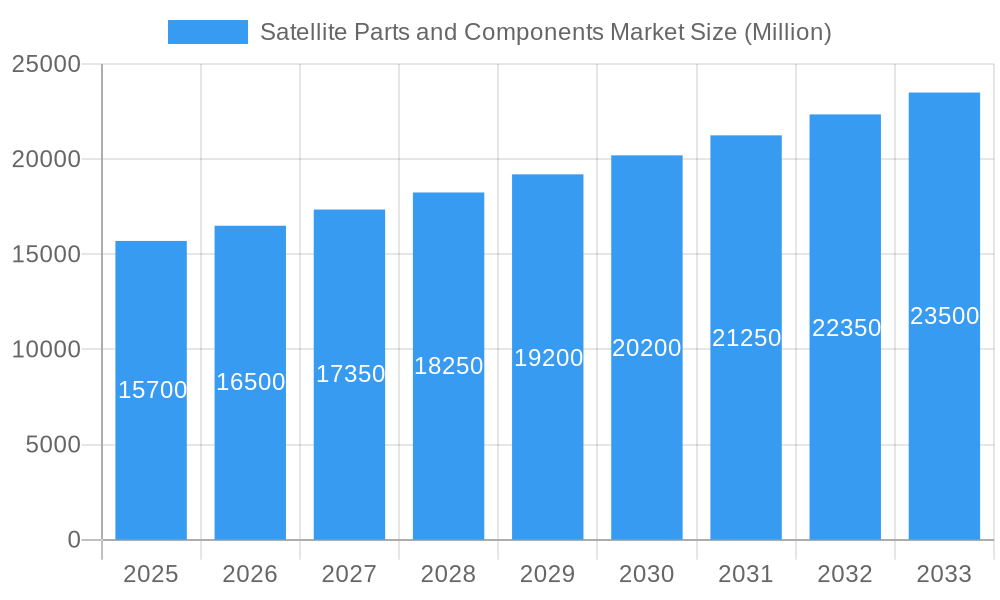
Satellite Parts and Components Market Market Size (In Billion)
The market size in 2025 is estimated at $25 billion, establishing a strong baseline for future projections and investment assessment. Continued expansion of the space economy and technological advancements within the satellite sector indicate sustained market growth throughout the forecast period (2025-2033). The competitive environment is dynamic, with established aerospace and defense companies and emerging space technology firms vying for market share through innovation and strategic acquisitions.
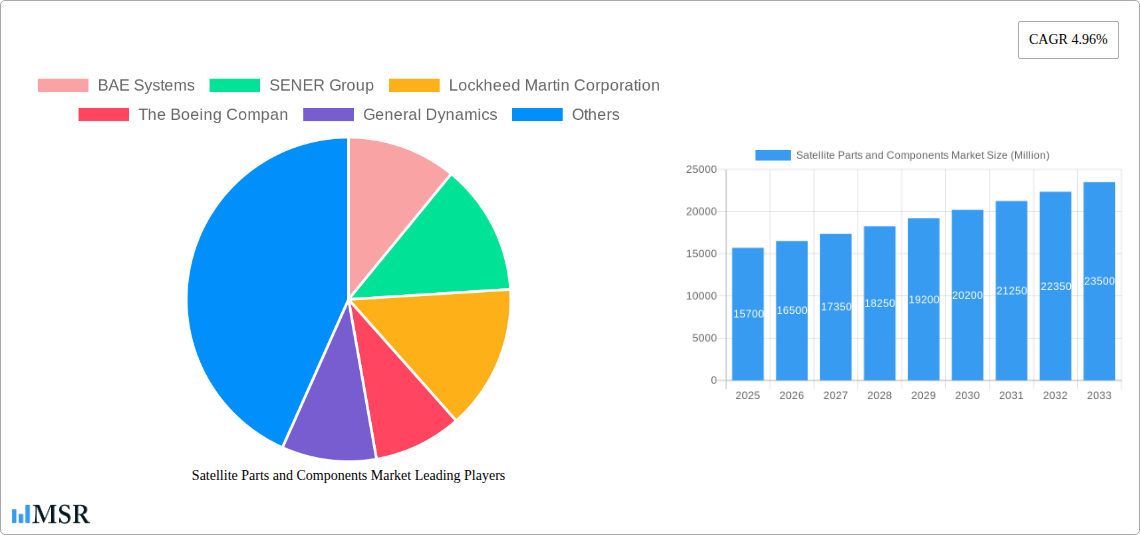
Satellite Parts and Components Market Company Market Share
Satellite Parts and Components Market: A Comprehensive Market Report (2019-2033)
This in-depth report provides a comprehensive analysis of the Satellite Parts and Components Market, offering invaluable insights for industry stakeholders, investors, and strategic decision-makers. With a study period spanning 2019-2033, a base year of 2025, and a forecast period of 2025-2033, this report leverages historical data (2019-2024) to project future market trends and growth opportunities within the satellite industry. The report is meticulously structured to provide actionable intelligence, encompassing market dynamics, leading segments, technological advancements, key players, and emerging opportunities. Expect detailed analysis and forecasts for a market estimated to be worth xx Million in 2025 and projected to reach xx Million by 2033.
Satellite Parts and Components Market Concentration & Dynamics
The Satellite Parts and Components Market exhibits a moderately concentrated landscape, dominated by major players like BAE Systems, Lockheed Martin Corporation, The Boeing Company, and Thales. These companies hold significant market share, benefiting from established reputations, extensive R&D capabilities, and diverse product portfolios encompassing payloads, antennas, and satellite structures. However, a growing number of innovative SMEs (Small and Medium Enterprises) are entering the market, particularly in specialized niches like nanosatellite components. This increased competition is driving innovation and fostering a dynamic ecosystem.
- Market Share: Top 5 players hold approximately xx% of the global market share in 2025.
- M&A Activity: The historical period (2019-2024) witnessed xx M&A deals, primarily focused on consolidating technology and expanding market reach. This activity is projected to continue at a pace of xx deals annually during the forecast period.
- Regulatory Landscape: Stringent regulatory frameworks governing space launches and satellite operations present both challenges and opportunities. Compliance requirements drive demand for high-quality, certified components while also potentially creating barriers to entry for smaller players.
- Substitute Products: The emergence of alternative technologies, such as Software Defined Radios (SDRs) is starting to affect some market segments, driving innovation and forcing adaptation among established players.
- End-User Trends: The increasing demand for high-resolution imagery, advanced communication capabilities, and earth observation data drives the need for sophisticated satellite components and systems across both government and commercial applications.
Satellite Parts and Components Market Industry Insights & Trends
The Satellite Parts and Components Market is experiencing robust growth, driven by factors such as increasing demand for satellite-based services, technological advancements in miniaturization and efficiency, and government investments in space exploration and defense. The market size is estimated at xx Million in 2025, with a projected Compound Annual Growth Rate (CAGR) of xx% from 2025 to 2033. Key growth drivers include the burgeoning space tourism industry, growing adoption of IoT, and the proliferation of constellations of small satellites for Earth observation and communication. Technological disruptions, such as the development of advanced materials and improved manufacturing processes, are further enhancing market dynamics. Consumer behavior trends show a preference for smaller, more efficient, and cost-effective satellite components.
Key Markets & Segments Leading Satellite Parts and Components Market
The North American region currently holds the leading position in the global Satellite Parts and Components Market, driven by strong government support for space exploration initiatives, a large established aerospace industry, and substantial investments from private companies. Within the segments, the Payload segment (Cameras, sensors, transponders, and mission computers) holds the largest market share, reflecting the growing demand for advanced data acquisition and processing capabilities.
Key Drivers by Segment:
- Payload: Demand for higher-resolution imaging, advanced sensing technology, and increased data throughput in applications like Earth observation, defense, and telecommunications.
- Antenna: Increasing demand for high-bandwidth communication, particularly for broadband services and satellite internet. Advancement in phased array antenna technology is driving this segment's growth.
- Structure: Need for lightweight and robust satellite bus designs to accommodate miniaturization trends and cost-efficient launch capabilities. Innovations in solar panel technology and propulsion systems drive efficiency and mission longevity.
Dominance Analysis: The North American market’s dominance stems from robust government funding, a large established aerospace industry, and a strong private sector focus on space-related technology development. Europe and Asia-Pacific regions are also showing significant growth, driven by governmental and private investment in space programs.
Satellite Parts and Components Market Product Developments
Recent years have witnessed significant advancements in satellite components, focusing on miniaturization, increased efficiency, and improved reliability. These innovations encompass the use of advanced materials, such as carbon fiber composites for lighter satellite structures, and the development of more powerful and energy-efficient processors for mission computers. The market is also seeing the integration of AI and machine learning capabilities into satellite components, leading to increased autonomy and improved data analysis. These developments provide significant competitive advantages, enabling manufacturers to offer lighter, more cost-effective, and higher-performing products.
Challenges in the Satellite Parts and Components Market
The Satellite Parts and Components Market faces challenges such as stringent regulatory compliance, supply chain disruptions (especially regarding specific rare earth elements), and intense competition from both established players and new entrants. These factors can impact production timelines, increase costs, and limit market access for some businesses. The ongoing geopolitical instability further affects the stability of supply chains and investment confidence. The cumulative effect of these factors is a reduction of profit margins for many businesses.
Forces Driving Satellite Parts and Components Market Growth
Several factors are driving market growth, including:
- Technological advancements: Miniaturization, increased processing power, and improved sensor capabilities are creating more efficient and versatile satellite components.
- Increased demand for satellite-based services: Growth in broadband access, earth observation, and navigation applications fuels the need for more satellites and sophisticated components.
- Government investment in space exploration: Significant funding directed towards space exploration and defense initiatives supports the growth of the satellite industry.
Long-Term Growth Catalysts in the Satellite Parts and Components Market
Long-term growth will be fueled by continued technological innovation, strategic partnerships between established and emerging players, and expansion into new markets. The development of reusable launch vehicles and the potential for space-based solar power are additional long-term catalysts, enhancing the affordability and sustainability of space missions.
Emerging Opportunities in Satellite Parts and Components Market
Emerging opportunities lie in the increasing adoption of nanosatellites, the development of in-space manufacturing capabilities, and the growing demand for advanced data analytics solutions in the space domain. New materials and manufacturing processes will create both opportunities and challenges for businesses.
Leading Players in the Satellite Parts and Components Market Sector
- BAE Systems
- SENER Group
- Lockheed Martin Corporation
- The Boeing Company
- General Dynamics
- Thales
- OHB SE
- Innovative Solutions in Space BV
- Sitael S p A
- Northrop Grumman Corporation
- Jena-Optronik
- AAC Clyde Space
Key Milestones in Satellite Parts and Components Market Industry
- November 2022: Two star trackers from Jena-Optronik GmbH guided the Orion spacecraft on NASA's Artemis I mission to lunar orbit. This highlighted the reliability and precision of Jena-Optronik's technology.
- December 2022: Jena-Optronik's ASTRO CL star sensor was selected for Maxar's new LEO platform, showcasing the company's miniaturization capabilities in attitude control systems.
- January 2023: ISISPACE's ISILAUNCH38 mission launched 47 payloads from 8 countries, demonstrating the increasing demand for small satellite launch services and highlighting the role of partnerships in facilitating access to space.
Strategic Outlook for Satellite Parts and Components Market
The Satellite Parts and Components Market is poised for continued growth, driven by technological advancements, increasing demand for satellite-based services, and supportive government policies. Strategic opportunities exist for companies that can develop innovative, cost-effective, and reliable satellite components, focusing on miniaturization, improved efficiency, and enhanced performance. Partnerships and collaborations will play a crucial role in capitalizing on the vast potential of this dynamic and expanding market.
Satellite Parts and Components Market Segmentation
- 1. Production Analysis
- 2. Consumption Analysis
- 3. Import Market Analysis (Value & Volume)
- 4. Export Market Analysis (Value & Volume)
- 5. Price Trend Analysis
Satellite Parts and Components Market Segmentation By Geography
-
1. North America
- 1.1. United States
- 1.2. Canada
- 1.3. Mexico
-
2. South America
- 2.1. Brazil
- 2.2. Argentina
- 2.3. Rest of South America
-
3. Europe
- 3.1. United Kingdom
- 3.2. Germany
- 3.3. France
- 3.4. Italy
- 3.5. Spain
- 3.6. Russia
- 3.7. Benelux
- 3.8. Nordics
- 3.9. Rest of Europe
-
4. Middle East & Africa
- 4.1. Turkey
- 4.2. Israel
- 4.3. GCC
- 4.4. North Africa
- 4.5. South Africa
- 4.6. Rest of Middle East & Africa
-
5. Asia Pacific
- 5.1. China
- 5.2. India
- 5.3. Japan
- 5.4. South Korea
- 5.5. ASEAN
- 5.6. Oceania
- 5.7. Rest of Asia Pacific

Satellite Parts and Components Market Regional Market Share
Geographic Coverage of Satellite Parts and Components Market
Satellite Parts and Components Market REPORT HIGHLIGHTS
| Aspects | Details |
|---|---|
| Study Period | 2020-2034 |
| Base Year | 2025 |
| Estimated Year | 2026 |
| Forecast Period | 2026-2034 |
| Historical Period | 2020-2025 |
| Growth Rate | CAGR of 7% from 2020-2034 |
| Segmentation |
|
Table of Contents
- 1. Introduction
- 1.1. Research Scope
- 1.2. Market Segmentation
- 1.3. Research Objective
- 1.4. Definitions and Assumptions
- 2. Executive Summary
- 2.1. Market Snapshot
- 3. Market Dynamics
- 3.1. Market Drivers
- 3.2. Market Restrains
- 3.3. Market Trends
- 3.4. Market Opportunities
- 4. Market Factor Analysis
- 4.1. Porters Five Forces
- 4.1.1. Bargaining Power of Suppliers
- 4.1.2. Bargaining Power of Buyers
- 4.1.3. Threat of New Entrants
- 4.1.4. Threat of Substitutes
- 4.1.5. Competitive Rivalry
- 4.2. PESTEL analysis
- 4.3. BCG Analysis
- 4.3.1. Stars (High Growth, High Market Share)
- 4.3.2. Cash Cows (Low Growth, High Market Share)
- 4.3.3. Question Mark (High Growth, Low Market Share)
- 4.3.4. Dogs (Low Growth, Low Market Share)
- 4.4. Ansoff Matrix Analysis
- 4.5. Supply Chain Analysis
- 4.6. Regulatory Landscape
- 4.7. Current Market Potential and Opportunity Assessment (TAM–SAM–SOM Framework)
- 4.8. MSR Analyst Note
- 4.1. Porters Five Forces
- 5. Market Analysis, Insights and Forecast 2021-2033
- 5.1. Market Analysis, Insights and Forecast - by Production Analysis
- 5.2. Market Analysis, Insights and Forecast - by Consumption Analysis
- 5.3. Market Analysis, Insights and Forecast - by Import Market Analysis (Value & Volume)
- 5.4. Market Analysis, Insights and Forecast - by Export Market Analysis (Value & Volume)
- 5.5. Market Analysis, Insights and Forecast - by Price Trend Analysis
- 5.6. Market Analysis, Insights and Forecast - by Region
- 5.6.1. North America
- 5.6.2. South America
- 5.6.3. Europe
- 5.6.4. Middle East & Africa
- 5.6.5. Asia Pacific
- 6. Global Satellite Parts and Components Market Analysis, Insights and Forecast, 2021-2033
- 6.1. Market Analysis, Insights and Forecast - by Production Analysis
- 6.2. Market Analysis, Insights and Forecast - by Consumption Analysis
- 6.3. Market Analysis, Insights and Forecast - by Import Market Analysis (Value & Volume)
- 6.4. Market Analysis, Insights and Forecast - by Export Market Analysis (Value & Volume)
- 6.5. Market Analysis, Insights and Forecast - by Price Trend Analysis
- 7. North America Satellite Parts and Components Market Analysis, Insights and Forecast, 2020-2032
- 7.1. Market Analysis, Insights and Forecast - by Production Analysis
- 7.2. Market Analysis, Insights and Forecast - by Consumption Analysis
- 7.3. Market Analysis, Insights and Forecast - by Import Market Analysis (Value & Volume)
- 7.4. Market Analysis, Insights and Forecast - by Export Market Analysis (Value & Volume)
- 7.5. Market Analysis, Insights and Forecast - by Price Trend Analysis
- 8. South America Satellite Parts and Components Market Analysis, Insights and Forecast, 2020-2032
- 8.1. Market Analysis, Insights and Forecast - by Production Analysis
- 8.2. Market Analysis, Insights and Forecast - by Consumption Analysis
- 8.3. Market Analysis, Insights and Forecast - by Import Market Analysis (Value & Volume)
- 8.4. Market Analysis, Insights and Forecast - by Export Market Analysis (Value & Volume)
- 8.5. Market Analysis, Insights and Forecast - by Price Trend Analysis
- 9. Europe Satellite Parts and Components Market Analysis, Insights and Forecast, 2020-2032
- 9.1. Market Analysis, Insights and Forecast - by Production Analysis
- 9.2. Market Analysis, Insights and Forecast - by Consumption Analysis
- 9.3. Market Analysis, Insights and Forecast - by Import Market Analysis (Value & Volume)
- 9.4. Market Analysis, Insights and Forecast - by Export Market Analysis (Value & Volume)
- 9.5. Market Analysis, Insights and Forecast - by Price Trend Analysis
- 10. Middle East & Africa Satellite Parts and Components Market Analysis, Insights and Forecast, 2020-2032
- 10.1. Market Analysis, Insights and Forecast - by Production Analysis
- 10.2. Market Analysis, Insights and Forecast - by Consumption Analysis
- 10.3. Market Analysis, Insights and Forecast - by Import Market Analysis (Value & Volume)
- 10.4. Market Analysis, Insights and Forecast - by Export Market Analysis (Value & Volume)
- 10.5. Market Analysis, Insights and Forecast - by Price Trend Analysis
- 11. Asia Pacific Satellite Parts and Components Market Analysis, Insights and Forecast, 2020-2032
- 11.1. Market Analysis, Insights and Forecast - by Production Analysis
- 11.2. Market Analysis, Insights and Forecast - by Consumption Analysis
- 11.3. Market Analysis, Insights and Forecast - by Import Market Analysis (Value & Volume)
- 11.4. Market Analysis, Insights and Forecast - by Export Market Analysis (Value & Volume)
- 11.5. Market Analysis, Insights and Forecast - by Price Trend Analysis
- 12. Competitive Analysis
- 12.1. Company Profiles
- 12.1.1 BAE Systems
- 12.1.1.1. Company Overview
- 12.1.1.2. Products
- 12.1.1.3. Company Financials
- 12.1.1.4. SWOT Analysis
- 12.1.2 SENER Group
- 12.1.2.1. Company Overview
- 12.1.2.2. Products
- 12.1.2.3. Company Financials
- 12.1.2.4. SWOT Analysis
- 12.1.3 Lockheed Martin Corporation
- 12.1.3.1. Company Overview
- 12.1.3.2. Products
- 12.1.3.3. Company Financials
- 12.1.3.4. SWOT Analysis
- 12.1.4 The Boeing Compan
- 12.1.4.1. Company Overview
- 12.1.4.2. Products
- 12.1.4.3. Company Financials
- 12.1.4.4. SWOT Analysis
- 12.1.5 General Dynamics
- 12.1.5.1. Company Overview
- 12.1.5.2. Products
- 12.1.5.3. Company Financials
- 12.1.5.4. SWOT Analysis
- 12.1.6 Thales
- 12.1.6.1. Company Overview
- 12.1.6.2. Products
- 12.1.6.3. Company Financials
- 12.1.6.4. SWOT Analysis
- 12.1.7 OHB SE
- 12.1.7.1. Company Overview
- 12.1.7.2. Products
- 12.1.7.3. Company Financials
- 12.1.7.4. SWOT Analysis
- 12.1.8 Innovative Solutions in Space BV
- 12.1.8.1. Company Overview
- 12.1.8.2. Products
- 12.1.8.3. Company Financials
- 12.1.8.4. SWOT Analysis
- 12.1.9 Sitael S p A
- 12.1.9.1. Company Overview
- 12.1.9.2. Products
- 12.1.9.3. Company Financials
- 12.1.9.4. SWOT Analysis
- 12.1.10 Northrop Grumman Corporation
- 12.1.10.1. Company Overview
- 12.1.10.2. Products
- 12.1.10.3. Company Financials
- 12.1.10.4. SWOT Analysis
- 12.1.11 Jena-Optronik
- 12.1.11.1. Company Overview
- 12.1.11.2. Products
- 12.1.11.3. Company Financials
- 12.1.11.4. SWOT Analysis
- 12.1.12 AAC Clyde Space
- 12.1.12.1. Company Overview
- 12.1.12.2. Products
- 12.1.12.3. Company Financials
- 12.1.12.4. SWOT Analysis
- 12.1.1 BAE Systems
- 12.2. Market Entropy
- 12.2.1 Company's Key Areas Served
- 12.2.2 Recent Developments
- 12.3. Company Market Share Analysis 2025
- 12.3.1 Top 5 Companies Market Share Analysis
- 12.3.2 Top 3 Companies Market Share Analysis
- 12.4. List of Potential Customers
- 13. Research Methodology
List of Figures
- Figure 1: Global Satellite Parts and Components Market Revenue Breakdown (billion, %) by Region 2025 & 2033
- Figure 2: North America Satellite Parts and Components Market Revenue (billion), by Production Analysis 2025 & 2033
- Figure 3: North America Satellite Parts and Components Market Revenue Share (%), by Production Analysis 2025 & 2033
- Figure 4: North America Satellite Parts and Components Market Revenue (billion), by Consumption Analysis 2025 & 2033
- Figure 5: North America Satellite Parts and Components Market Revenue Share (%), by Consumption Analysis 2025 & 2033
- Figure 6: North America Satellite Parts and Components Market Revenue (billion), by Import Market Analysis (Value & Volume) 2025 & 2033
- Figure 7: North America Satellite Parts and Components Market Revenue Share (%), by Import Market Analysis (Value & Volume) 2025 & 2033
- Figure 8: North America Satellite Parts and Components Market Revenue (billion), by Export Market Analysis (Value & Volume) 2025 & 2033
- Figure 9: North America Satellite Parts and Components Market Revenue Share (%), by Export Market Analysis (Value & Volume) 2025 & 2033
- Figure 10: North America Satellite Parts and Components Market Revenue (billion), by Price Trend Analysis 2025 & 2033
- Figure 11: North America Satellite Parts and Components Market Revenue Share (%), by Price Trend Analysis 2025 & 2033
- Figure 12: North America Satellite Parts and Components Market Revenue (billion), by Country 2025 & 2033
- Figure 13: North America Satellite Parts and Components Market Revenue Share (%), by Country 2025 & 2033
- Figure 14: South America Satellite Parts and Components Market Revenue (billion), by Production Analysis 2025 & 2033
- Figure 15: South America Satellite Parts and Components Market Revenue Share (%), by Production Analysis 2025 & 2033
- Figure 16: South America Satellite Parts and Components Market Revenue (billion), by Consumption Analysis 2025 & 2033
- Figure 17: South America Satellite Parts and Components Market Revenue Share (%), by Consumption Analysis 2025 & 2033
- Figure 18: South America Satellite Parts and Components Market Revenue (billion), by Import Market Analysis (Value & Volume) 2025 & 2033
- Figure 19: South America Satellite Parts and Components Market Revenue Share (%), by Import Market Analysis (Value & Volume) 2025 & 2033
- Figure 20: South America Satellite Parts and Components Market Revenue (billion), by Export Market Analysis (Value & Volume) 2025 & 2033
- Figure 21: South America Satellite Parts and Components Market Revenue Share (%), by Export Market Analysis (Value & Volume) 2025 & 2033
- Figure 22: South America Satellite Parts and Components Market Revenue (billion), by Price Trend Analysis 2025 & 2033
- Figure 23: South America Satellite Parts and Components Market Revenue Share (%), by Price Trend Analysis 2025 & 2033
- Figure 24: South America Satellite Parts and Components Market Revenue (billion), by Country 2025 & 2033
- Figure 25: South America Satellite Parts and Components Market Revenue Share (%), by Country 2025 & 2033
- Figure 26: Europe Satellite Parts and Components Market Revenue (billion), by Production Analysis 2025 & 2033
- Figure 27: Europe Satellite Parts and Components Market Revenue Share (%), by Production Analysis 2025 & 2033
- Figure 28: Europe Satellite Parts and Components Market Revenue (billion), by Consumption Analysis 2025 & 2033
- Figure 29: Europe Satellite Parts and Components Market Revenue Share (%), by Consumption Analysis 2025 & 2033
- Figure 30: Europe Satellite Parts and Components Market Revenue (billion), by Import Market Analysis (Value & Volume) 2025 & 2033
- Figure 31: Europe Satellite Parts and Components Market Revenue Share (%), by Import Market Analysis (Value & Volume) 2025 & 2033
- Figure 32: Europe Satellite Parts and Components Market Revenue (billion), by Export Market Analysis (Value & Volume) 2025 & 2033
- Figure 33: Europe Satellite Parts and Components Market Revenue Share (%), by Export Market Analysis (Value & Volume) 2025 & 2033
- Figure 34: Europe Satellite Parts and Components Market Revenue (billion), by Price Trend Analysis 2025 & 2033
- Figure 35: Europe Satellite Parts and Components Market Revenue Share (%), by Price Trend Analysis 2025 & 2033
- Figure 36: Europe Satellite Parts and Components Market Revenue (billion), by Country 2025 & 2033
- Figure 37: Europe Satellite Parts and Components Market Revenue Share (%), by Country 2025 & 2033
- Figure 38: Middle East & Africa Satellite Parts and Components Market Revenue (billion), by Production Analysis 2025 & 2033
- Figure 39: Middle East & Africa Satellite Parts and Components Market Revenue Share (%), by Production Analysis 2025 & 2033
- Figure 40: Middle East & Africa Satellite Parts and Components Market Revenue (billion), by Consumption Analysis 2025 & 2033
- Figure 41: Middle East & Africa Satellite Parts and Components Market Revenue Share (%), by Consumption Analysis 2025 & 2033
- Figure 42: Middle East & Africa Satellite Parts and Components Market Revenue (billion), by Import Market Analysis (Value & Volume) 2025 & 2033
- Figure 43: Middle East & Africa Satellite Parts and Components Market Revenue Share (%), by Import Market Analysis (Value & Volume) 2025 & 2033
- Figure 44: Middle East & Africa Satellite Parts and Components Market Revenue (billion), by Export Market Analysis (Value & Volume) 2025 & 2033
- Figure 45: Middle East & Africa Satellite Parts and Components Market Revenue Share (%), by Export Market Analysis (Value & Volume) 2025 & 2033
- Figure 46: Middle East & Africa Satellite Parts and Components Market Revenue (billion), by Price Trend Analysis 2025 & 2033
- Figure 47: Middle East & Africa Satellite Parts and Components Market Revenue Share (%), by Price Trend Analysis 2025 & 2033
- Figure 48: Middle East & Africa Satellite Parts and Components Market Revenue (billion), by Country 2025 & 2033
- Figure 49: Middle East & Africa Satellite Parts and Components Market Revenue Share (%), by Country 2025 & 2033
- Figure 50: Asia Pacific Satellite Parts and Components Market Revenue (billion), by Production Analysis 2025 & 2033
- Figure 51: Asia Pacific Satellite Parts and Components Market Revenue Share (%), by Production Analysis 2025 & 2033
- Figure 52: Asia Pacific Satellite Parts and Components Market Revenue (billion), by Consumption Analysis 2025 & 2033
- Figure 53: Asia Pacific Satellite Parts and Components Market Revenue Share (%), by Consumption Analysis 2025 & 2033
- Figure 54: Asia Pacific Satellite Parts and Components Market Revenue (billion), by Import Market Analysis (Value & Volume) 2025 & 2033
- Figure 55: Asia Pacific Satellite Parts and Components Market Revenue Share (%), by Import Market Analysis (Value & Volume) 2025 & 2033
- Figure 56: Asia Pacific Satellite Parts and Components Market Revenue (billion), by Export Market Analysis (Value & Volume) 2025 & 2033
- Figure 57: Asia Pacific Satellite Parts and Components Market Revenue Share (%), by Export Market Analysis (Value & Volume) 2025 & 2033
- Figure 58: Asia Pacific Satellite Parts and Components Market Revenue (billion), by Price Trend Analysis 2025 & 2033
- Figure 59: Asia Pacific Satellite Parts and Components Market Revenue Share (%), by Price Trend Analysis 2025 & 2033
- Figure 60: Asia Pacific Satellite Parts and Components Market Revenue (billion), by Country 2025 & 2033
- Figure 61: Asia Pacific Satellite Parts and Components Market Revenue Share (%), by Country 2025 & 2033
List of Tables
- Table 1: Global Satellite Parts and Components Market Revenue billion Forecast, by Production Analysis 2020 & 2033
- Table 2: Global Satellite Parts and Components Market Revenue billion Forecast, by Consumption Analysis 2020 & 2033
- Table 3: Global Satellite Parts and Components Market Revenue billion Forecast, by Import Market Analysis (Value & Volume) 2020 & 2033
- Table 4: Global Satellite Parts and Components Market Revenue billion Forecast, by Export Market Analysis (Value & Volume) 2020 & 2033
- Table 5: Global Satellite Parts and Components Market Revenue billion Forecast, by Price Trend Analysis 2020 & 2033
- Table 6: Global Satellite Parts and Components Market Revenue billion Forecast, by Region 2020 & 2033
- Table 7: Global Satellite Parts and Components Market Revenue billion Forecast, by Production Analysis 2020 & 2033
- Table 8: Global Satellite Parts and Components Market Revenue billion Forecast, by Consumption Analysis 2020 & 2033
- Table 9: Global Satellite Parts and Components Market Revenue billion Forecast, by Import Market Analysis (Value & Volume) 2020 & 2033
- Table 10: Global Satellite Parts and Components Market Revenue billion Forecast, by Export Market Analysis (Value & Volume) 2020 & 2033
- Table 11: Global Satellite Parts and Components Market Revenue billion Forecast, by Price Trend Analysis 2020 & 2033
- Table 12: Global Satellite Parts and Components Market Revenue billion Forecast, by Country 2020 & 2033
- Table 13: United States Satellite Parts and Components Market Revenue (billion) Forecast, by Application 2020 & 2033
- Table 14: Canada Satellite Parts and Components Market Revenue (billion) Forecast, by Application 2020 & 2033
- Table 15: Mexico Satellite Parts and Components Market Revenue (billion) Forecast, by Application 2020 & 2033
- Table 16: Global Satellite Parts and Components Market Revenue billion Forecast, by Production Analysis 2020 & 2033
- Table 17: Global Satellite Parts and Components Market Revenue billion Forecast, by Consumption Analysis 2020 & 2033
- Table 18: Global Satellite Parts and Components Market Revenue billion Forecast, by Import Market Analysis (Value & Volume) 2020 & 2033
- Table 19: Global Satellite Parts and Components Market Revenue billion Forecast, by Export Market Analysis (Value & Volume) 2020 & 2033
- Table 20: Global Satellite Parts and Components Market Revenue billion Forecast, by Price Trend Analysis 2020 & 2033
- Table 21: Global Satellite Parts and Components Market Revenue billion Forecast, by Country 2020 & 2033
- Table 22: Brazil Satellite Parts and Components Market Revenue (billion) Forecast, by Application 2020 & 2033
- Table 23: Argentina Satellite Parts and Components Market Revenue (billion) Forecast, by Application 2020 & 2033
- Table 24: Rest of South America Satellite Parts and Components Market Revenue (billion) Forecast, by Application 2020 & 2033
- Table 25: Global Satellite Parts and Components Market Revenue billion Forecast, by Production Analysis 2020 & 2033
- Table 26: Global Satellite Parts and Components Market Revenue billion Forecast, by Consumption Analysis 2020 & 2033
- Table 27: Global Satellite Parts and Components Market Revenue billion Forecast, by Import Market Analysis (Value & Volume) 2020 & 2033
- Table 28: Global Satellite Parts and Components Market Revenue billion Forecast, by Export Market Analysis (Value & Volume) 2020 & 2033
- Table 29: Global Satellite Parts and Components Market Revenue billion Forecast, by Price Trend Analysis 2020 & 2033
- Table 30: Global Satellite Parts and Components Market Revenue billion Forecast, by Country 2020 & 2033
- Table 31: United Kingdom Satellite Parts and Components Market Revenue (billion) Forecast, by Application 2020 & 2033
- Table 32: Germany Satellite Parts and Components Market Revenue (billion) Forecast, by Application 2020 & 2033
- Table 33: France Satellite Parts and Components Market Revenue (billion) Forecast, by Application 2020 & 2033
- Table 34: Italy Satellite Parts and Components Market Revenue (billion) Forecast, by Application 2020 & 2033
- Table 35: Spain Satellite Parts and Components Market Revenue (billion) Forecast, by Application 2020 & 2033
- Table 36: Russia Satellite Parts and Components Market Revenue (billion) Forecast, by Application 2020 & 2033
- Table 37: Benelux Satellite Parts and Components Market Revenue (billion) Forecast, by Application 2020 & 2033
- Table 38: Nordics Satellite Parts and Components Market Revenue (billion) Forecast, by Application 2020 & 2033
- Table 39: Rest of Europe Satellite Parts and Components Market Revenue (billion) Forecast, by Application 2020 & 2033
- Table 40: Global Satellite Parts and Components Market Revenue billion Forecast, by Production Analysis 2020 & 2033
- Table 41: Global Satellite Parts and Components Market Revenue billion Forecast, by Consumption Analysis 2020 & 2033
- Table 42: Global Satellite Parts and Components Market Revenue billion Forecast, by Import Market Analysis (Value & Volume) 2020 & 2033
- Table 43: Global Satellite Parts and Components Market Revenue billion Forecast, by Export Market Analysis (Value & Volume) 2020 & 2033
- Table 44: Global Satellite Parts and Components Market Revenue billion Forecast, by Price Trend Analysis 2020 & 2033
- Table 45: Global Satellite Parts and Components Market Revenue billion Forecast, by Country 2020 & 2033
- Table 46: Turkey Satellite Parts and Components Market Revenue (billion) Forecast, by Application 2020 & 2033
- Table 47: Israel Satellite Parts and Components Market Revenue (billion) Forecast, by Application 2020 & 2033
- Table 48: GCC Satellite Parts and Components Market Revenue (billion) Forecast, by Application 2020 & 2033
- Table 49: North Africa Satellite Parts and Components Market Revenue (billion) Forecast, by Application 2020 & 2033
- Table 50: South Africa Satellite Parts and Components Market Revenue (billion) Forecast, by Application 2020 & 2033
- Table 51: Rest of Middle East & Africa Satellite Parts and Components Market Revenue (billion) Forecast, by Application 2020 & 2033
- Table 52: Global Satellite Parts and Components Market Revenue billion Forecast, by Production Analysis 2020 & 2033
- Table 53: Global Satellite Parts and Components Market Revenue billion Forecast, by Consumption Analysis 2020 & 2033
- Table 54: Global Satellite Parts and Components Market Revenue billion Forecast, by Import Market Analysis (Value & Volume) 2020 & 2033
- Table 55: Global Satellite Parts and Components Market Revenue billion Forecast, by Export Market Analysis (Value & Volume) 2020 & 2033
- Table 56: Global Satellite Parts and Components Market Revenue billion Forecast, by Price Trend Analysis 2020 & 2033
- Table 57: Global Satellite Parts and Components Market Revenue billion Forecast, by Country 2020 & 2033
- Table 58: China Satellite Parts and Components Market Revenue (billion) Forecast, by Application 2020 & 2033
- Table 59: India Satellite Parts and Components Market Revenue (billion) Forecast, by Application 2020 & 2033
- Table 60: Japan Satellite Parts and Components Market Revenue (billion) Forecast, by Application 2020 & 2033
- Table 61: South Korea Satellite Parts and Components Market Revenue (billion) Forecast, by Application 2020 & 2033
- Table 62: ASEAN Satellite Parts and Components Market Revenue (billion) Forecast, by Application 2020 & 2033
- Table 63: Oceania Satellite Parts and Components Market Revenue (billion) Forecast, by Application 2020 & 2033
- Table 64: Rest of Asia Pacific Satellite Parts and Components Market Revenue (billion) Forecast, by Application 2020 & 2033
Frequently Asked Questions
1. What is the projected Compound Annual Growth Rate (CAGR) of the Satellite Parts and Components Market?
The projected CAGR is approximately 7%.
2. Which companies are prominent players in the Satellite Parts and Components Market?
Key companies in the market include BAE Systems, SENER Group, Lockheed Martin Corporation, The Boeing Compan, General Dynamics, Thales, OHB SE, Innovative Solutions in Space BV, Sitael S p A, Northrop Grumman Corporation, Jena-Optronik, AAC Clyde Space.
3. What are the main segments of the Satellite Parts and Components Market?
The market segments include Production Analysis, Consumption Analysis, Import Market Analysis (Value & Volume), Export Market Analysis (Value & Volume), Price Trend Analysis.
4. Can you provide details about the market size?
The market size is estimated to be USD 25 billion as of 2022.
5. What are some drivers contributing to market growth?
N/A
6. What are the notable trends driving market growth?
OTHER KEY INDUSTRY TRENDS COVERED IN THE REPORT.
7. Are there any restraints impacting market growth?
N/A
8. Can you provide examples of recent developments in the market?
January 2023: ISISPACE has launched 47 payloads from 8 different countries during its ISILAUNCH38 mission on board Falcon 9 Rocket. ISILAUNCH partnered with SpaceBD from Japan, to jointly manifest payloads from Japan, Europe, and other parts of the world on the launch on one of the ports on this launch.December 2022: ASTRO CL, the smallest member of the Jena-Optronik star sensor family was be used on the new LEO platform from Maxar. Each satellite is equipped with two ASTRO CL sensors, which support the attitude control of these satellites.November 2022: As part of NASA's Artemis I mission, the Orion spacecraft successfully launched into space on November 16, 2022. Two star trackers from Jena-Optronik GmbH guided the Orion on its way to lunar orbit.
9. What pricing options are available for accessing the report?
Pricing options include single-user, multi-user, and enterprise licenses priced at USD 3800, USD 4500, and USD 5800 respectively.
10. Is the market size provided in terms of value or volume?
The market size is provided in terms of value, measured in billion.
11. Are there any specific market keywords associated with the report?
Yes, the market keyword associated with the report is "Satellite Parts and Components Market," which aids in identifying and referencing the specific market segment covered.
12. How do I determine which pricing option suits my needs best?
The pricing options vary based on user requirements and access needs. Individual users may opt for single-user licenses, while businesses requiring broader access may choose multi-user or enterprise licenses for cost-effective access to the report.
13. Are there any additional resources or data provided in the Satellite Parts and Components Market report?
While the report offers comprehensive insights, it's advisable to review the specific contents or supplementary materials provided to ascertain if additional resources or data are available.
14. How can I stay updated on further developments or reports in the Satellite Parts and Components Market?
To stay informed about further developments, trends, and reports in the Satellite Parts and Components Market, consider subscribing to industry newsletters, following relevant companies and organizations, or regularly checking reputable industry news sources and publications.
Methodology
Step 1 - Identification of Relevant Samples Size from Population Database


Step 2 - Approaches for Defining Global Market Size (Value, Volume* & Price*)

Note*: In applicable scenarios
Step 3 - Data Sources
Primary Research
- Web Analytics
- Survey Reports
- Research Institute
- Latest Research Reports
- Opinion Leaders
Secondary Research
- Annual Reports
- White Paper
- Latest Press Release
- Industry Association
- Paid Database
- Investor Presentations

Step 4 - Data Triangulation
Involves using different sources of information in order to increase the validity of a study
These sources are likely to be stakeholders in a program - participants, other researchers, program staff, other community members, and so on.
Then we put all data in single framework & apply various statistical tools to find out the dynamic on the market.
During the analysis stage, feedback from the stakeholder groups would be compared to determine areas of agreement as well as areas of divergence