

Key Insights
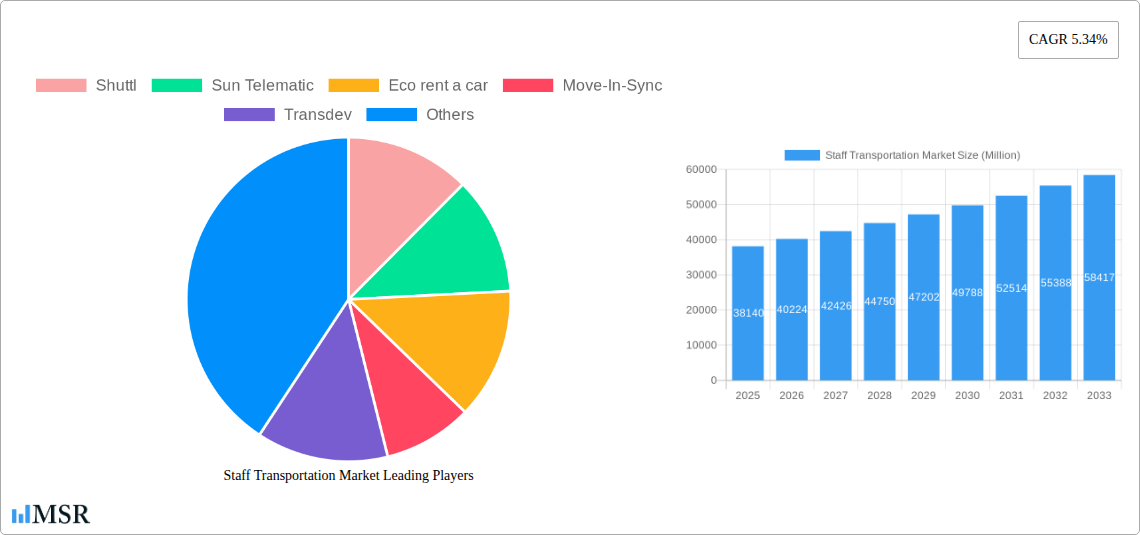
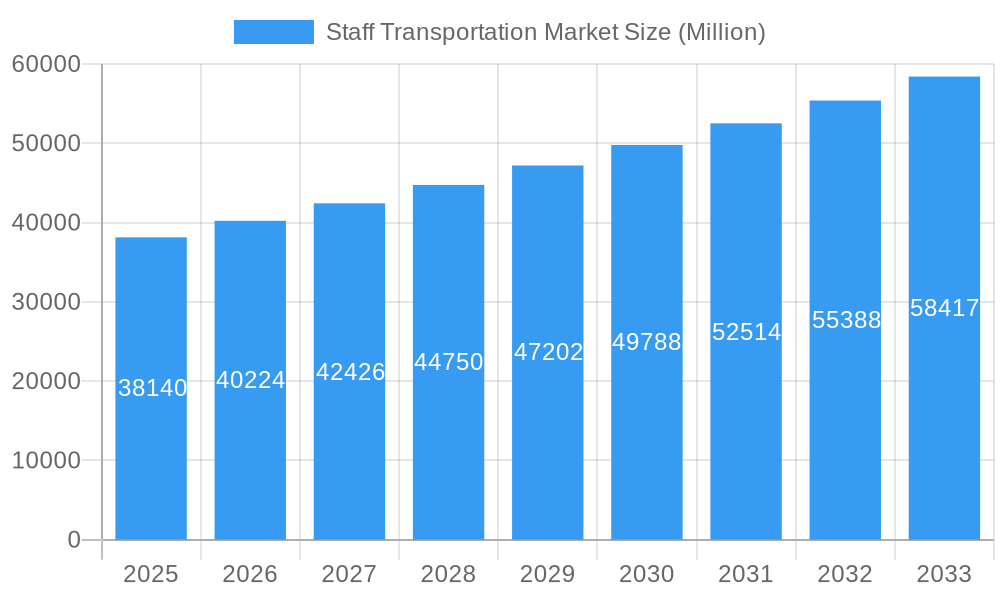
The global staff transportation market, valued at $38.14 billion in 2025, is projected to experience robust growth, driven by a compound annual growth rate (CAGR) of 5.34% from 2025 to 2033. This expansion is fueled by several key factors. The increasing adoption of Mobility as a Service (MaaS) solutions offers cost-effective and efficient staff transportation, particularly for large corporations and organizations. Furthermore, the rising awareness of employee well-being and the need for safe and reliable commuting options are bolstering market demand. Technological advancements, such as real-time tracking and route optimization software, are enhancing operational efficiency and improving service quality. The shift towards sustainable transportation solutions, including electric vehicle fleets and eco-friendly routing, is also gaining momentum, contributing to market growth. Growth is further supported by the expansion of outsourcing transportation services, as companies increasingly focus on core competencies and delegate non-core functions like staff transportation. However, factors like fluctuating fuel prices, stringent regulatory compliance, and the impact of economic downturns pose challenges to market growth. The market is segmented by service type (MaaS, SaaS), ownership (company-owned, outsourced, rentals, pick-and-drop), and passenger vehicle type (cars, vans, buses), providing diverse options for businesses of all sizes.
Staff Transportation Market Market Size (In Billion)
Geographical diversification also plays a crucial role in shaping the market. North America and Europe currently hold significant market shares, driven by the presence of established players and a strong emphasis on corporate social responsibility. However, rapid urbanization and economic growth in Asia-Pacific, particularly in India and China, are creating lucrative opportunities for staff transportation providers. The Middle East and Africa are also witnessing increasing demand due to infrastructural development and rising disposable incomes. Competitive dynamics are characterized by a mix of large multinational corporations and smaller specialized providers, fostering innovation and driving competition. The market is expected to see further consolidation as companies seek to expand their service offerings and geographical reach. The forecast period, 2025-2033, promises substantial growth, presenting significant investment opportunities for players in the staff transportation sector.
Staff Transportation Market Company Market Share
Staff Transportation Market Report: 2019-2033 Forecast
This comprehensive report provides an in-depth analysis of the Staff Transportation Market, offering invaluable insights for industry stakeholders, investors, and strategic decision-makers. Covering the period from 2019 to 2033, with a focus on 2025, this report meticulously examines market dynamics, key segments, leading players, and future growth opportunities. The market size is estimated to reach xx Million by 2025 and is projected to experience a Compound Annual Growth Rate (CAGR) of xx% during the forecast period (2025-2033).
Staff Transportation Market Market Concentration & Dynamics
The Staff Transportation Market exhibits a moderately concentrated landscape, with a few major players holding significant market share. However, the market is witnessing increased competition from new entrants and innovative business models. The market's dynamics are shaped by several factors:
- Market Concentration: The top five players account for approximately xx% of the global market share in 2025. This concentration is expected to slightly decrease by 2033 due to increased competition.
- Innovation Ecosystems: Rapid technological advancements, particularly in electric vehicles and MaaS platforms, are driving innovation within the market. Startups are playing a crucial role in developing niche solutions and disrupting traditional models.
- Regulatory Frameworks: Government regulations concerning safety, emissions, and accessibility significantly impact market operations. Varying regulations across different regions create diverse market landscapes.
- Substitute Products: Private vehicle ownership and public transportation systems pose competitive challenges to staff transportation services. However, the convenience and cost-effectiveness of staff transportation solutions are key differentiators.
- End-User Trends: Growing preference for eco-friendly transportation options, increased demand for flexible commuting solutions, and a focus on employee well-being are driving market growth.
- M&A Activities: The number of mergers and acquisitions in the Staff Transportation Market has increased over the past five years, with xx deals recorded between 2019 and 2024. This trend indicates consolidation and expansion within the market.
Staff Transportation Market Industry Insights & Trends
The Staff Transportation Market is experiencing robust growth, fueled by several key factors. The market size was valued at xx Million in 2024, and is expected to reach xx Million by 2025, exhibiting a CAGR of xx% from 2019 to 2024. Several key trends are shaping the industry:
- Market Growth Drivers: Rising urbanization, increasing corporate focus on employee satisfaction, and the growing adoption of sustainable transportation solutions are major drivers of market expansion. Cost-effectiveness compared to individual employee commuting also significantly boosts market growth.
- Technological Disruptions: The integration of technology, including mobile apps, GPS tracking, and real-time data analytics, is enhancing efficiency and customer experience. The increasing adoption of electric vehicles is significantly impacting the market's environmental footprint and cost structure.
- Evolving Consumer Behaviors: Employees increasingly prioritize convenience, safety, and sustainability in their commuting options. This shift in preferences is driving demand for innovative and flexible staff transportation solutions.
Key Markets & Segments Leading Staff Transportation Market
The Staff Transportation Market is geographically diverse, with significant growth observed across various regions. However, North America and Europe currently dominate the market, driven by high corporate adoption and well-developed infrastructure. Within market segments:
- Dominant Region/Country: North America currently holds the largest market share, followed by Europe. Asia-Pacific is expected to witness significant growth in the coming years.
- Service Type: Mobility as a Service (MaaS) solutions are gaining traction, owing to their flexibility and convenience. Software as a Service (SaaS) solutions are also witnessing strong adoption to streamline transportation management.
- Ownership: Outsourced transportation services hold a significant market share, particularly among large corporations seeking cost efficiency and streamlined operations.
- Passenger Vehicle Type: Buses are the most prevalent vehicle type due to their capacity to transport large numbers of employees. However, the adoption of vans and cars is also significant, depending on the specific needs of the organization and route characteristics.
Drivers of Growth:
- Economic Growth: Strong economic conditions in key regions foster increased corporate spending on employee benefits, including staff transportation.
- Infrastructure Development: Investments in public transportation and road infrastructure directly influence the efficiency and feasibility of staff transportation services.
- Technological Advancements: The continuous improvement in electric vehicle technology and the development of intelligent transportation systems drive market growth.
Staff Transportation Market Product Developments
Recent product innovations focus on enhancing efficiency, safety, and sustainability. This includes the integration of electric vehicles, advanced route optimization software, and real-time tracking systems. Companies are increasingly focusing on providing customized solutions tailored to the specific requirements of their clients, creating a competitive advantage.
Challenges in the Staff Transportation Market Market
The Staff Transportation Market faces several challenges, including stringent regulatory requirements, fluctuating fuel prices, and competition from other transportation modes. Supply chain disruptions and the rising cost of labor also pose significant hurdles. These factors collectively contribute to increased operational costs and potentially impact profitability.
Forces Driving Staff Transportation Market Growth
Key growth drivers include the increasing adoption of sustainable transport solutions, technological advancements, favorable government policies, and rising corporate emphasis on employee well-being. The growing demand for flexible work arrangements and the need for efficient employee commute solutions further fuel market growth.
Challenges in the Staff Transportation Market Market
Long-term growth will be influenced by successful integration of innovative technologies, strategic partnerships with technology providers, and expansion into new and emerging markets. The continued adoption of electric vehicles and the development of smart city initiatives will also be crucial.
Emerging Opportunities in Staff Transportation Market
Emerging opportunities lie in the expansion into underserved markets, the development of integrated mobility solutions, and the leveraging of data analytics to improve operational efficiency. The adoption of autonomous vehicles and the integration of staff transportation with other employee benefits programs represent significant future potentials.
Key Milestones in Staff Transportation Market Industry
- June 2022: Switch Mobility launches the EiV12 electric bus, targeting inter-city and intra-city staff transportation. This marks a significant step towards sustainable staff transportation.
- September 2021: Uber India launches a corporate shuttle service, increasing competition and convenience for employee commuting.
- December 2021: Transdev deploys the largest electric bus fleet in the Nordic region, showcasing the growing trend towards electric vehicles in staff transportation.
Strategic Outlook for Staff Transportation Market Market
The Staff Transportation Market is poised for continued growth, driven by technological advancements, increasing demand for sustainable transportation, and a focus on employee well-being. Strategic opportunities exist for companies that can effectively leverage technology, offer flexible and customized solutions, and expand into new markets. The future success of players in this market hinges on adaptability, innovation, and a commitment to sustainability.
Staff Transportation Market Segmentation
-
1. Ownership
- 1.1. Company-owned Transportation Service
- 1.2. Outsourced Transportation Service
- 1.3. Rentals
- 1.4. Pick and Drop Transportation Service
-
2. Passenger Vehicle Type
- 2.1. Cars
- 2.2. Vans
- 2.3. Bus
-
3. Service Type
- 3.1. Mobility as a Service (MaaS)
- 3.2. Software as a Service (SaaS)
Staff Transportation Market Segmentation By Geography
-
1. North America
- 1.1. United States
- 1.2. Canada
- 1.3. Rest of North America
-
2. Europe
- 2.1. Germany
- 2.2. United Kingdom
- 2.3. France
- 2.4. Rest of Europe
-
3. Asia Pacific
- 3.1. India
- 3.2. China
- 3.3. Japan
- 3.4. Rest of Asia Pacific
-
4. South America
- 4.1. Brazil
- 4.2. Argentina
- 4.3. Rest of the South America
-
5. Middle East and Africa
- 5.1. United Arab Emirates
- 5.2. Saudi Arabia
- 5.3. Rest of the Middle East and Africa
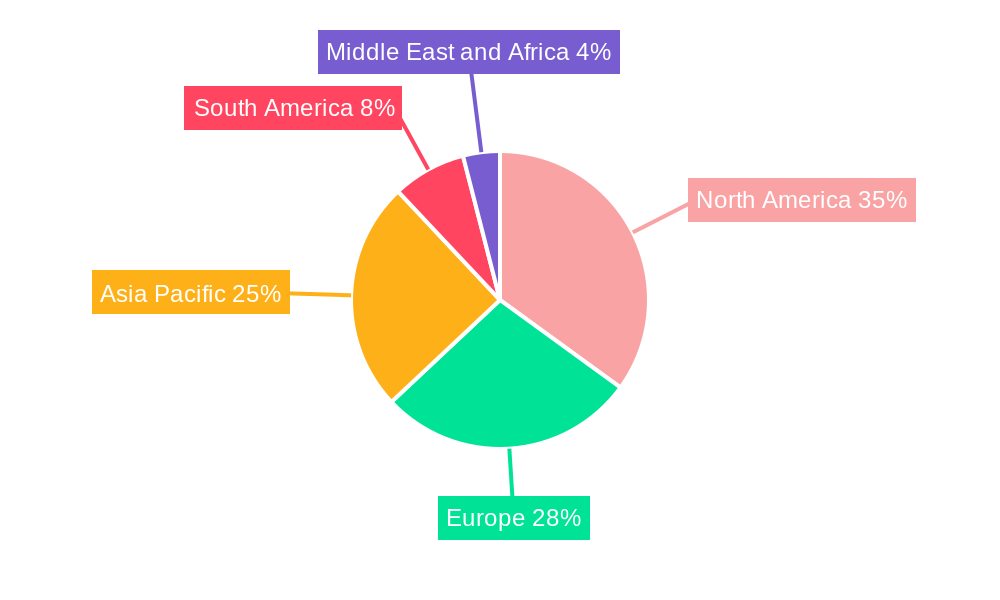
Staff Transportation Market Regional Market Share
Geographic Coverage of Staff Transportation Market
Staff Transportation Market REPORT HIGHLIGHTS
| Aspects | Details |
|---|---|
| Study Period | 2020-2034 |
| Base Year | 2025 |
| Estimated Year | 2026 |
| Forecast Period | 2026-2034 |
| Historical Period | 2020-2025 |
| Growth Rate | CAGR of 5.34% from 2020-2034 |
| Segmentation |
|
Table of Contents
- 1. Introduction
- 1.1. Research Scope
- 1.2. Market Segmentation
- 1.3. Research Objective
- 1.4. Definitions and Assumptions
- 2. Executive Summary
- 2.1. Market Snapshot
- 3. Market Dynamics
- 3.1. Market Drivers
- 3.2. Market Restrains
- 3.3. Market Trends
- 3.4. Market Opportunities
- 4. Market Factor Analysis
- 4.1. Porters Five Forces
- 4.1.1. Bargaining Power of Suppliers
- 4.1.2. Bargaining Power of Buyers
- 4.1.3. Threat of New Entrants
- 4.1.4. Threat of Substitutes
- 4.1.5. Competitive Rivalry
- 4.2. PESTEL analysis
- 4.3. BCG Analysis
- 4.3.1. Stars (High Growth, High Market Share)
- 4.3.2. Cash Cows (Low Growth, High Market Share)
- 4.3.3. Question Mark (High Growth, Low Market Share)
- 4.3.4. Dogs (Low Growth, Low Market Share)
- 4.4. Ansoff Matrix Analysis
- 4.5. Supply Chain Analysis
- 4.6. Regulatory Landscape
- 4.7. Current Market Potential and Opportunity Assessment (TAM–SAM–SOM Framework)
- 4.8. MSR Analyst Note
- 4.1. Porters Five Forces
- 5. Market Analysis, Insights and Forecast 2021-2033
- 5.1. Market Analysis, Insights and Forecast - by Ownership
- 5.1.1. Company-owned Transportation Service
- 5.1.2. Outsourced Transportation Service
- 5.1.3. Rentals
- 5.1.4. Pick and Drop Transportation Service
- 5.2. Market Analysis, Insights and Forecast - by Passenger Vehicle Type
- 5.2.1. Cars
- 5.2.2. Vans
- 5.2.3. Bus
- 5.3. Market Analysis, Insights and Forecast - by Service Type
- 5.3.1. Mobility as a Service (MaaS)
- 5.3.2. Software as a Service (SaaS)
- 5.4. Market Analysis, Insights and Forecast - by Region
- 5.4.1. North America
- 5.4.2. Europe
- 5.4.3. Asia Pacific
- 5.4.4. South America
- 5.4.5. Middle East and Africa
- 5.1. Market Analysis, Insights and Forecast - by Ownership
- 6. Global Staff Transportation Market Analysis, Insights and Forecast, 2021-2033
- 6.1. Market Analysis, Insights and Forecast - by Ownership
- 6.1.1. Company-owned Transportation Service
- 6.1.2. Outsourced Transportation Service
- 6.1.3. Rentals
- 6.1.4. Pick and Drop Transportation Service
- 6.2. Market Analysis, Insights and Forecast - by Passenger Vehicle Type
- 6.2.1. Cars
- 6.2.2. Vans
- 6.2.3. Bus
- 6.3. Market Analysis, Insights and Forecast - by Service Type
- 6.3.1. Mobility as a Service (MaaS)
- 6.3.2. Software as a Service (SaaS)
- 6.1. Market Analysis, Insights and Forecast - by Ownership
- 7. North America Staff Transportation Market Analysis, Insights and Forecast, 2020-2032
- 7.1. Market Analysis, Insights and Forecast - by Ownership
- 7.1.1. Company-owned Transportation Service
- 7.1.2. Outsourced Transportation Service
- 7.1.3. Rentals
- 7.1.4. Pick and Drop Transportation Service
- 7.2. Market Analysis, Insights and Forecast - by Passenger Vehicle Type
- 7.2.1. Cars
- 7.2.2. Vans
- 7.2.3. Bus
- 7.3. Market Analysis, Insights and Forecast - by Service Type
- 7.3.1. Mobility as a Service (MaaS)
- 7.3.2. Software as a Service (SaaS)
- 7.1. Market Analysis, Insights and Forecast - by Ownership
- 8. Europe Staff Transportation Market Analysis, Insights and Forecast, 2020-2032
- 8.1. Market Analysis, Insights and Forecast - by Ownership
- 8.1.1. Company-owned Transportation Service
- 8.1.2. Outsourced Transportation Service
- 8.1.3. Rentals
- 8.1.4. Pick and Drop Transportation Service
- 8.2. Market Analysis, Insights and Forecast - by Passenger Vehicle Type
- 8.2.1. Cars
- 8.2.2. Vans
- 8.2.3. Bus
- 8.3. Market Analysis, Insights and Forecast - by Service Type
- 8.3.1. Mobility as a Service (MaaS)
- 8.3.2. Software as a Service (SaaS)
- 8.1. Market Analysis, Insights and Forecast - by Ownership
- 9. Asia Pacific Staff Transportation Market Analysis, Insights and Forecast, 2020-2032
- 9.1. Market Analysis, Insights and Forecast - by Ownership
- 9.1.1. Company-owned Transportation Service
- 9.1.2. Outsourced Transportation Service
- 9.1.3. Rentals
- 9.1.4. Pick and Drop Transportation Service
- 9.2. Market Analysis, Insights and Forecast - by Passenger Vehicle Type
- 9.2.1. Cars
- 9.2.2. Vans
- 9.2.3. Bus
- 9.3. Market Analysis, Insights and Forecast - by Service Type
- 9.3.1. Mobility as a Service (MaaS)
- 9.3.2. Software as a Service (SaaS)
- 9.1. Market Analysis, Insights and Forecast - by Ownership
- 10. South America Staff Transportation Market Analysis, Insights and Forecast, 2020-2032
- 10.1. Market Analysis, Insights and Forecast - by Ownership
- 10.1.1. Company-owned Transportation Service
- 10.1.2. Outsourced Transportation Service
- 10.1.3. Rentals
- 10.1.4. Pick and Drop Transportation Service
- 10.2. Market Analysis, Insights and Forecast - by Passenger Vehicle Type
- 10.2.1. Cars
- 10.2.2. Vans
- 10.2.3. Bus
- 10.3. Market Analysis, Insights and Forecast - by Service Type
- 10.3.1. Mobility as a Service (MaaS)
- 10.3.2. Software as a Service (SaaS)
- 10.1. Market Analysis, Insights and Forecast - by Ownership
- 11. Middle East and Africa Staff Transportation Market Analysis, Insights and Forecast, 2020-2032
- 11.1. Market Analysis, Insights and Forecast - by Ownership
- 11.1.1. Company-owned Transportation Service
- 11.1.2. Outsourced Transportation Service
- 11.1.3. Rentals
- 11.1.4. Pick and Drop Transportation Service
- 11.2. Market Analysis, Insights and Forecast - by Passenger Vehicle Type
- 11.2.1. Cars
- 11.2.2. Vans
- 11.2.3. Bus
- 11.3. Market Analysis, Insights and Forecast - by Service Type
- 11.3.1. Mobility as a Service (MaaS)
- 11.3.2. Software as a Service (SaaS)
- 11.1. Market Analysis, Insights and Forecast - by Ownership
- 12. Competitive Analysis
- 12.1. Company Profiles
- 12.1.1 Shuttl
- 12.1.1.1. Company Overview
- 12.1.1.2. Products
- 12.1.1.3. Company Financials
- 12.1.1.4. SWOT Analysis
- 12.1.2 Sun Telematic
- 12.1.2.1. Company Overview
- 12.1.2.2. Products
- 12.1.2.3. Company Financials
- 12.1.2.4. SWOT Analysis
- 12.1.3 Eco rent a car
- 12.1.3.1. Company Overview
- 12.1.3.2. Products
- 12.1.3.3. Company Financials
- 12.1.3.4. SWOT Analysis
- 12.1.4 Move-In-Sync
- 12.1.4.1. Company Overview
- 12.1.4.2. Products
- 12.1.4.3. Company Financials
- 12.1.4.4. SWOT Analysis
- 12.1.5 Transdev
- 12.1.5.1. Company Overview
- 12.1.5.2. Products
- 12.1.5.3. Company Financials
- 12.1.5.4. SWOT Analysis
- 12.1.6 Prairie Bus Line Limited
- 12.1.6.1. Company Overview
- 12.1.6.2. Products
- 12.1.6.3. Company Financials
- 12.1.6.4. SWOT Analysis
- 12.1.7 Janani Tours
- 12.1.7.1. Company Overview
- 12.1.7.2. Products
- 12.1.7.3. Company Financials
- 12.1.7.4. SWOT Analysis
- 12.1.8 Busbank (Global Charter Services Ltd )
- 12.1.8.1. Company Overview
- 12.1.8.2. Products
- 12.1.8.3. Company Financials
- 12.1.8.4. SWOT Analysis
- 12.1.9 First Class Tours
- 12.1.9.1. Company Overview
- 12.1.9.2. Products
- 12.1.9.3. Company Financials
- 12.1.9.4. SWOT Analysis
- 12.1.1 Shuttl
- 12.2. Market Entropy
- 12.2.1 Company's Key Areas Served
- 12.2.2 Recent Developments
- 12.3. Company Market Share Analysis 2025
- 12.3.1 Top 5 Companies Market Share Analysis
- 12.3.2 Top 3 Companies Market Share Analysis
- 12.4. List of Potential Customers
- 13. Research Methodology
List of Figures
- Figure 1: Global Staff Transportation Market Revenue Breakdown (Million, %) by Region 2025 & 2033
- Figure 2: North America Staff Transportation Market Revenue (Million), by Ownership 2025 & 2033
- Figure 3: North America Staff Transportation Market Revenue Share (%), by Ownership 2025 & 2033
- Figure 4: North America Staff Transportation Market Revenue (Million), by Passenger Vehicle Type 2025 & 2033
- Figure 5: North America Staff Transportation Market Revenue Share (%), by Passenger Vehicle Type 2025 & 2033
- Figure 6: North America Staff Transportation Market Revenue (Million), by Service Type 2025 & 2033
- Figure 7: North America Staff Transportation Market Revenue Share (%), by Service Type 2025 & 2033
- Figure 8: North America Staff Transportation Market Revenue (Million), by Country 2025 & 2033
- Figure 9: North America Staff Transportation Market Revenue Share (%), by Country 2025 & 2033
- Figure 10: Europe Staff Transportation Market Revenue (Million), by Ownership 2025 & 2033
- Figure 11: Europe Staff Transportation Market Revenue Share (%), by Ownership 2025 & 2033
- Figure 12: Europe Staff Transportation Market Revenue (Million), by Passenger Vehicle Type 2025 & 2033
- Figure 13: Europe Staff Transportation Market Revenue Share (%), by Passenger Vehicle Type 2025 & 2033
- Figure 14: Europe Staff Transportation Market Revenue (Million), by Service Type 2025 & 2033
- Figure 15: Europe Staff Transportation Market Revenue Share (%), by Service Type 2025 & 2033
- Figure 16: Europe Staff Transportation Market Revenue (Million), by Country 2025 & 2033
- Figure 17: Europe Staff Transportation Market Revenue Share (%), by Country 2025 & 2033
- Figure 18: Asia Pacific Staff Transportation Market Revenue (Million), by Ownership 2025 & 2033
- Figure 19: Asia Pacific Staff Transportation Market Revenue Share (%), by Ownership 2025 & 2033
- Figure 20: Asia Pacific Staff Transportation Market Revenue (Million), by Passenger Vehicle Type 2025 & 2033
- Figure 21: Asia Pacific Staff Transportation Market Revenue Share (%), by Passenger Vehicle Type 2025 & 2033
- Figure 22: Asia Pacific Staff Transportation Market Revenue (Million), by Service Type 2025 & 2033
- Figure 23: Asia Pacific Staff Transportation Market Revenue Share (%), by Service Type 2025 & 2033
- Figure 24: Asia Pacific Staff Transportation Market Revenue (Million), by Country 2025 & 2033
- Figure 25: Asia Pacific Staff Transportation Market Revenue Share (%), by Country 2025 & 2033
- Figure 26: South America Staff Transportation Market Revenue (Million), by Ownership 2025 & 2033
- Figure 27: South America Staff Transportation Market Revenue Share (%), by Ownership 2025 & 2033
- Figure 28: South America Staff Transportation Market Revenue (Million), by Passenger Vehicle Type 2025 & 2033
- Figure 29: South America Staff Transportation Market Revenue Share (%), by Passenger Vehicle Type 2025 & 2033
- Figure 30: South America Staff Transportation Market Revenue (Million), by Service Type 2025 & 2033
- Figure 31: South America Staff Transportation Market Revenue Share (%), by Service Type 2025 & 2033
- Figure 32: South America Staff Transportation Market Revenue (Million), by Country 2025 & 2033
- Figure 33: South America Staff Transportation Market Revenue Share (%), by Country 2025 & 2033
- Figure 34: Middle East and Africa Staff Transportation Market Revenue (Million), by Ownership 2025 & 2033
- Figure 35: Middle East and Africa Staff Transportation Market Revenue Share (%), by Ownership 2025 & 2033
- Figure 36: Middle East and Africa Staff Transportation Market Revenue (Million), by Passenger Vehicle Type 2025 & 2033
- Figure 37: Middle East and Africa Staff Transportation Market Revenue Share (%), by Passenger Vehicle Type 2025 & 2033
- Figure 38: Middle East and Africa Staff Transportation Market Revenue (Million), by Service Type 2025 & 2033
- Figure 39: Middle East and Africa Staff Transportation Market Revenue Share (%), by Service Type 2025 & 2033
- Figure 40: Middle East and Africa Staff Transportation Market Revenue (Million), by Country 2025 & 2033
- Figure 41: Middle East and Africa Staff Transportation Market Revenue Share (%), by Country 2025 & 2033
List of Tables
- Table 1: Global Staff Transportation Market Revenue Million Forecast, by Ownership 2020 & 2033
- Table 2: Global Staff Transportation Market Revenue Million Forecast, by Passenger Vehicle Type 2020 & 2033
- Table 3: Global Staff Transportation Market Revenue Million Forecast, by Service Type 2020 & 2033
- Table 4: Global Staff Transportation Market Revenue Million Forecast, by Region 2020 & 2033
- Table 5: Global Staff Transportation Market Revenue Million Forecast, by Ownership 2020 & 2033
- Table 6: Global Staff Transportation Market Revenue Million Forecast, by Passenger Vehicle Type 2020 & 2033
- Table 7: Global Staff Transportation Market Revenue Million Forecast, by Service Type 2020 & 2033
- Table 8: Global Staff Transportation Market Revenue Million Forecast, by Country 2020 & 2033
- Table 9: United States Staff Transportation Market Revenue (Million) Forecast, by Application 2020 & 2033
- Table 10: Canada Staff Transportation Market Revenue (Million) Forecast, by Application 2020 & 2033
- Table 11: Rest of North America Staff Transportation Market Revenue (Million) Forecast, by Application 2020 & 2033
- Table 12: Global Staff Transportation Market Revenue Million Forecast, by Ownership 2020 & 2033
- Table 13: Global Staff Transportation Market Revenue Million Forecast, by Passenger Vehicle Type 2020 & 2033
- Table 14: Global Staff Transportation Market Revenue Million Forecast, by Service Type 2020 & 2033
- Table 15: Global Staff Transportation Market Revenue Million Forecast, by Country 2020 & 2033
- Table 16: Germany Staff Transportation Market Revenue (Million) Forecast, by Application 2020 & 2033
- Table 17: United Kingdom Staff Transportation Market Revenue (Million) Forecast, by Application 2020 & 2033
- Table 18: France Staff Transportation Market Revenue (Million) Forecast, by Application 2020 & 2033
- Table 19: Rest of Europe Staff Transportation Market Revenue (Million) Forecast, by Application 2020 & 2033
- Table 20: Global Staff Transportation Market Revenue Million Forecast, by Ownership 2020 & 2033
- Table 21: Global Staff Transportation Market Revenue Million Forecast, by Passenger Vehicle Type 2020 & 2033
- Table 22: Global Staff Transportation Market Revenue Million Forecast, by Service Type 2020 & 2033
- Table 23: Global Staff Transportation Market Revenue Million Forecast, by Country 2020 & 2033
- Table 24: India Staff Transportation Market Revenue (Million) Forecast, by Application 2020 & 2033
- Table 25: China Staff Transportation Market Revenue (Million) Forecast, by Application 2020 & 2033
- Table 26: Japan Staff Transportation Market Revenue (Million) Forecast, by Application 2020 & 2033
- Table 27: Rest of Asia Pacific Staff Transportation Market Revenue (Million) Forecast, by Application 2020 & 2033
- Table 28: Global Staff Transportation Market Revenue Million Forecast, by Ownership 2020 & 2033
- Table 29: Global Staff Transportation Market Revenue Million Forecast, by Passenger Vehicle Type 2020 & 2033
- Table 30: Global Staff Transportation Market Revenue Million Forecast, by Service Type 2020 & 2033
- Table 31: Global Staff Transportation Market Revenue Million Forecast, by Country 2020 & 2033
- Table 32: Brazil Staff Transportation Market Revenue (Million) Forecast, by Application 2020 & 2033
- Table 33: Argentina Staff Transportation Market Revenue (Million) Forecast, by Application 2020 & 2033
- Table 34: Rest of the South America Staff Transportation Market Revenue (Million) Forecast, by Application 2020 & 2033
- Table 35: Global Staff Transportation Market Revenue Million Forecast, by Ownership 2020 & 2033
- Table 36: Global Staff Transportation Market Revenue Million Forecast, by Passenger Vehicle Type 2020 & 2033
- Table 37: Global Staff Transportation Market Revenue Million Forecast, by Service Type 2020 & 2033
- Table 38: Global Staff Transportation Market Revenue Million Forecast, by Country 2020 & 2033
- Table 39: United Arab Emirates Staff Transportation Market Revenue (Million) Forecast, by Application 2020 & 2033
- Table 40: Saudi Arabia Staff Transportation Market Revenue (Million) Forecast, by Application 2020 & 2033
- Table 41: Rest of the Middle East and Africa Staff Transportation Market Revenue (Million) Forecast, by Application 2020 & 2033
Frequently Asked Questions
1. What is the projected Compound Annual Growth Rate (CAGR) of the Staff Transportation Market?
The projected CAGR is approximately 5.34%.
2. Which companies are prominent players in the Staff Transportation Market?
Key companies in the market include Shuttl, Sun Telematic, Eco rent a car, Move-In-Sync, Transdev, Prairie Bus Line Limited, Janani Tours, Busbank (Global Charter Services Ltd ), First Class Tours.
3. What are the main segments of the Staff Transportation Market?
The market segments include Ownership, Passenger Vehicle Type, Service Type.
4. Can you provide details about the market size?
The market size is estimated to be USD 38.14 Million as of 2022.
5. What are some drivers contributing to market growth?
Stringent Emission Regulations are Fueling the Market Growth.
6. What are the notable trends driving market growth?
Increasing Internet Usage and Technological Advancements to Drive Demand in the Market.
7. Are there any restraints impacting market growth?
High Cost of Electric Commercial Vehicle May Hamper the Growth.
8. Can you provide examples of recent developments in the market?
June 2022: Switch Mobility, the electric vehicle division of Hinduja Group flagship Ashok Leyland, unveiled the EiV12 electric bus, aiming to capture a significant share of the electric vehicle market with a slew of customer-friendly features. The company intends to serve inter-city, and intra-city, staff transportation with this launch.
9. What pricing options are available for accessing the report?
Pricing options include single-user, multi-user, and enterprise licenses priced at USD 4750, USD 5250, and USD 8750 respectively.
10. Is the market size provided in terms of value or volume?
The market size is provided in terms of value, measured in Million.
11. Are there any specific market keywords associated with the report?
Yes, the market keyword associated with the report is "Staff Transportation Market," which aids in identifying and referencing the specific market segment covered.
12. How do I determine which pricing option suits my needs best?
The pricing options vary based on user requirements and access needs. Individual users may opt for single-user licenses, while businesses requiring broader access may choose multi-user or enterprise licenses for cost-effective access to the report.
13. Are there any additional resources or data provided in the Staff Transportation Market report?
While the report offers comprehensive insights, it's advisable to review the specific contents or supplementary materials provided to ascertain if additional resources or data are available.
14. How can I stay updated on further developments or reports in the Staff Transportation Market?
To stay informed about further developments, trends, and reports in the Staff Transportation Market, consider subscribing to industry newsletters, following relevant companies and organizations, or regularly checking reputable industry news sources and publications.
Methodology
Step 1 - Identification of Relevant Samples Size from Population Database


Step 2 - Approaches for Defining Global Market Size (Value, Volume* & Price*)

Note*: In applicable scenarios
Step 3 - Data Sources
Primary Research
- Web Analytics
- Survey Reports
- Research Institute
- Latest Research Reports
- Opinion Leaders
Secondary Research
- Annual Reports
- White Paper
- Latest Press Release
- Industry Association
- Paid Database
- Investor Presentations

Step 4 - Data Triangulation
Involves using different sources of information in order to increase the validity of a study
These sources are likely to be stakeholders in a program - participants, other researchers, program staff, other community members, and so on.
Then we put all data in single framework & apply various statistical tools to find out the dynamic on the market.
During the analysis stage, feedback from the stakeholder groups would be compared to determine areas of agreement as well as areas of divergence