

Key Insights
The global tamper-proof packaging market is poised for significant expansion, projected to reach USD 1.92 billion in 2025 with a robust CAGR of 6.85% during the forecast period of 2025-2033. This upward trajectory is primarily fueled by increasing consumer demand for product authenticity and safety across diverse industries. The pharmaceutical sector, a critical segment for tamper-proof solutions due to stringent regulatory requirements and the high value of its products, will continue to be a major driver. Similarly, the food and beverage industry is witnessing a surge in the adoption of these packaging solutions to combat counterfeiting and ensure food integrity, especially with the growing e-commerce penetration for grocery items. The cosmetics sector also contributes to this growth, driven by brand protection and consumer trust. Emerging economies, with their rapidly expanding consumer bases and increasing awareness of product safety, are also presenting substantial growth opportunities.
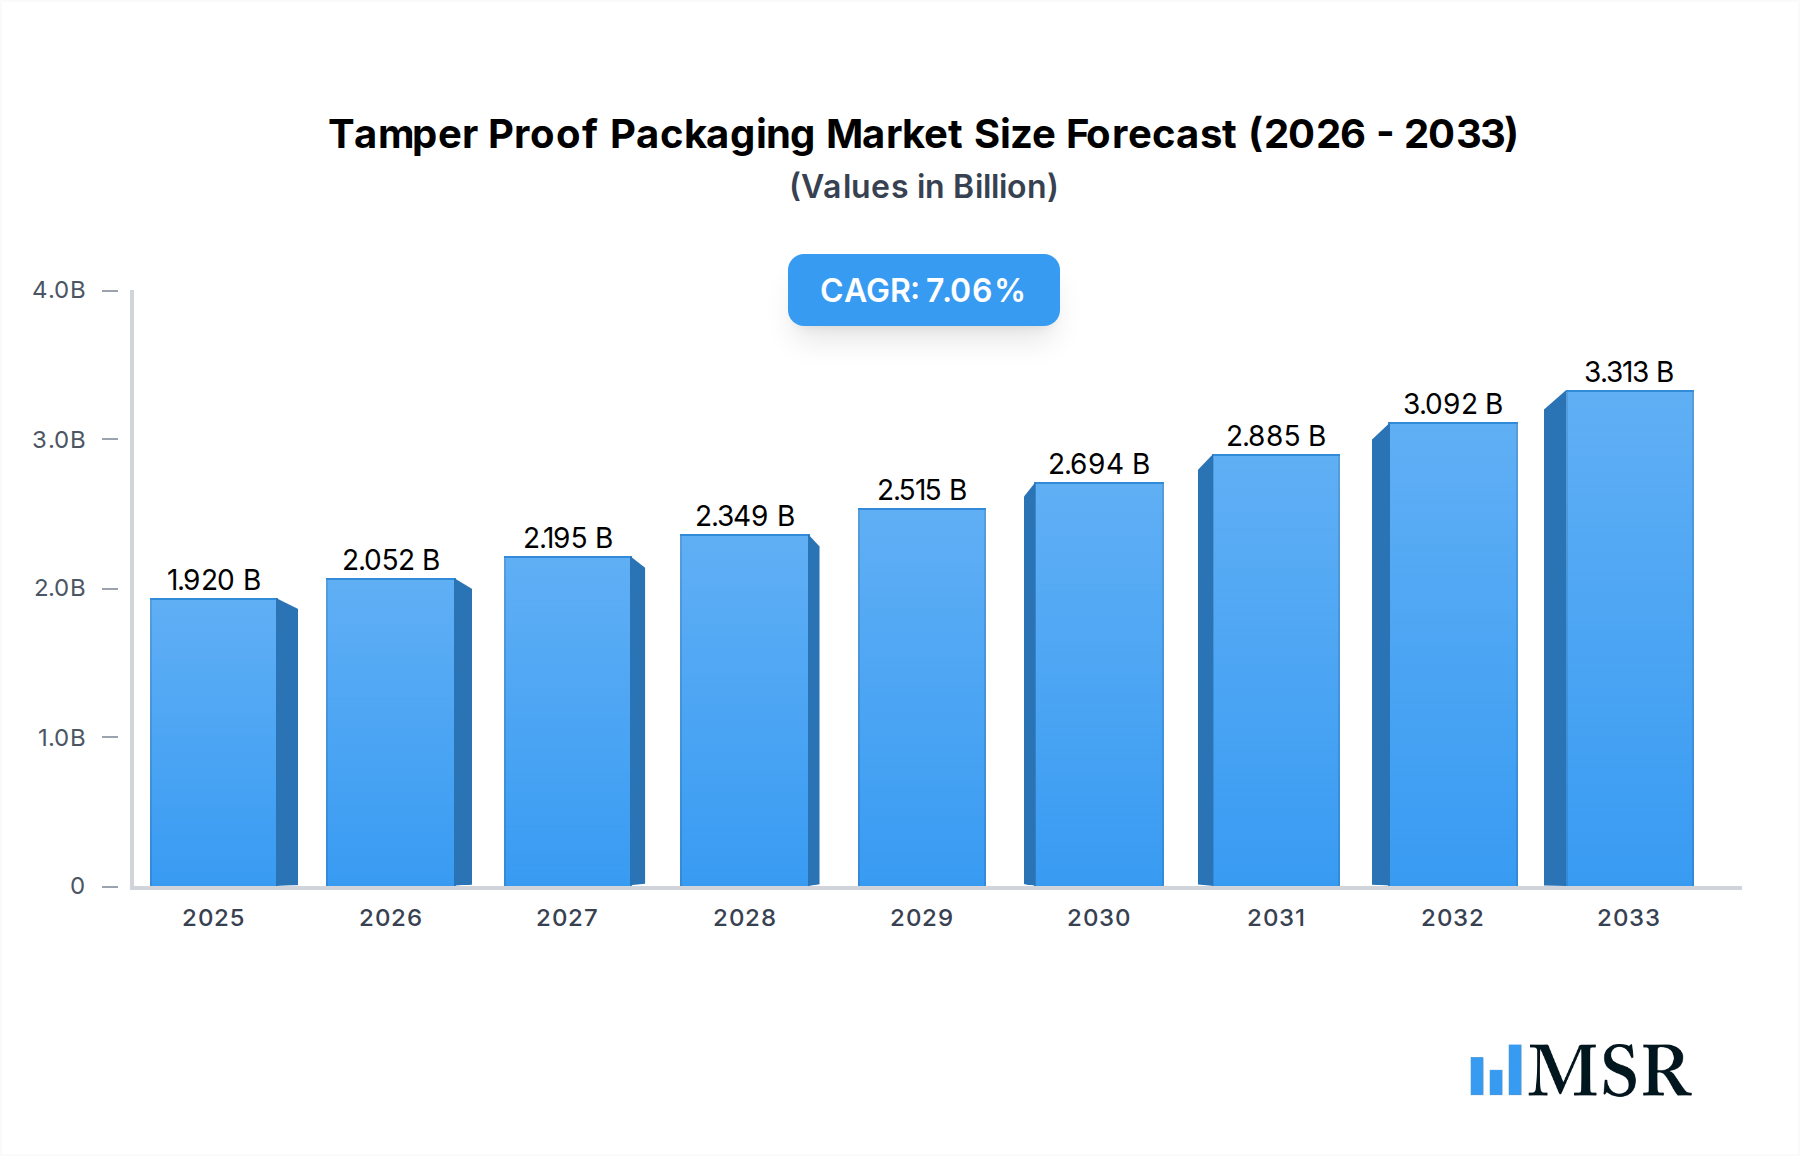
Tamper Proof Packaging Market Size (In Billion)
The market's growth is further supported by technological advancements in packaging materials and design, offering enhanced security features such as holographic seals, unique printing technologies, and smart packaging solutions that can indicate any breach. Innovations in plastics and glass packaging, incorporating sophisticated tamper-evident mechanisms, are gaining traction. However, challenges such as the initial cost of implementing advanced tamper-proof systems and the need for standardization across different regions could moderate the growth pace. Supply chain complexities and the fluctuating costs of raw materials also present potential restraints. Despite these, the overarching need for consumer confidence, regulatory compliance, and brand integrity will ensure a dynamic and expanding market for tamper-proof packaging.

Tamper Proof Packaging Company Market Share
Tamper Proof Packaging Market Report: Unlocking Security & Growth (2019-2033)
This comprehensive report delves into the dynamic Tamper Proof Packaging market, offering deep insights and actionable strategies for industry stakeholders. With a focus on the Pharmaceutical, Food and Beverages, and Cosmetics sectors, we analyze market trends, technological advancements, and emerging opportunities from 2019 through 2033. Our extensive research covers key players like AEP Industries, Graham Packaging Company, Amcor Limited, American Packaging Corporation, BALL CORPORATION, Bemis Company, CONTROLTEK, PolyOne, ProAmpac, PRINTPACK, Sealed Air, and Winpak. Discover critical data on market concentration, leading segments, product innovations, challenges, and growth drivers, all presented to maximize your strategic decision-making.
Tamper Proof Packaging Market Concentration & Dynamics
The Tamper Proof Packaging market exhibits a moderate level of concentration, with leading companies like Amcor Limited, Graham Packaging Company, and Sealed Air holding significant market share. The innovation ecosystem is robust, driven by continuous advancements in material science and security features. Regulatory frameworks, particularly in the pharmaceutical and food sectors, are a primary market influencer, mandating stringent security standards. Substitute products, such as traditional packaging with basic seals, pose a challenge but are increasingly being outperformed by advanced tamper-evident solutions. End-user trends highlight a growing demand for consumer confidence and product authenticity, particularly in the Food and Beverages and Cosmetics segments. Mergers and Acquisitions (M&A) activity is on the rise, indicating strategic consolidation. For instance, recent M&A deal counts indicate a growing trend of larger entities acquiring specialized tamper-proof packaging manufacturers to enhance their product portfolios and market reach. The market share distribution is constantly evolving, with established players expanding their capabilities and new entrants focusing on niche technologies. This dynamic landscape necessitates a keen understanding of competitive strategies and market evolution.
Tamper Proof Packaging Industry Insights & Trends
The Tamper Proof Packaging industry is experiencing robust growth, projected to reach an estimated market size of $XX billion by 2025 and expand significantly throughout the forecast period of 2025–2033. This impressive Compound Annual Growth Rate (CAGR) is fueled by a confluence of factors. Firstly, the escalating demand for product safety and authenticity across various sectors, especially Pharmaceutical and Food and Beverages, is a paramount driver. Consumers and regulatory bodies are increasingly prioritizing packaging that provides irrefutable evidence of tampering, thereby safeguarding against counterfeiting, adulteration, and pilferage. Technological disruptions are playing a pivotal role in shaping the market. Innovations such as advanced holographic seals, intelligent packaging with embedded sensors, RFID-enabled tamper-evident labels, and novel material formulations are enhancing security features and offering greater traceability. These advancements not only improve security but also contribute to brand protection and consumer trust. Evolving consumer behaviors are also a key influencer. A heightened awareness of product integrity and a growing concern for health and safety are prompting consumers to actively seek out products with visible tamper-proof seals. This consumer preference is compelling manufacturers across all segments, including Cosmetics, to adopt more sophisticated tamper-evident packaging solutions. Furthermore, the increasing complexity of global supply chains and the rise of e-commerce necessitate robust packaging solutions that can withstand the rigors of transit and ensure product integrity upon arrival. The report analyzes these trends in detail, providing market participants with a strategic roadmap to capitalize on the expanding opportunities within this critical industry. The historical period from 2019–2024 has laid the groundwork for this projected growth, characterized by increasing adoption of tamper-evident technologies.
Key Markets & Segments Leading Tamper Proof Packaging
The Pharmaceutical segment emerges as a dominant force in the Tamper Proof Packaging market, primarily driven by stringent regulatory mandates and the critical need for patient safety. The economic growth in emerging economies also contributes significantly to the overall market expansion. The robust infrastructure development in these regions further supports the efficient distribution and adoption of advanced packaging solutions.
- Dominant Region: North America and Europe currently lead the Tamper Proof Packaging market, owing to established regulatory frameworks and high consumer awareness regarding product safety. The increasing prevalence of chronic diseases in these regions also fuels the demand for secure pharmaceutical packaging.
- Dominant Application: Pharmaceutical: The pharmaceutical industry's non-negotiable requirement for product integrity, coupled with severe penalties for counterfeiting and diversion, makes it the largest consumer of tamper-proof packaging. This includes vials, blister packs, bottles, and syringe packaging, all requiring advanced tamper-evident features.
- Dominant Type: Plastics: Plastic-based tamper-proof packaging, including various polymers and films, dominates the market due to its versatility, cost-effectiveness, and ability to be molded into complex shapes with integrated security features. Examples include shrink bands, induction seals, and tamper-evident caps.
- Key Drivers in Pharmaceutical:
- Stringent Regulations: FDA, EMA, and other global health authorities enforce strict guidelines on pharmaceutical packaging integrity.
- Counterfeit Drug Epidemic: The global fight against counterfeit medicines directly propels the demand for secure packaging.
- Brand Protection: Pharmaceutical companies invest heavily in tamper-proof solutions to safeguard their brand reputation.
- Patient Safety: Ensuring that medication has not been compromised is paramount for patient well-being.
- Dominance Analysis for Food and Beverages: The Food and Beverages sector is a rapidly growing segment, driven by consumer demand for safe and authentic products, particularly in the fresh produce, dairy, and ready-to-eat meal categories. The rise of e-commerce for food products also necessitates enhanced tamper-proofing to ensure product integrity during transit.
- Dominance Analysis for Cosmetics: The Cosmetics industry is witnessing a significant surge in tamper-proof packaging adoption, driven by the high value of products and the prevalence of counterfeit goods. Consumers are increasingly looking for assurances that their beauty products have not been tampered with, leading to a demand for sophisticated tamper-evident seals and closures.
- Other Segments: While Pharmaceutical, Food and Beverages, and Cosmetics lead, the "Others" category, encompassing electronics, chemicals, and industrial goods, also presents growing opportunities as these industries recognize the value of tamper-evident packaging for product security and liability reduction.
Tamper Proof Packaging Product Developments
Recent product innovations in Tamper Proof Packaging are revolutionizing security and consumer trust. Key advancements include the development of advanced holographic films that are extremely difficult to replicate, offering superior anti-counterfeiting capabilities. Intelligent packaging solutions incorporating RFID tags and NFC technology are enabling real-time tracking and authenticity verification throughout the supply chain. Furthermore, new biodegradable and sustainable tamper-evident materials are gaining traction, addressing growing environmental concerns without compromising on security. These innovations are not only enhancing product integrity but also providing valuable brand protection and improved supply chain management for industries such as Pharmaceutical, Food and Beverages, and Cosmetics.
Challenges in the Tamper Proof Packaging Market
Despite robust growth, the Tamper Proof Packaging market faces several challenges. Regulatory hurdles can sometimes be complex and vary significantly across different regions, requiring continuous adaptation by manufacturers. Supply chain disruptions, as witnessed in recent years, can impact the availability and cost of raw materials, affecting production timelines and pricing. Competitive pressures from both established players and emerging niche manufacturers also necessitate constant innovation and cost optimization. The initial investment in advanced tamper-proof technologies can also be a barrier for smaller enterprises, limiting widespread adoption.
Forces Driving Tamper Proof Packaging Growth
The growth of the Tamper Proof Packaging market is propelled by several key forces. Technologically, advancements in security printing, material science, and the integration of smart technologies are creating more sophisticated and cost-effective solutions. Economically, the increasing value of goods in sectors like pharmaceuticals and luxury cosmetics makes robust tamper-proofing an essential investment to mitigate significant financial losses from counterfeiting and theft. Regulatory factors, particularly the global push for enhanced product safety and consumer protection, continue to mandate stricter packaging requirements. The growing global trade and complex supply chains also necessitate packaging that can maintain product integrity from origin to consumer.
Challenges in the Tamper Proof Packaging Market
Long-term growth catalysts for the Tamper Proof Packaging market are intrinsically linked to continuous innovation and strategic market expansion. The development of cost-effective, high-security solutions that are also environmentally sustainable will be crucial. Partnerships between packaging manufacturers and technology providers will foster the integration of cutting-edge features like advanced track-and-trace capabilities. Furthermore, expanding into emerging markets where regulatory oversight is strengthening and consumer awareness of product safety is rising will unlock significant future growth potential.
Emerging Opportunities in Tamper Proof Packaging
Emerging opportunities in Tamper Proof Packaging are ripe for exploitation. The increasing demand for personalized and secure packaging in direct-to-consumer e-commerce presents a significant avenue for growth. The development of advanced tamper-evident solutions for high-value electronics and industrial components is another area with untapped potential. Furthermore, consumer preferences for sustainable packaging are creating opportunities for manufacturers to innovate with eco-friendly tamper-proof materials. The integration of blockchain technology for enhanced supply chain transparency and product authentication is also poised to transform the market.
Leading Players in the Tamper Proof Packaging Sector
- AEP Industries
- Graham Packaging Company
- Amcor Limited
- American Packaging Corporation
- BALL CORPORATION
- Bemis Company
- CONTROLTEK
- PolyOne
- ProAmpac
- PRINTPACK
- Sealed Air
- Winpak
Key Milestones in Tamper Proof Packaging Industry
- 2019: Increased adoption of RFID-enabled tamper-evident seals for high-value goods.
- 2020: Introduction of advanced holographic films with enhanced security features for pharmaceutical packaging.
- 2021: Rise of sustainable tamper-evident packaging solutions driven by environmental concerns.
- 2022: Significant increase in M&A activity as larger companies acquire specialized tamper-proof packaging firms.
- 2023: Growing integration of NFC technology for consumer-facing product authentication.
- 2024: Enhanced focus on blockchain integration for supply chain traceability in tamper-proof packaging.
- 2025: Projected significant market growth driven by pharmaceutical and food & beverage sector demand.
- 2026-2033: Continued innovation in smart packaging and sustainable materials anticipated.
Strategic Outlook for Tamper Proof Packaging Market
The strategic outlook for the Tamper Proof Packaging market is exceptionally positive, characterized by consistent growth accelerators. The increasing global emphasis on product safety and the pervasive threat of counterfeiting will continue to drive demand across all key application sectors. Strategic investments in research and development for advanced security features, smart packaging integration, and sustainable material innovations will be crucial for market leaders. Furthermore, expanding reach into emerging economies with developing regulatory frameworks and growing consumer demand for authenticity will unlock substantial future potential. Collaborations with technology providers and a focus on providing end-to-end security solutions will position companies for sustained success.
Tamper Proof Packaging Segmentation
-
1. Application
- 1.1. Pharmaceutical
- 1.2. Food And Beverages
- 1.3. Cosmetics
- 1.4. Others
-
2. Types
- 2.1. Plastics
- 2.2. Glass
- 2.3. Metal
- 2.4. Others
Tamper Proof Packaging Segmentation By Geography
-
1. North America
- 1.1. United States
- 1.2. Canada
- 1.3. Mexico
-
2. South America
- 2.1. Brazil
- 2.2. Argentina
- 2.3. Rest of South America
-
3. Europe
- 3.1. United Kingdom
- 3.2. Germany
- 3.3. France
- 3.4. Italy
- 3.5. Spain
- 3.6. Russia
- 3.7. Benelux
- 3.8. Nordics
- 3.9. Rest of Europe
-
4. Middle East & Africa
- 4.1. Turkey
- 4.2. Israel
- 4.3. GCC
- 4.4. North Africa
- 4.5. South Africa
- 4.6. Rest of Middle East & Africa
-
5. Asia Pacific
- 5.1. China
- 5.2. India
- 5.3. Japan
- 5.4. South Korea
- 5.5. ASEAN
- 5.6. Oceania
- 5.7. Rest of Asia Pacific
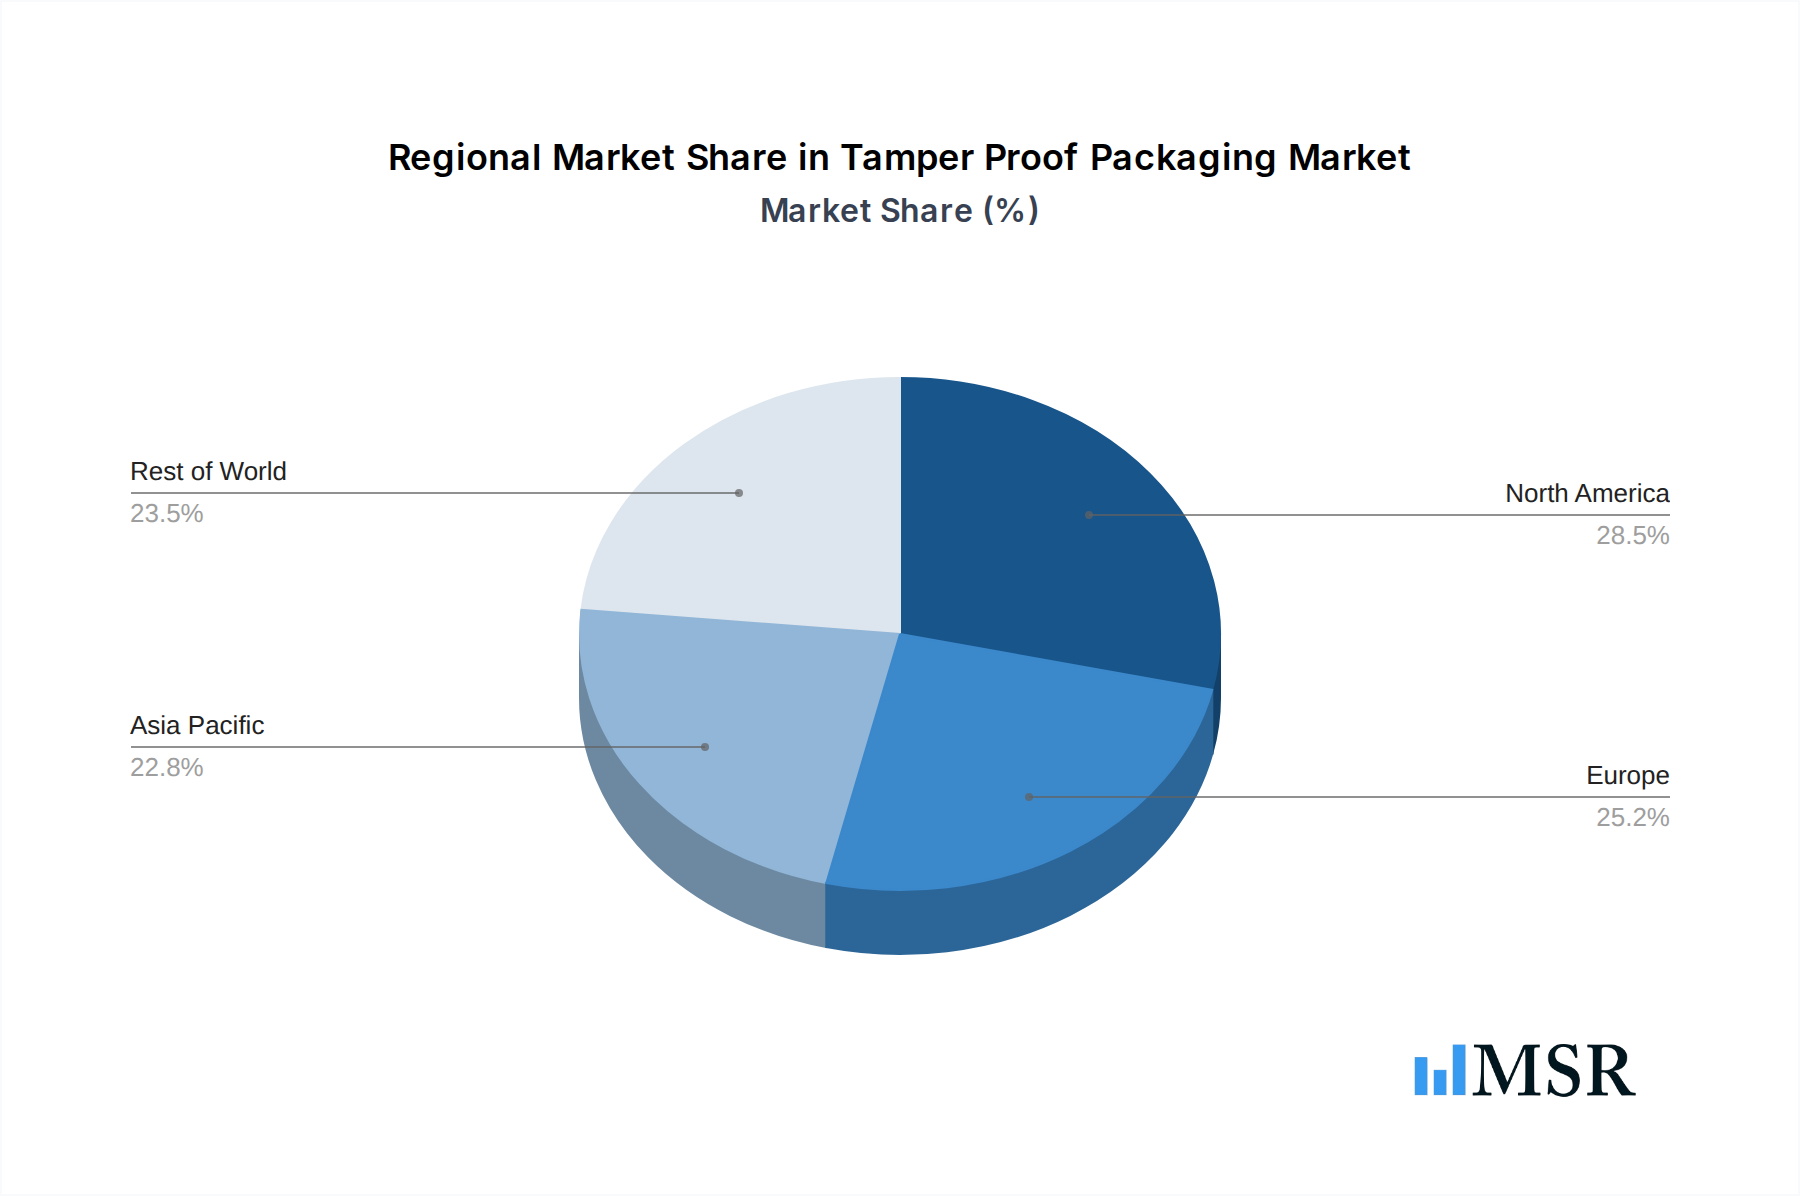
Tamper Proof Packaging Regional Market Share
Geographic Coverage of Tamper Proof Packaging
Tamper Proof Packaging REPORT HIGHLIGHTS
| Aspects | Details |
|---|---|
| Study Period | 2020-2034 |
| Base Year | 2025 |
| Estimated Year | 2026 |
| Forecast Period | 2026-2034 |
| Historical Period | 2020-2025 |
| Growth Rate | CAGR of 6.85% from 2020-2034 |
| Segmentation |
|
Table of Contents
- 1. Introduction
- 1.1. Research Scope
- 1.2. Market Segmentation
- 1.3. Research Methodology
- 1.4. Definitions and Assumptions
- 2. Executive Summary
- 2.1. Introduction
- 3. Market Dynamics
- 3.1. Introduction
- 3.2. Market Drivers
- 3.3. Market Restrains
- 3.4. Market Trends
- 4. Market Factor Analysis
- 4.1. Porters Five Forces
- 4.2. Supply/Value Chain
- 4.3. PESTEL analysis
- 4.4. Market Entropy
- 4.5. Patent/Trademark Analysis
- 5. Global Tamper Proof Packaging Analysis, Insights and Forecast, 2020-2032
- 5.1. Market Analysis, Insights and Forecast - by Application
- 5.1.1. Pharmaceutical
- 5.1.2. Food And Beverages
- 5.1.3. Cosmetics
- 5.1.4. Others
- 5.2. Market Analysis, Insights and Forecast - by Types
- 5.2.1. Plastics
- 5.2.2. Glass
- 5.2.3. Metal
- 5.2.4. Others
- 5.3. Market Analysis, Insights and Forecast - by Region
- 5.3.1. North America
- 5.3.2. South America
- 5.3.3. Europe
- 5.3.4. Middle East & Africa
- 5.3.5. Asia Pacific
- 5.1. Market Analysis, Insights and Forecast - by Application
- 6. North America Tamper Proof Packaging Analysis, Insights and Forecast, 2020-2032
- 6.1. Market Analysis, Insights and Forecast - by Application
- 6.1.1. Pharmaceutical
- 6.1.2. Food And Beverages
- 6.1.3. Cosmetics
- 6.1.4. Others
- 6.2. Market Analysis, Insights and Forecast - by Types
- 6.2.1. Plastics
- 6.2.2. Glass
- 6.2.3. Metal
- 6.2.4. Others
- 6.1. Market Analysis, Insights and Forecast - by Application
- 7. South America Tamper Proof Packaging Analysis, Insights and Forecast, 2020-2032
- 7.1. Market Analysis, Insights and Forecast - by Application
- 7.1.1. Pharmaceutical
- 7.1.2. Food And Beverages
- 7.1.3. Cosmetics
- 7.1.4. Others
- 7.2. Market Analysis, Insights and Forecast - by Types
- 7.2.1. Plastics
- 7.2.2. Glass
- 7.2.3. Metal
- 7.2.4. Others
- 7.1. Market Analysis, Insights and Forecast - by Application
- 8. Europe Tamper Proof Packaging Analysis, Insights and Forecast, 2020-2032
- 8.1. Market Analysis, Insights and Forecast - by Application
- 8.1.1. Pharmaceutical
- 8.1.2. Food And Beverages
- 8.1.3. Cosmetics
- 8.1.4. Others
- 8.2. Market Analysis, Insights and Forecast - by Types
- 8.2.1. Plastics
- 8.2.2. Glass
- 8.2.3. Metal
- 8.2.4. Others
- 8.1. Market Analysis, Insights and Forecast - by Application
- 9. Middle East & Africa Tamper Proof Packaging Analysis, Insights and Forecast, 2020-2032
- 9.1. Market Analysis, Insights and Forecast - by Application
- 9.1.1. Pharmaceutical
- 9.1.2. Food And Beverages
- 9.1.3. Cosmetics
- 9.1.4. Others
- 9.2. Market Analysis, Insights and Forecast - by Types
- 9.2.1. Plastics
- 9.2.2. Glass
- 9.2.3. Metal
- 9.2.4. Others
- 9.1. Market Analysis, Insights and Forecast - by Application
- 10. Asia Pacific Tamper Proof Packaging Analysis, Insights and Forecast, 2020-2032
- 10.1. Market Analysis, Insights and Forecast - by Application
- 10.1.1. Pharmaceutical
- 10.1.2. Food And Beverages
- 10.1.3. Cosmetics
- 10.1.4. Others
- 10.2. Market Analysis, Insights and Forecast - by Types
- 10.2.1. Plastics
- 10.2.2. Glass
- 10.2.3. Metal
- 10.2.4. Others
- 10.1. Market Analysis, Insights and Forecast - by Application
- 11. Competitive Analysis
- 11.1. Global Market Share Analysis 2025
- 11.2. Company Profiles
- 11.2.1 AEP Industries
- 11.2.1.1. Overview
- 11.2.1.2. Products
- 11.2.1.3. SWOT Analysis
- 11.2.1.4. Recent Developments
- 11.2.1.5. Financials (Based on Availability)
- 11.2.2 Graham Packaging Company
- 11.2.2.1. Overview
- 11.2.2.2. Products
- 11.2.2.3. SWOT Analysis
- 11.2.2.4. Recent Developments
- 11.2.2.5. Financials (Based on Availability)
- 11.2.3 Amcor Limited
- 11.2.3.1. Overview
- 11.2.3.2. Products
- 11.2.3.3. SWOT Analysis
- 11.2.3.4. Recent Developments
- 11.2.3.5. Financials (Based on Availability)
- 11.2.4 American Packaging Corporation
- 11.2.4.1. Overview
- 11.2.4.2. Products
- 11.2.4.3. SWOT Analysis
- 11.2.4.4. Recent Developments
- 11.2.4.5. Financials (Based on Availability)
- 11.2.5 BALL CORPORATION
- 11.2.5.1. Overview
- 11.2.5.2. Products
- 11.2.5.3. SWOT Analysis
- 11.2.5.4. Recent Developments
- 11.2.5.5. Financials (Based on Availability)
- 11.2.6 Bemis Company
- 11.2.6.1. Overview
- 11.2.6.2. Products
- 11.2.6.3. SWOT Analysis
- 11.2.6.4. Recent Developments
- 11.2.6.5. Financials (Based on Availability)
- 11.2.7 CONTROLTEK
- 11.2.7.1. Overview
- 11.2.7.2. Products
- 11.2.7.3. SWOT Analysis
- 11.2.7.4. Recent Developments
- 11.2.7.5. Financials (Based on Availability)
- 11.2.8 PolyOne
- 11.2.8.1. Overview
- 11.2.8.2. Products
- 11.2.8.3. SWOT Analysis
- 11.2.8.4. Recent Developments
- 11.2.8.5. Financials (Based on Availability)
- 11.2.9 ProAmpac
- 11.2.9.1. Overview
- 11.2.9.2. Products
- 11.2.9.3. SWOT Analysis
- 11.2.9.4. Recent Developments
- 11.2.9.5. Financials (Based on Availability)
- 11.2.10 PRINTPACK
- 11.2.10.1. Overview
- 11.2.10.2. Products
- 11.2.10.3. SWOT Analysis
- 11.2.10.4. Recent Developments
- 11.2.10.5. Financials (Based on Availability)
- 11.2.11 Sealed Air
- 11.2.11.1. Overview
- 11.2.11.2. Products
- 11.2.11.3. SWOT Analysis
- 11.2.11.4. Recent Developments
- 11.2.11.5. Financials (Based on Availability)
- 11.2.12 Winpak
- 11.2.12.1. Overview
- 11.2.12.2. Products
- 11.2.12.3. SWOT Analysis
- 11.2.12.4. Recent Developments
- 11.2.12.5. Financials (Based on Availability)
- 11.2.1 AEP Industries
List of Figures
- Figure 1: Global Tamper Proof Packaging Revenue Breakdown (undefined, %) by Region 2025 & 2033
- Figure 2: Global Tamper Proof Packaging Volume Breakdown (K, %) by Region 2025 & 2033
- Figure 3: North America Tamper Proof Packaging Revenue (undefined), by Application 2025 & 2033
- Figure 4: North America Tamper Proof Packaging Volume (K), by Application 2025 & 2033
- Figure 5: North America Tamper Proof Packaging Revenue Share (%), by Application 2025 & 2033
- Figure 6: North America Tamper Proof Packaging Volume Share (%), by Application 2025 & 2033
- Figure 7: North America Tamper Proof Packaging Revenue (undefined), by Types 2025 & 2033
- Figure 8: North America Tamper Proof Packaging Volume (K), by Types 2025 & 2033
- Figure 9: North America Tamper Proof Packaging Revenue Share (%), by Types 2025 & 2033
- Figure 10: North America Tamper Proof Packaging Volume Share (%), by Types 2025 & 2033
- Figure 11: North America Tamper Proof Packaging Revenue (undefined), by Country 2025 & 2033
- Figure 12: North America Tamper Proof Packaging Volume (K), by Country 2025 & 2033
- Figure 13: North America Tamper Proof Packaging Revenue Share (%), by Country 2025 & 2033
- Figure 14: North America Tamper Proof Packaging Volume Share (%), by Country 2025 & 2033
- Figure 15: South America Tamper Proof Packaging Revenue (undefined), by Application 2025 & 2033
- Figure 16: South America Tamper Proof Packaging Volume (K), by Application 2025 & 2033
- Figure 17: South America Tamper Proof Packaging Revenue Share (%), by Application 2025 & 2033
- Figure 18: South America Tamper Proof Packaging Volume Share (%), by Application 2025 & 2033
- Figure 19: South America Tamper Proof Packaging Revenue (undefined), by Types 2025 & 2033
- Figure 20: South America Tamper Proof Packaging Volume (K), by Types 2025 & 2033
- Figure 21: South America Tamper Proof Packaging Revenue Share (%), by Types 2025 & 2033
- Figure 22: South America Tamper Proof Packaging Volume Share (%), by Types 2025 & 2033
- Figure 23: South America Tamper Proof Packaging Revenue (undefined), by Country 2025 & 2033
- Figure 24: South America Tamper Proof Packaging Volume (K), by Country 2025 & 2033
- Figure 25: South America Tamper Proof Packaging Revenue Share (%), by Country 2025 & 2033
- Figure 26: South America Tamper Proof Packaging Volume Share (%), by Country 2025 & 2033
- Figure 27: Europe Tamper Proof Packaging Revenue (undefined), by Application 2025 & 2033
- Figure 28: Europe Tamper Proof Packaging Volume (K), by Application 2025 & 2033
- Figure 29: Europe Tamper Proof Packaging Revenue Share (%), by Application 2025 & 2033
- Figure 30: Europe Tamper Proof Packaging Volume Share (%), by Application 2025 & 2033
- Figure 31: Europe Tamper Proof Packaging Revenue (undefined), by Types 2025 & 2033
- Figure 32: Europe Tamper Proof Packaging Volume (K), by Types 2025 & 2033
- Figure 33: Europe Tamper Proof Packaging Revenue Share (%), by Types 2025 & 2033
- Figure 34: Europe Tamper Proof Packaging Volume Share (%), by Types 2025 & 2033
- Figure 35: Europe Tamper Proof Packaging Revenue (undefined), by Country 2025 & 2033
- Figure 36: Europe Tamper Proof Packaging Volume (K), by Country 2025 & 2033
- Figure 37: Europe Tamper Proof Packaging Revenue Share (%), by Country 2025 & 2033
- Figure 38: Europe Tamper Proof Packaging Volume Share (%), by Country 2025 & 2033
- Figure 39: Middle East & Africa Tamper Proof Packaging Revenue (undefined), by Application 2025 & 2033
- Figure 40: Middle East & Africa Tamper Proof Packaging Volume (K), by Application 2025 & 2033
- Figure 41: Middle East & Africa Tamper Proof Packaging Revenue Share (%), by Application 2025 & 2033
- Figure 42: Middle East & Africa Tamper Proof Packaging Volume Share (%), by Application 2025 & 2033
- Figure 43: Middle East & Africa Tamper Proof Packaging Revenue (undefined), by Types 2025 & 2033
- Figure 44: Middle East & Africa Tamper Proof Packaging Volume (K), by Types 2025 & 2033
- Figure 45: Middle East & Africa Tamper Proof Packaging Revenue Share (%), by Types 2025 & 2033
- Figure 46: Middle East & Africa Tamper Proof Packaging Volume Share (%), by Types 2025 & 2033
- Figure 47: Middle East & Africa Tamper Proof Packaging Revenue (undefined), by Country 2025 & 2033
- Figure 48: Middle East & Africa Tamper Proof Packaging Volume (K), by Country 2025 & 2033
- Figure 49: Middle East & Africa Tamper Proof Packaging Revenue Share (%), by Country 2025 & 2033
- Figure 50: Middle East & Africa Tamper Proof Packaging Volume Share (%), by Country 2025 & 2033
- Figure 51: Asia Pacific Tamper Proof Packaging Revenue (undefined), by Application 2025 & 2033
- Figure 52: Asia Pacific Tamper Proof Packaging Volume (K), by Application 2025 & 2033
- Figure 53: Asia Pacific Tamper Proof Packaging Revenue Share (%), by Application 2025 & 2033
- Figure 54: Asia Pacific Tamper Proof Packaging Volume Share (%), by Application 2025 & 2033
- Figure 55: Asia Pacific Tamper Proof Packaging Revenue (undefined), by Types 2025 & 2033
- Figure 56: Asia Pacific Tamper Proof Packaging Volume (K), by Types 2025 & 2033
- Figure 57: Asia Pacific Tamper Proof Packaging Revenue Share (%), by Types 2025 & 2033
- Figure 58: Asia Pacific Tamper Proof Packaging Volume Share (%), by Types 2025 & 2033
- Figure 59: Asia Pacific Tamper Proof Packaging Revenue (undefined), by Country 2025 & 2033
- Figure 60: Asia Pacific Tamper Proof Packaging Volume (K), by Country 2025 & 2033
- Figure 61: Asia Pacific Tamper Proof Packaging Revenue Share (%), by Country 2025 & 2033
- Figure 62: Asia Pacific Tamper Proof Packaging Volume Share (%), by Country 2025 & 2033
List of Tables
- Table 1: Global Tamper Proof Packaging Revenue undefined Forecast, by Application 2020 & 2033
- Table 2: Global Tamper Proof Packaging Volume K Forecast, by Application 2020 & 2033
- Table 3: Global Tamper Proof Packaging Revenue undefined Forecast, by Types 2020 & 2033
- Table 4: Global Tamper Proof Packaging Volume K Forecast, by Types 2020 & 2033
- Table 5: Global Tamper Proof Packaging Revenue undefined Forecast, by Region 2020 & 2033
- Table 6: Global Tamper Proof Packaging Volume K Forecast, by Region 2020 & 2033
- Table 7: Global Tamper Proof Packaging Revenue undefined Forecast, by Application 2020 & 2033
- Table 8: Global Tamper Proof Packaging Volume K Forecast, by Application 2020 & 2033
- Table 9: Global Tamper Proof Packaging Revenue undefined Forecast, by Types 2020 & 2033
- Table 10: Global Tamper Proof Packaging Volume K Forecast, by Types 2020 & 2033
- Table 11: Global Tamper Proof Packaging Revenue undefined Forecast, by Country 2020 & 2033
- Table 12: Global Tamper Proof Packaging Volume K Forecast, by Country 2020 & 2033
- Table 13: United States Tamper Proof Packaging Revenue (undefined) Forecast, by Application 2020 & 2033
- Table 14: United States Tamper Proof Packaging Volume (K) Forecast, by Application 2020 & 2033
- Table 15: Canada Tamper Proof Packaging Revenue (undefined) Forecast, by Application 2020 & 2033
- Table 16: Canada Tamper Proof Packaging Volume (K) Forecast, by Application 2020 & 2033
- Table 17: Mexico Tamper Proof Packaging Revenue (undefined) Forecast, by Application 2020 & 2033
- Table 18: Mexico Tamper Proof Packaging Volume (K) Forecast, by Application 2020 & 2033
- Table 19: Global Tamper Proof Packaging Revenue undefined Forecast, by Application 2020 & 2033
- Table 20: Global Tamper Proof Packaging Volume K Forecast, by Application 2020 & 2033
- Table 21: Global Tamper Proof Packaging Revenue undefined Forecast, by Types 2020 & 2033
- Table 22: Global Tamper Proof Packaging Volume K Forecast, by Types 2020 & 2033
- Table 23: Global Tamper Proof Packaging Revenue undefined Forecast, by Country 2020 & 2033
- Table 24: Global Tamper Proof Packaging Volume K Forecast, by Country 2020 & 2033
- Table 25: Brazil Tamper Proof Packaging Revenue (undefined) Forecast, by Application 2020 & 2033
- Table 26: Brazil Tamper Proof Packaging Volume (K) Forecast, by Application 2020 & 2033
- Table 27: Argentina Tamper Proof Packaging Revenue (undefined) Forecast, by Application 2020 & 2033
- Table 28: Argentina Tamper Proof Packaging Volume (K) Forecast, by Application 2020 & 2033
- Table 29: Rest of South America Tamper Proof Packaging Revenue (undefined) Forecast, by Application 2020 & 2033
- Table 30: Rest of South America Tamper Proof Packaging Volume (K) Forecast, by Application 2020 & 2033
- Table 31: Global Tamper Proof Packaging Revenue undefined Forecast, by Application 2020 & 2033
- Table 32: Global Tamper Proof Packaging Volume K Forecast, by Application 2020 & 2033
- Table 33: Global Tamper Proof Packaging Revenue undefined Forecast, by Types 2020 & 2033
- Table 34: Global Tamper Proof Packaging Volume K Forecast, by Types 2020 & 2033
- Table 35: Global Tamper Proof Packaging Revenue undefined Forecast, by Country 2020 & 2033
- Table 36: Global Tamper Proof Packaging Volume K Forecast, by Country 2020 & 2033
- Table 37: United Kingdom Tamper Proof Packaging Revenue (undefined) Forecast, by Application 2020 & 2033
- Table 38: United Kingdom Tamper Proof Packaging Volume (K) Forecast, by Application 2020 & 2033
- Table 39: Germany Tamper Proof Packaging Revenue (undefined) Forecast, by Application 2020 & 2033
- Table 40: Germany Tamper Proof Packaging Volume (K) Forecast, by Application 2020 & 2033
- Table 41: France Tamper Proof Packaging Revenue (undefined) Forecast, by Application 2020 & 2033
- Table 42: France Tamper Proof Packaging Volume (K) Forecast, by Application 2020 & 2033
- Table 43: Italy Tamper Proof Packaging Revenue (undefined) Forecast, by Application 2020 & 2033
- Table 44: Italy Tamper Proof Packaging Volume (K) Forecast, by Application 2020 & 2033
- Table 45: Spain Tamper Proof Packaging Revenue (undefined) Forecast, by Application 2020 & 2033
- Table 46: Spain Tamper Proof Packaging Volume (K) Forecast, by Application 2020 & 2033
- Table 47: Russia Tamper Proof Packaging Revenue (undefined) Forecast, by Application 2020 & 2033
- Table 48: Russia Tamper Proof Packaging Volume (K) Forecast, by Application 2020 & 2033
- Table 49: Benelux Tamper Proof Packaging Revenue (undefined) Forecast, by Application 2020 & 2033
- Table 50: Benelux Tamper Proof Packaging Volume (K) Forecast, by Application 2020 & 2033
- Table 51: Nordics Tamper Proof Packaging Revenue (undefined) Forecast, by Application 2020 & 2033
- Table 52: Nordics Tamper Proof Packaging Volume (K) Forecast, by Application 2020 & 2033
- Table 53: Rest of Europe Tamper Proof Packaging Revenue (undefined) Forecast, by Application 2020 & 2033
- Table 54: Rest of Europe Tamper Proof Packaging Volume (K) Forecast, by Application 2020 & 2033
- Table 55: Global Tamper Proof Packaging Revenue undefined Forecast, by Application 2020 & 2033
- Table 56: Global Tamper Proof Packaging Volume K Forecast, by Application 2020 & 2033
- Table 57: Global Tamper Proof Packaging Revenue undefined Forecast, by Types 2020 & 2033
- Table 58: Global Tamper Proof Packaging Volume K Forecast, by Types 2020 & 2033
- Table 59: Global Tamper Proof Packaging Revenue undefined Forecast, by Country 2020 & 2033
- Table 60: Global Tamper Proof Packaging Volume K Forecast, by Country 2020 & 2033
- Table 61: Turkey Tamper Proof Packaging Revenue (undefined) Forecast, by Application 2020 & 2033
- Table 62: Turkey Tamper Proof Packaging Volume (K) Forecast, by Application 2020 & 2033
- Table 63: Israel Tamper Proof Packaging Revenue (undefined) Forecast, by Application 2020 & 2033
- Table 64: Israel Tamper Proof Packaging Volume (K) Forecast, by Application 2020 & 2033
- Table 65: GCC Tamper Proof Packaging Revenue (undefined) Forecast, by Application 2020 & 2033
- Table 66: GCC Tamper Proof Packaging Volume (K) Forecast, by Application 2020 & 2033
- Table 67: North Africa Tamper Proof Packaging Revenue (undefined) Forecast, by Application 2020 & 2033
- Table 68: North Africa Tamper Proof Packaging Volume (K) Forecast, by Application 2020 & 2033
- Table 69: South Africa Tamper Proof Packaging Revenue (undefined) Forecast, by Application 2020 & 2033
- Table 70: South Africa Tamper Proof Packaging Volume (K) Forecast, by Application 2020 & 2033
- Table 71: Rest of Middle East & Africa Tamper Proof Packaging Revenue (undefined) Forecast, by Application 2020 & 2033
- Table 72: Rest of Middle East & Africa Tamper Proof Packaging Volume (K) Forecast, by Application 2020 & 2033
- Table 73: Global Tamper Proof Packaging Revenue undefined Forecast, by Application 2020 & 2033
- Table 74: Global Tamper Proof Packaging Volume K Forecast, by Application 2020 & 2033
- Table 75: Global Tamper Proof Packaging Revenue undefined Forecast, by Types 2020 & 2033
- Table 76: Global Tamper Proof Packaging Volume K Forecast, by Types 2020 & 2033
- Table 77: Global Tamper Proof Packaging Revenue undefined Forecast, by Country 2020 & 2033
- Table 78: Global Tamper Proof Packaging Volume K Forecast, by Country 2020 & 2033
- Table 79: China Tamper Proof Packaging Revenue (undefined) Forecast, by Application 2020 & 2033
- Table 80: China Tamper Proof Packaging Volume (K) Forecast, by Application 2020 & 2033
- Table 81: India Tamper Proof Packaging Revenue (undefined) Forecast, by Application 2020 & 2033
- Table 82: India Tamper Proof Packaging Volume (K) Forecast, by Application 2020 & 2033
- Table 83: Japan Tamper Proof Packaging Revenue (undefined) Forecast, by Application 2020 & 2033
- Table 84: Japan Tamper Proof Packaging Volume (K) Forecast, by Application 2020 & 2033
- Table 85: South Korea Tamper Proof Packaging Revenue (undefined) Forecast, by Application 2020 & 2033
- Table 86: South Korea Tamper Proof Packaging Volume (K) Forecast, by Application 2020 & 2033
- Table 87: ASEAN Tamper Proof Packaging Revenue (undefined) Forecast, by Application 2020 & 2033
- Table 88: ASEAN Tamper Proof Packaging Volume (K) Forecast, by Application 2020 & 2033
- Table 89: Oceania Tamper Proof Packaging Revenue (undefined) Forecast, by Application 2020 & 2033
- Table 90: Oceania Tamper Proof Packaging Volume (K) Forecast, by Application 2020 & 2033
- Table 91: Rest of Asia Pacific Tamper Proof Packaging Revenue (undefined) Forecast, by Application 2020 & 2033
- Table 92: Rest of Asia Pacific Tamper Proof Packaging Volume (K) Forecast, by Application 2020 & 2033
Frequently Asked Questions
1. What is the projected Compound Annual Growth Rate (CAGR) of the Tamper Proof Packaging?
The projected CAGR is approximately 6.85%.
2. Which companies are prominent players in the Tamper Proof Packaging?
Key companies in the market include AEP Industries, Graham Packaging Company, Amcor Limited, American Packaging Corporation, BALL CORPORATION, Bemis Company, CONTROLTEK, PolyOne, ProAmpac, PRINTPACK, Sealed Air, Winpak.
3. What are the main segments of the Tamper Proof Packaging?
The market segments include Application, Types.
4. Can you provide details about the market size?
The market size is estimated to be USD XXX N/A as of 2022.
5. What are some drivers contributing to market growth?
N/A
6. What are the notable trends driving market growth?
N/A
7. Are there any restraints impacting market growth?
N/A
8. Can you provide examples of recent developments in the market?
N/A
9. What pricing options are available for accessing the report?
Pricing options include single-user, multi-user, and enterprise licenses priced at USD 3350.00, USD 5025.00, and USD 6700.00 respectively.
10. Is the market size provided in terms of value or volume?
The market size is provided in terms of value, measured in N/A and volume, measured in K.
11. Are there any specific market keywords associated with the report?
Yes, the market keyword associated with the report is "Tamper Proof Packaging," which aids in identifying and referencing the specific market segment covered.
12. How do I determine which pricing option suits my needs best?
The pricing options vary based on user requirements and access needs. Individual users may opt for single-user licenses, while businesses requiring broader access may choose multi-user or enterprise licenses for cost-effective access to the report.
13. Are there any additional resources or data provided in the Tamper Proof Packaging report?
While the report offers comprehensive insights, it's advisable to review the specific contents or supplementary materials provided to ascertain if additional resources or data are available.
14. How can I stay updated on further developments or reports in the Tamper Proof Packaging?
To stay informed about further developments, trends, and reports in the Tamper Proof Packaging, consider subscribing to industry newsletters, following relevant companies and organizations, or regularly checking reputable industry news sources and publications.
Methodology
Step 1 - Identification of Relevant Samples Size from Population Database


Step 2 - Approaches for Defining Global Market Size (Value, Volume* & Price*)

Note*: In applicable scenarios
Step 3 - Data Sources
Primary Research
- Web Analytics
- Survey Reports
- Research Institute
- Latest Research Reports
- Opinion Leaders
Secondary Research
- Annual Reports
- White Paper
- Latest Press Release
- Industry Association
- Paid Database
- Investor Presentations

Step 4 - Data Triangulation
Involves using different sources of information in order to increase the validity of a study
These sources are likely to be stakeholders in a program - participants, other researchers, program staff, other community members, and so on.
Then we put all data in single framework & apply various statistical tools to find out the dynamic on the market.
During the analysis stage, feedback from the stakeholder groups would be compared to determine areas of agreement as well as areas of divergence