

Key Insights
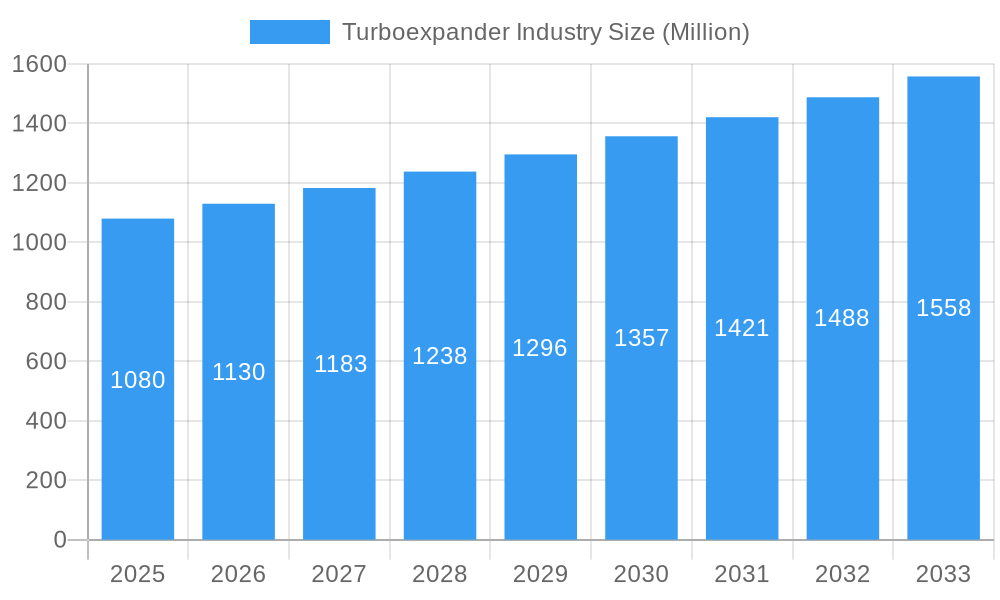
The global turboexpander market, valued at $1.08 billion in 2025, is projected to experience robust growth, driven by increasing demand across various end-user industries. A compound annual growth rate (CAGR) of 4.60% from 2025 to 2033 indicates a significant expansion in market size. Key drivers include the rising adoption of turboexpanders in oil and gas processing for enhanced energy efficiency and cost reduction. The power generation sector, increasingly focusing on renewable energy sources and optimizing energy recovery, also contributes substantially to market growth. Technological advancements leading to improved efficiency, reliability, and reduced maintenance costs further fuel market expansion. While initial investment costs might pose a restraint for some, the long-term operational benefits and environmental advantages are expected to offset this factor. Segmentation analysis reveals that loading devices like compressors, generators, and hydraulic brakes represent significant market shares, with compressors likely holding the largest portion due to their wide applicability in various processes. Geographically, North America and Europe currently dominate the market, but the Asia-Pacific region is poised for substantial growth due to rapid industrialization and infrastructure development, particularly in countries like China and India.
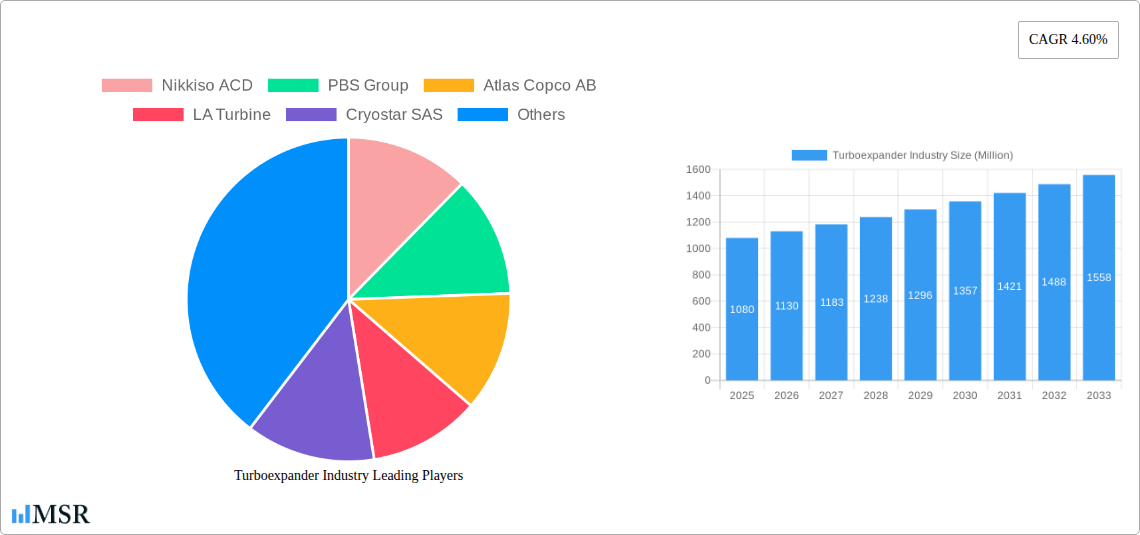
Turboexpander Industry Market Size (In Billion)
The competitive landscape is characterized by a mix of established players and emerging companies. Major players like Nikkiso ACD, PBS Group, Atlas Copco AB, and others are continually innovating to maintain their market share. Future growth will likely be influenced by factors such as government regulations promoting energy efficiency, technological breakthroughs in turboexpander design, and the overall growth of energy-intensive industries. The market's potential is significant, presenting lucrative opportunities for companies focused on research and development, efficient manufacturing, and effective market penetration strategies within key regions and end-user sectors. The continued focus on sustainability and the global push for optimized energy utilization will further solidify the turboexpander market's position as a key component in various industrial processes across the globe.
Turboexpander Industry Company Market Share
Turboexpander Industry Market Report: 2019-2033 Forecast
This comprehensive report provides an in-depth analysis of the global turboexpander industry, offering actionable insights for stakeholders across the value chain. Valued at $XX Million in 2025, the market is projected to reach $XX Million by 2033, exhibiting a CAGR of XX% during the forecast period (2025-2033). The study covers the historical period (2019-2024) and the base year of 2025. Key players analyzed include Nikkiso ACD, PBS Group, Atlas Copco AB, LA Turbine, Cryostar SAS, Air Products and Chemicals Inc., Elliott Group, Baker Hughes Company, and Blair Engineering, though this list is not exhaustive.
Turboexpander Industry Market Concentration & Dynamics
The turboexpander market is characterized by a moderately concentrated landscape, with a few major players holding significant market share. Nikkiso ACD, Atlas Copco AB, and Elliott Group currently command a considerable portion of the market, estimated at a combined XX%. However, several smaller players contribute to a competitive environment. Innovation is a key driver, with ongoing developments in materials science and design leading to improved efficiency and reliability. Stringent environmental regulations, particularly concerning emissions, are shaping market trends, pushing the adoption of energy-efficient turboexpanders. The emergence of substitute technologies, although currently limited, presents a long-term challenge. End-user trends favour energy-efficient solutions driven by growing concerns about sustainability. Furthermore, the industry has witnessed a moderate level of M&A activity in recent years, with approximately XX deals recorded between 2019 and 2024, mainly focused on expanding technological capabilities and market reach.
- Market Share: Top 3 players hold XX% combined.
- M&A Activity: Approximately XX deals between 2019 and 2024.
- Regulatory Landscape: Stringent environmental regulations drive innovation and adoption of energy-efficient technologies.
- Substitute Products: Limited presence, but potential for future disruption.
Turboexpander Industry Insights & Trends
The global turboexpander market is experiencing robust growth, driven primarily by the increasing demand for energy-efficient solutions across various end-user industries. The rising adoption of turboexpanders in oil and gas processing, power generation, and energy recovery applications is a significant factor. Technological advancements leading to higher efficiency, reduced operational costs, and enhanced reliability are further boosting market expansion. The shift toward sustainable energy sources and the growing emphasis on carbon emission reduction are also major catalysts. Consumer behavior increasingly favors eco-friendly and cost-effective technologies, further driving the demand for turboexpanders. The market size, valued at $XX Million in 2025, is expected to expand significantly over the forecast period, driven by continuous technological innovation, stringent environmental regulations, and the increasing focus on energy efficiency across numerous sectors. The growing demand for natural gas and LNG further fuels the growth.
Key Markets & Segments Leading Turboexpander Industry
The Oil and Gas sector currently dominates the turboexpander market, accounting for approximately XX% of the total demand in 2025. This is fueled by the continuous need for efficient gas processing and energy recovery in upstream and downstream operations. The Power Generation segment is also experiencing substantial growth, driven by the increasing adoption of turboexpanders in combined cycle power plants for enhanced efficiency. The Energy Recovery segment demonstrates significant potential, driven by ongoing projects for energy savings in industrial processes.
Drivers for dominant segments:
- Oil & Gas: High demand for efficient gas processing and energy recovery.
- Power Generation: Adoption in combined cycle power plants for increased efficiency.
- Energy Recovery: Growing emphasis on industrial energy efficiency and waste heat recovery.
Geographic Dominance: The North American and European regions currently hold the largest market share due to their well-established oil and gas infrastructure and robust power generation sectors. However, the Asia-Pacific region is expected to show the highest growth rate over the forecast period due to increasing energy demand and investments in infrastructure development.
Turboexpander Industry Product Developments
Recent advancements in turboexpander technology include the development of more compact and efficient designs, the use of advanced materials for improved durability and performance, and enhanced control systems for optimized operation. These innovations are addressing the demand for higher efficiency, reduced maintenance costs, and improved environmental compliance, thereby increasing market competitiveness. Furthermore, the integration of turboexpanders into hybrid energy systems and the development of specific designs for emerging applications like hydrogen production contribute to technological differentiation and market penetration.
Challenges in the Turboexpander Industry Market
The turboexpander industry faces challenges including the volatile nature of raw material prices, potential supply chain disruptions, and intense competition from established players and emerging technologies. Furthermore, stringent regulatory compliance requirements and the need for skilled labor can impact profitability and market expansion. The fluctuation in oil and gas prices also impacts investment decisions in new installations. These factors can collectively reduce market growth and profitability.
Forces Driving Turboexpander Industry Growth
Key growth drivers include increasing energy demand, stringent environmental regulations pushing for energy efficiency, and technological advancements enabling higher performance and lower operational costs. Government initiatives promoting clean energy and energy recovery further stimulate market expansion. The rise of natural gas and LNG as fuel sources also contributes significantly to growth.
Long-Term Growth Catalysts in Turboexpander Industry
Long-term growth will be driven by continuous innovation in materials science and design, leading to increased efficiency and reliability of turboexpanders. Strategic partnerships and collaborations between manufacturers and end-users will foster the development of customized solutions for specific applications. Market expansion into emerging economies with growing energy demands will offer significant opportunities.
Emerging Opportunities in Turboexpander Industry
Emerging opportunities lie in the development of turboexpanders for niche applications, such as hydrogen production and carbon capture. The increasing focus on waste heat recovery presents a significant growth potential. The expansion into new geographic markets and the development of integrated energy systems provide further opportunities for market growth.
Leading Players in the Turboexpander Industry Sector
- Nikkiso ACD
- PBS Group
- Atlas Copco AB
- LA Turbine
- Cryostar SAS
- Air Products and Chemicals Inc.
- Elliott Group
- Baker Hughes Company
- Blair Engineering
Key Milestones in Turboexpander Industry
- August 2023: Sapphire Technologies and TB Global Technologies Ltd. announced a new turboexpander generator for waste energy harvesting in city gas transportation. This signifies a move towards innovative applications and sustainable energy solutions.
- October 2022: Sapphire Technologies partnered with Tallgrass Energy for a nationwide clean energy project involving 72 turbo expander systems over three years. This collaboration highlights the growing demand for energy recovery systems and the potential for large-scale deployments.
Strategic Outlook for Turboexpander Industry Market
The future of the turboexpander industry looks promising, driven by continuous innovation, increasing energy demand, and the growing emphasis on sustainability. Strategic partnerships, technological advancements, and expansion into new markets will be key factors in realizing the substantial growth potential of this sector. The industry is poised for significant expansion as it addresses global energy needs with efficient and environmentally friendly solutions.
Turboexpander Industry Segmentation
-
1. Loading Devices
- 1.1. Compressor
- 1.2. Generator
- 1.3. Hydraulic Brake
-
2. End-user Industry
- 2.1. Oil and Gas
- 2.2. Power Generation
- 2.3. Energy Recovery
- 2.4. Other End-user Industries
Turboexpander Industry Segmentation By Geography
-
1. North America
- 1.1. United States
- 1.2. Canada
- 1.3. Rest of North America
-
2. Europe
- 2.1. Germany
- 2.2. France
- 2.3. United Kingdom
- 2.4. Italy
- 2.5. Rest of Europe
-
3. Asia Pacific
- 3.1. China
- 3.2. India
- 3.3. Japan
- 3.4. Australia
- 3.5. Rest of Asia Pacific
-
4. South America
- 4.1. Brazil
- 4.2. Argentina
- 4.3. Chile
- 4.4. Rest of South America
-
5. Middle East and Africa
- 5.1. Saudi Arabia
- 5.2. United Arab Emirates
- 5.3. South Africa
- 5.4. Qatar
- 5.5. Rest of Middle East and Africa
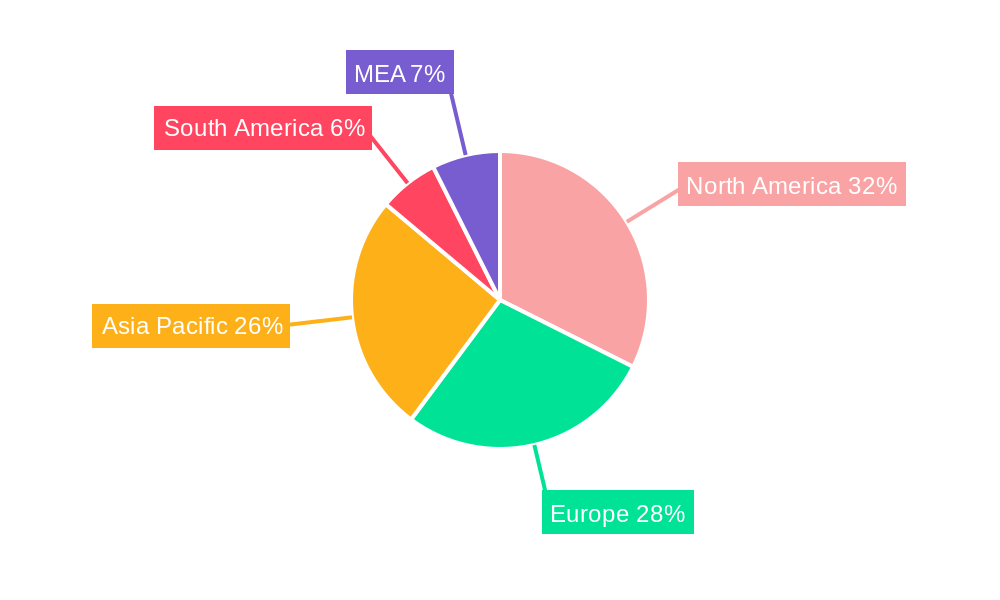
Turboexpander Industry Regional Market Share
Geographic Coverage of Turboexpander Industry
Turboexpander Industry REPORT HIGHLIGHTS
| Aspects | Details |
|---|---|
| Study Period | 2020-2034 |
| Base Year | 2025 |
| Estimated Year | 2026 |
| Forecast Period | 2026-2034 |
| Historical Period | 2020-2025 |
| Growth Rate | CAGR of 4.60% from 2020-2034 |
| Segmentation |
|
Table of Contents
- 1. Introduction
- 1.1. Research Scope
- 1.2. Market Segmentation
- 1.3. Research Objective
- 1.4. Definitions and Assumptions
- 2. Executive Summary
- 2.1. Market Snapshot
- 3. Market Dynamics
- 3.1. Market Drivers
- 3.2. Market Restrains
- 3.3. Market Trends
- 3.4. Market Opportunities
- 4. Market Factor Analysis
- 4.1. Porters Five Forces
- 4.1.1. Bargaining Power of Suppliers
- 4.1.2. Bargaining Power of Buyers
- 4.1.3. Threat of New Entrants
- 4.1.4. Threat of Substitutes
- 4.1.5. Competitive Rivalry
- 4.2. PESTEL analysis
- 4.3. BCG Analysis
- 4.3.1. Stars (High Growth, High Market Share)
- 4.3.2. Cash Cows (Low Growth, High Market Share)
- 4.3.3. Question Mark (High Growth, Low Market Share)
- 4.3.4. Dogs (Low Growth, Low Market Share)
- 4.4. Ansoff Matrix Analysis
- 4.5. Supply Chain Analysis
- 4.6. Regulatory Landscape
- 4.7. Current Market Potential and Opportunity Assessment (TAM–SAM–SOM Framework)
- 4.8. MSR Analyst Note
- 4.1. Porters Five Forces
- 5. Market Analysis, Insights and Forecast 2021-2033
- 5.1. Market Analysis, Insights and Forecast - by Loading Devices
- 5.1.1. Compressor
- 5.1.2. Generator
- 5.1.3. Hydraulic Brake
- 5.2. Market Analysis, Insights and Forecast - by End-user Industry
- 5.2.1. Oil and Gas
- 5.2.2. Power Generation
- 5.2.3. Energy Recovery
- 5.2.4. Other End-user Industries
- 5.3. Market Analysis, Insights and Forecast - by Region
- 5.3.1. North America
- 5.3.2. Europe
- 5.3.3. Asia Pacific
- 5.3.4. South America
- 5.3.5. Middle East and Africa
- 5.1. Market Analysis, Insights and Forecast - by Loading Devices
- 6. Global Turboexpander Industry Analysis, Insights and Forecast, 2021-2033
- 6.1. Market Analysis, Insights and Forecast - by Loading Devices
- 6.1.1. Compressor
- 6.1.2. Generator
- 6.1.3. Hydraulic Brake
- 6.2. Market Analysis, Insights and Forecast - by End-user Industry
- 6.2.1. Oil and Gas
- 6.2.2. Power Generation
- 6.2.3. Energy Recovery
- 6.2.4. Other End-user Industries
- 6.1. Market Analysis, Insights and Forecast - by Loading Devices
- 7. North America Turboexpander Industry Analysis, Insights and Forecast, 2020-2032
- 7.1. Market Analysis, Insights and Forecast - by Loading Devices
- 7.1.1. Compressor
- 7.1.2. Generator
- 7.1.3. Hydraulic Brake
- 7.2. Market Analysis, Insights and Forecast - by End-user Industry
- 7.2.1. Oil and Gas
- 7.2.2. Power Generation
- 7.2.3. Energy Recovery
- 7.2.4. Other End-user Industries
- 7.1. Market Analysis, Insights and Forecast - by Loading Devices
- 8. Europe Turboexpander Industry Analysis, Insights and Forecast, 2020-2032
- 8.1. Market Analysis, Insights and Forecast - by Loading Devices
- 8.1.1. Compressor
- 8.1.2. Generator
- 8.1.3. Hydraulic Brake
- 8.2. Market Analysis, Insights and Forecast - by End-user Industry
- 8.2.1. Oil and Gas
- 8.2.2. Power Generation
- 8.2.3. Energy Recovery
- 8.2.4. Other End-user Industries
- 8.1. Market Analysis, Insights and Forecast - by Loading Devices
- 9. Asia Pacific Turboexpander Industry Analysis, Insights and Forecast, 2020-2032
- 9.1. Market Analysis, Insights and Forecast - by Loading Devices
- 9.1.1. Compressor
- 9.1.2. Generator
- 9.1.3. Hydraulic Brake
- 9.2. Market Analysis, Insights and Forecast - by End-user Industry
- 9.2.1. Oil and Gas
- 9.2.2. Power Generation
- 9.2.3. Energy Recovery
- 9.2.4. Other End-user Industries
- 9.1. Market Analysis, Insights and Forecast - by Loading Devices
- 10. South America Turboexpander Industry Analysis, Insights and Forecast, 2020-2032
- 10.1. Market Analysis, Insights and Forecast - by Loading Devices
- 10.1.1. Compressor
- 10.1.2. Generator
- 10.1.3. Hydraulic Brake
- 10.2. Market Analysis, Insights and Forecast - by End-user Industry
- 10.2.1. Oil and Gas
- 10.2.2. Power Generation
- 10.2.3. Energy Recovery
- 10.2.4. Other End-user Industries
- 10.1. Market Analysis, Insights and Forecast - by Loading Devices
- 11. Middle East and Africa Turboexpander Industry Analysis, Insights and Forecast, 2020-2032
- 11.1. Market Analysis, Insights and Forecast - by Loading Devices
- 11.1.1. Compressor
- 11.1.2. Generator
- 11.1.3. Hydraulic Brake
- 11.2. Market Analysis, Insights and Forecast - by End-user Industry
- 11.2.1. Oil and Gas
- 11.2.2. Power Generation
- 11.2.3. Energy Recovery
- 11.2.4. Other End-user Industries
- 11.1. Market Analysis, Insights and Forecast - by Loading Devices
- 12. Competitive Analysis
- 12.1. Company Profiles
- 12.1.1 Nikkiso ACD
- 12.1.1.1. Company Overview
- 12.1.1.2. Products
- 12.1.1.3. Company Financials
- 12.1.1.4. SWOT Analysis
- 12.1.2 PBS Group
- 12.1.2.1. Company Overview
- 12.1.2.2. Products
- 12.1.2.3. Company Financials
- 12.1.2.4. SWOT Analysis
- 12.1.3 Atlas Copco AB
- 12.1.3.1. Company Overview
- 12.1.3.2. Products
- 12.1.3.3. Company Financials
- 12.1.3.4. SWOT Analysis
- 12.1.4 LA Turbine
- 12.1.4.1. Company Overview
- 12.1.4.2. Products
- 12.1.4.3. Company Financials
- 12.1.4.4. SWOT Analysis
- 12.1.5 Cryostar SAS
- 12.1.5.1. Company Overview
- 12.1.5.2. Products
- 12.1.5.3. Company Financials
- 12.1.5.4. SWOT Analysis
- 12.1.6 Air Products and Chemicals Inc *List Not Exhaustive
- 12.1.6.1. Company Overview
- 12.1.6.2. Products
- 12.1.6.3. Company Financials
- 12.1.6.4. SWOT Analysis
- 12.1.7 Elliott Group
- 12.1.7.1. Company Overview
- 12.1.7.2. Products
- 12.1.7.3. Company Financials
- 12.1.7.4. SWOT Analysis
- 12.1.8 Baker Hughes Company
- 12.1.8.1. Company Overview
- 12.1.8.2. Products
- 12.1.8.3. Company Financials
- 12.1.8.4. SWOT Analysis
- 12.1.9 Blair Engineering
- 12.1.9.1. Company Overview
- 12.1.9.2. Products
- 12.1.9.3. Company Financials
- 12.1.9.4. SWOT Analysis
- 12.1.1 Nikkiso ACD
- 12.2. Market Entropy
- 12.2.1 Company's Key Areas Served
- 12.2.2 Recent Developments
- 12.3. Company Market Share Analysis 2025
- 12.3.1 Top 5 Companies Market Share Analysis
- 12.3.2 Top 3 Companies Market Share Analysis
- 12.4. List of Potential Customers
- 13. Research Methodology
List of Figures
- Figure 1: Global Turboexpander Industry Revenue Breakdown (Million, %) by Region 2025 & 2033
- Figure 2: North America Turboexpander Industry Revenue (Million), by Loading Devices 2025 & 2033
- Figure 3: North America Turboexpander Industry Revenue Share (%), by Loading Devices 2025 & 2033
- Figure 4: North America Turboexpander Industry Revenue (Million), by End-user Industry 2025 & 2033
- Figure 5: North America Turboexpander Industry Revenue Share (%), by End-user Industry 2025 & 2033
- Figure 6: North America Turboexpander Industry Revenue (Million), by Country 2025 & 2033
- Figure 7: North America Turboexpander Industry Revenue Share (%), by Country 2025 & 2033
- Figure 8: Europe Turboexpander Industry Revenue (Million), by Loading Devices 2025 & 2033
- Figure 9: Europe Turboexpander Industry Revenue Share (%), by Loading Devices 2025 & 2033
- Figure 10: Europe Turboexpander Industry Revenue (Million), by End-user Industry 2025 & 2033
- Figure 11: Europe Turboexpander Industry Revenue Share (%), by End-user Industry 2025 & 2033
- Figure 12: Europe Turboexpander Industry Revenue (Million), by Country 2025 & 2033
- Figure 13: Europe Turboexpander Industry Revenue Share (%), by Country 2025 & 2033
- Figure 14: Asia Pacific Turboexpander Industry Revenue (Million), by Loading Devices 2025 & 2033
- Figure 15: Asia Pacific Turboexpander Industry Revenue Share (%), by Loading Devices 2025 & 2033
- Figure 16: Asia Pacific Turboexpander Industry Revenue (Million), by End-user Industry 2025 & 2033
- Figure 17: Asia Pacific Turboexpander Industry Revenue Share (%), by End-user Industry 2025 & 2033
- Figure 18: Asia Pacific Turboexpander Industry Revenue (Million), by Country 2025 & 2033
- Figure 19: Asia Pacific Turboexpander Industry Revenue Share (%), by Country 2025 & 2033
- Figure 20: South America Turboexpander Industry Revenue (Million), by Loading Devices 2025 & 2033
- Figure 21: South America Turboexpander Industry Revenue Share (%), by Loading Devices 2025 & 2033
- Figure 22: South America Turboexpander Industry Revenue (Million), by End-user Industry 2025 & 2033
- Figure 23: South America Turboexpander Industry Revenue Share (%), by End-user Industry 2025 & 2033
- Figure 24: South America Turboexpander Industry Revenue (Million), by Country 2025 & 2033
- Figure 25: South America Turboexpander Industry Revenue Share (%), by Country 2025 & 2033
- Figure 26: Middle East and Africa Turboexpander Industry Revenue (Million), by Loading Devices 2025 & 2033
- Figure 27: Middle East and Africa Turboexpander Industry Revenue Share (%), by Loading Devices 2025 & 2033
- Figure 28: Middle East and Africa Turboexpander Industry Revenue (Million), by End-user Industry 2025 & 2033
- Figure 29: Middle East and Africa Turboexpander Industry Revenue Share (%), by End-user Industry 2025 & 2033
- Figure 30: Middle East and Africa Turboexpander Industry Revenue (Million), by Country 2025 & 2033
- Figure 31: Middle East and Africa Turboexpander Industry Revenue Share (%), by Country 2025 & 2033
List of Tables
- Table 1: Global Turboexpander Industry Revenue Million Forecast, by Loading Devices 2020 & 2033
- Table 2: Global Turboexpander Industry Revenue Million Forecast, by End-user Industry 2020 & 2033
- Table 3: Global Turboexpander Industry Revenue Million Forecast, by Region 2020 & 2033
- Table 4: Global Turboexpander Industry Revenue Million Forecast, by Loading Devices 2020 & 2033
- Table 5: Global Turboexpander Industry Revenue Million Forecast, by End-user Industry 2020 & 2033
- Table 6: Global Turboexpander Industry Revenue Million Forecast, by Country 2020 & 2033
- Table 7: United States Turboexpander Industry Revenue (Million) Forecast, by Application 2020 & 2033
- Table 8: Canada Turboexpander Industry Revenue (Million) Forecast, by Application 2020 & 2033
- Table 9: Rest of North America Turboexpander Industry Revenue (Million) Forecast, by Application 2020 & 2033
- Table 10: Global Turboexpander Industry Revenue Million Forecast, by Loading Devices 2020 & 2033
- Table 11: Global Turboexpander Industry Revenue Million Forecast, by End-user Industry 2020 & 2033
- Table 12: Global Turboexpander Industry Revenue Million Forecast, by Country 2020 & 2033
- Table 13: Germany Turboexpander Industry Revenue (Million) Forecast, by Application 2020 & 2033
- Table 14: France Turboexpander Industry Revenue (Million) Forecast, by Application 2020 & 2033
- Table 15: United Kingdom Turboexpander Industry Revenue (Million) Forecast, by Application 2020 & 2033
- Table 16: Italy Turboexpander Industry Revenue (Million) Forecast, by Application 2020 & 2033
- Table 17: Rest of Europe Turboexpander Industry Revenue (Million) Forecast, by Application 2020 & 2033
- Table 18: Global Turboexpander Industry Revenue Million Forecast, by Loading Devices 2020 & 2033
- Table 19: Global Turboexpander Industry Revenue Million Forecast, by End-user Industry 2020 & 2033
- Table 20: Global Turboexpander Industry Revenue Million Forecast, by Country 2020 & 2033
- Table 21: China Turboexpander Industry Revenue (Million) Forecast, by Application 2020 & 2033
- Table 22: India Turboexpander Industry Revenue (Million) Forecast, by Application 2020 & 2033
- Table 23: Japan Turboexpander Industry Revenue (Million) Forecast, by Application 2020 & 2033
- Table 24: Australia Turboexpander Industry Revenue (Million) Forecast, by Application 2020 & 2033
- Table 25: Rest of Asia Pacific Turboexpander Industry Revenue (Million) Forecast, by Application 2020 & 2033
- Table 26: Global Turboexpander Industry Revenue Million Forecast, by Loading Devices 2020 & 2033
- Table 27: Global Turboexpander Industry Revenue Million Forecast, by End-user Industry 2020 & 2033
- Table 28: Global Turboexpander Industry Revenue Million Forecast, by Country 2020 & 2033
- Table 29: Brazil Turboexpander Industry Revenue (Million) Forecast, by Application 2020 & 2033
- Table 30: Argentina Turboexpander Industry Revenue (Million) Forecast, by Application 2020 & 2033
- Table 31: Chile Turboexpander Industry Revenue (Million) Forecast, by Application 2020 & 2033
- Table 32: Rest of South America Turboexpander Industry Revenue (Million) Forecast, by Application 2020 & 2033
- Table 33: Global Turboexpander Industry Revenue Million Forecast, by Loading Devices 2020 & 2033
- Table 34: Global Turboexpander Industry Revenue Million Forecast, by End-user Industry 2020 & 2033
- Table 35: Global Turboexpander Industry Revenue Million Forecast, by Country 2020 & 2033
- Table 36: Saudi Arabia Turboexpander Industry Revenue (Million) Forecast, by Application 2020 & 2033
- Table 37: United Arab Emirates Turboexpander Industry Revenue (Million) Forecast, by Application 2020 & 2033
- Table 38: South Africa Turboexpander Industry Revenue (Million) Forecast, by Application 2020 & 2033
- Table 39: Qatar Turboexpander Industry Revenue (Million) Forecast, by Application 2020 & 2033
- Table 40: Rest of Middle East and Africa Turboexpander Industry Revenue (Million) Forecast, by Application 2020 & 2033
Frequently Asked Questions
1. What is the projected Compound Annual Growth Rate (CAGR) of the Turboexpander Industry?
The projected CAGR is approximately 4.60%.
2. Which companies are prominent players in the Turboexpander Industry?
Key companies in the market include Nikkiso ACD, PBS Group, Atlas Copco AB, LA Turbine, Cryostar SAS, Air Products and Chemicals Inc *List Not Exhaustive, Elliott Group, Baker Hughes Company, Blair Engineering.
3. What are the main segments of the Turboexpander Industry?
The market segments include Loading Devices, End-user Industry.
4. Can you provide details about the market size?
The market size is estimated to be USD 1.08 Million as of 2022.
5. What are some drivers contributing to market growth?
4.; Increasing Investment in the Adaption of Natural Gas for Power Generation and Fuel for Various Industries.
6. What are the notable trends driving market growth?
Power Generation Segment to Have a Significant Share.
7. Are there any restraints impacting market growth?
4.; Increasing Share of Renewable Energy Sources.
8. Can you provide examples of recent developments in the market?
August 2023: Sapphire Technologies and TB Global Technologies Ltd. announced the development of a turboexpander generator that harnesses waste energy in city gas transportation routes. Two FreeSpin In-line Turbo Expanders (FIT) were successfully commissioned at the Toho Gasin’s Yokkaichi liquefied natural gas (LNG) terminal in Japan.
9. What pricing options are available for accessing the report?
Pricing options include single-user, multi-user, and enterprise licenses priced at USD 4750, USD 5250, and USD 8750 respectively.
10. Is the market size provided in terms of value or volume?
The market size is provided in terms of value, measured in Million.
11. Are there any specific market keywords associated with the report?
Yes, the market keyword associated with the report is "Turboexpander Industry," which aids in identifying and referencing the specific market segment covered.
12. How do I determine which pricing option suits my needs best?
The pricing options vary based on user requirements and access needs. Individual users may opt for single-user licenses, while businesses requiring broader access may choose multi-user or enterprise licenses for cost-effective access to the report.
13. Are there any additional resources or data provided in the Turboexpander Industry report?
While the report offers comprehensive insights, it's advisable to review the specific contents or supplementary materials provided to ascertain if additional resources or data are available.
14. How can I stay updated on further developments or reports in the Turboexpander Industry?
To stay informed about further developments, trends, and reports in the Turboexpander Industry, consider subscribing to industry newsletters, following relevant companies and organizations, or regularly checking reputable industry news sources and publications.
Methodology
Step 1 - Identification of Relevant Samples Size from Population Database


Step 2 - Approaches for Defining Global Market Size (Value, Volume* & Price*)

Note*: In applicable scenarios
Step 3 - Data Sources
Primary Research
- Web Analytics
- Survey Reports
- Research Institute
- Latest Research Reports
- Opinion Leaders
Secondary Research
- Annual Reports
- White Paper
- Latest Press Release
- Industry Association
- Paid Database
- Investor Presentations

Step 4 - Data Triangulation
Involves using different sources of information in order to increase the validity of a study
These sources are likely to be stakeholders in a program - participants, other researchers, program staff, other community members, and so on.
Then we put all data in single framework & apply various statistical tools to find out the dynamic on the market.
During the analysis stage, feedback from the stakeholder groups would be compared to determine areas of agreement as well as areas of divergence