

Key Insights
The United States transformer market, projected at $70.9 billion in 2025, is set for significant expansion. This growth is primarily driven by escalating electricity demand across residential, commercial, and industrial sectors. The increasing integration of renewable energy sources, such as solar and wind, necessitates advanced energy transmission and distribution, boosting transformer demand. Technological innovations, including the development of more efficient, compact, and higher-capacity transformers, further support market momentum. The market is segmented by cooling type (air-cooled, oil-cooled), transformer type (power, distribution), and power rating (small, medium, large). Air-cooled transformers lead due to cost-effectiveness and ease of maintenance, though oil-cooled transformers are gaining prominence for high-power applications. The distribution transformer segment holds a larger share, reflecting widespread electricity distribution needs. Key industry players include ABB, Toshiba, Hitachi, Emerson Electric, Mitsubishi Electric, Siemens, Schneider Electric, Eaton, GE, and Panasonic, who compete on technological advancement, efficiency, and cost.
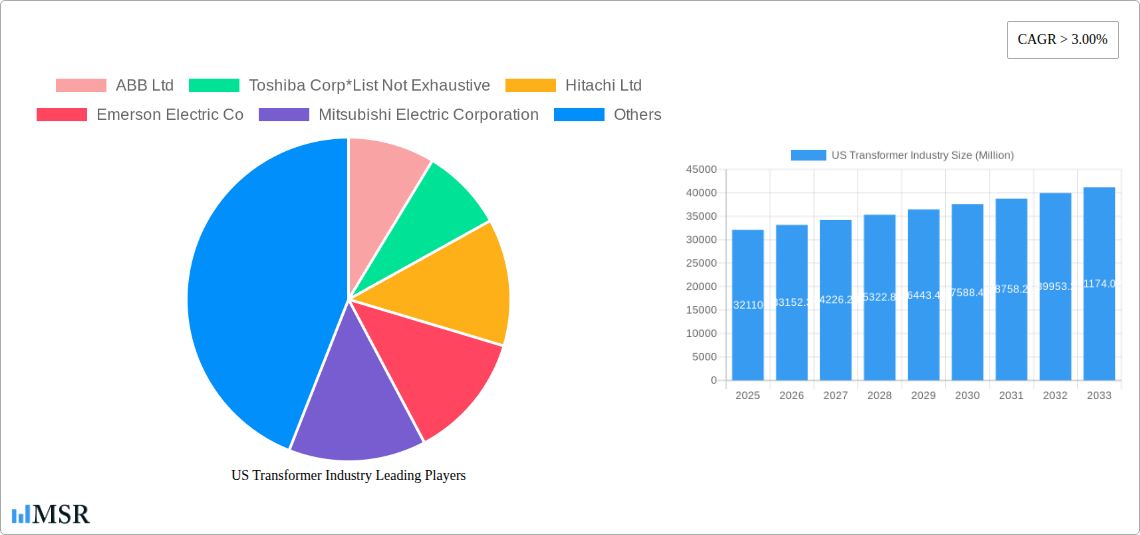
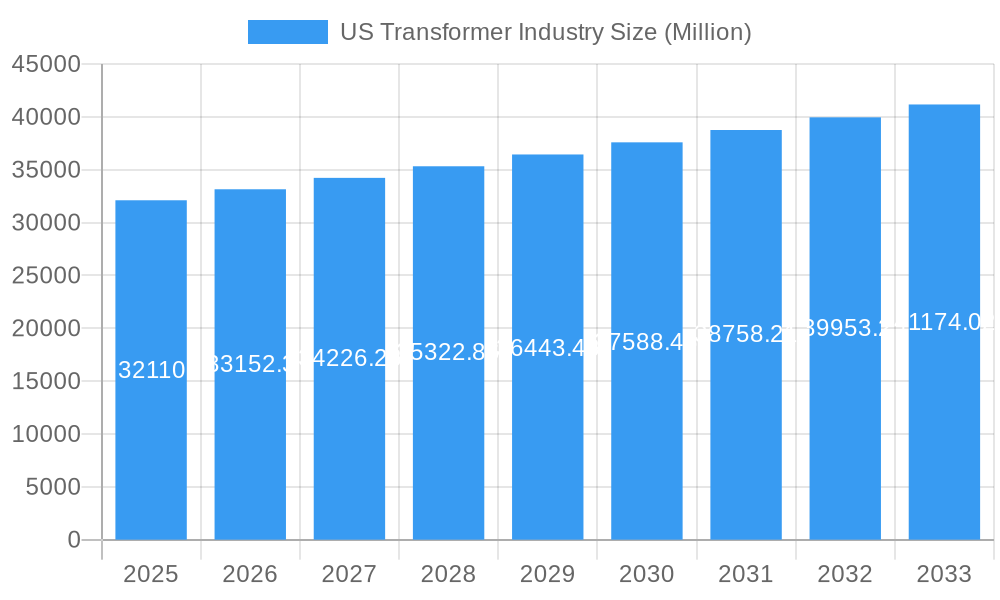
US Transformer Industry Market Size (In Billion)
While the market exhibits strong growth potential, it faces challenges including stringent environmental regulations on transformer oils and rising raw material costs. Energy price volatility and economic downturns can also impact investment in new infrastructure. However, government initiatives focused on grid modernization and energy efficiency are expected to offset these constraints. The forecast period (2025-2033) anticipates sustained expansion, with a Compound Annual Growth Rate (CAGR) of 9.95%, presenting substantial opportunities for manufacturers and investors. Regional market dynamics within the US, including the Northeast, Southeast, Midwest, Southwest, and West, will be shaped by varying industrial activity and infrastructure development levels.
US Transformer Industry Company Market Share
US Transformer Industry: Market Analysis & Forecast (2019-2033)
This comprehensive report provides an in-depth analysis of the US transformer industry, covering market size, growth drivers, key players, and future trends. With a study period spanning 2019-2033, a base year of 2025, and a forecast period of 2025-2033, this report offers invaluable insights for industry stakeholders, investors, and strategic decision-makers. The report utilizes data from the historical period (2019-2024) and provides estimations for 2025.
US Transformer Industry Market Concentration & Dynamics
The US transformer market exhibits a moderately concentrated landscape, with a few major players holding significant market share. ABB Ltd, Toshiba Corp, Hitachi Ltd, Emerson Electric Co, Mitsubishi Electric Corporation, Siemens AG, Schneider Electric SE, Eaton Corporation PLC, General Electric Company, and Panasonic Corporation are key players, though the market also includes numerous smaller regional manufacturers. Market share fluctuates based on project wins, technological advancements, and strategic partnerships. Innovation within the industry is primarily driven by the need for increased energy efficiency, grid modernization, and integration of renewable energy sources. Stringent regulatory frameworks, including those focusing on energy efficiency and safety standards, significantly influence market dynamics. Substitute products, such as alternative energy transmission technologies, present a limited competitive threat at present. The end-user trends demonstrate a growing demand from utility companies, the renewable energy sector, and data centers. Mergers and acquisitions (M&A) activity has been moderate in recent years, with xx M&A deals recorded between 2019 and 2024, resulting in a xx% market share shift among top players.
- Market Concentration: Moderately concentrated, with top 10 players holding approximately xx% of the market share in 2024.
- Innovation Ecosystems: Focused on energy efficiency, grid modernization, and renewable energy integration.
- Regulatory Frameworks: Stringent safety and energy-efficiency standards influence design and manufacturing.
- Substitute Products: Limited competition from alternative technologies.
- End-User Trends: Growing demand from utilities, renewables, and data centers.
- M&A Activity: Moderate activity, with xx deals resulting in xx% market share change (2019-2024).
US Transformer Industry Industry Insights & Trends
The US transformer industry experienced a market size of USD xx Million in 2024, exhibiting a Compound Annual Growth Rate (CAGR) of xx% during the historical period (2019-2024). This growth is primarily driven by the increasing demand for electricity, expanding infrastructure projects, and the growing adoption of renewable energy sources. Technological disruptions, such as the development of more efficient cooling technologies and smart grid integration, are reshaping the industry. Consumer behavior shifts towards sustainability and reduced carbon emissions are creating new opportunities for environmentally friendly transformer designs. The market is also witnessing an increasing adoption of digital technologies for predictive maintenance and asset management. Growth is expected to continue in the forecast period (2025-2033), driven by continued investment in grid modernization and the expanding renewable energy sector, with the market expected to reach USD xx Million by 2033.
Key Markets & Segments Leading US Transformer Industry
The dominant segment is the power transformer market, fueled by significant investments in grid infrastructure upgrades and renewable energy projects. The largest market segment in terms of power rating is the medium-power transformer segment, followed by large and small power rating transformers. The oil-cooled transformer segment holds a larger market share compared to air-cooled transformers, due to higher efficiency and capacity. Geographically, the concentration of major manufacturing facilities and significant energy demand makes the eastern and southern regions of the US the leading markets.
- Dominant Region: Eastern and Southern US.
- Dominant Transformer Type: Power Transformer.
- Dominant Cooling Type: Oil-Cooled.
- Dominant Power Rating: Medium.
- Growth Drivers:
- Increased electricity demand
- Infrastructure development
- Renewable energy integration
- Grid modernization initiatives.
US Transformer Industry Product Developments
Recent product innovations focus on enhancing energy efficiency, reducing environmental impact, and improving operational reliability. Advancements in materials science, cooling technologies, and digital monitoring systems have led to the development of smaller, lighter, and more efficient transformers with enhanced lifespan and reduced maintenance requirements. These innovations provide a competitive edge in a market increasingly focused on sustainability and cost-effectiveness. The integration of smart grid technologies also improves monitoring capabilities and facilitates predictive maintenance, leading to better grid management and reduced downtime.
Challenges in the US Transformer Industry Market
The industry faces challenges including supply chain disruptions impacting raw material availability and production costs, increasing raw material prices, particularly for copper and steel, leading to higher transformer costs and potential project delays. Stringent regulatory compliance requirements and increasing competition from both domestic and international manufacturers pose further challenges. These factors contribute to a complex and ever-evolving market landscape that requires ongoing adaptation and innovation for sustained success.
Forces Driving US Transformer Industry Growth
Key growth drivers include the expanding renewable energy sector, increasing electricity demand, and government initiatives promoting grid modernization and energy efficiency. Investments in smart grid technologies, the rising adoption of electric vehicles, and the continuous development of more efficient and sustainable transformer designs are also contributing to market expansion. Furthermore, increasing industrialization and urbanization continue to propel demand for reliable power infrastructure.
Long-Term Growth Catalysts in the US Transformer Industry
Long-term growth will be propelled by continuous innovation in transformer technology, strategic partnerships to enhance supply chain resilience, and expansion into new markets, such as microgrids and distributed generation systems. The development of sustainable and eco-friendly transformer designs will also play a key role in driving future growth. Furthermore, the increasing integration of data analytics and predictive maintenance capabilities offers significant opportunities for efficiency gains and improved service offerings.
Emerging Opportunities in US Transformer Industry
Emerging opportunities include the integration of smart grid technologies, the growth of microgrids and distributed generation, and the increasing demand for energy storage solutions. The adoption of advanced manufacturing techniques and materials, such as high-temperature superconductors, presents further opportunities for enhancing transformer efficiency and performance. Furthermore, the development of novel cooling techniques and the use of recycled materials contribute to the creation of a sustainable and environmentally conscious transformer industry.
Leading Players in the US Transformer Industry Sector
Key Milestones in US Transformer Industry Industry
December 2022: Hitachi Energy announced a USD 37 Million investment to expand its power transformer manufacturing facility in South Boston, Virginia, to meet growing demand from utilities and renewable energy sectors. This expansion signals confidence in future market growth and the company's commitment to supporting the renewable energy transition.
December 2022: The US Department of Energy (DOE) proposed new energy-efficiency criteria for distribution transformers, aiming to enhance grid reliability, reduce costs, and lower CO2 emissions. This regulatory move will stimulate innovation and drive the adoption of more energy-efficient transformer designs.
Strategic Outlook for US Transformer Industry Market
The US transformer industry is poised for significant growth, driven by investments in grid modernization, the expansion of renewable energy infrastructure, and ongoing technological advancements. Strategic opportunities exist for companies that can innovate to meet the evolving needs of the market, focusing on energy efficiency, sustainability, and smart grid integration. Companies that successfully navigate supply chain challenges and adapt to evolving regulatory landscapes will be best positioned to capitalize on the considerable market potential.
US Transformer Industry Segmentation
- 1. Production Analysis
- 2. Consumption Analysis
- 3. Import Market Analysis (Value & Volume)
- 4. Export Market Analysis (Value & Volume)
- 5. Price Trend Analysis
US Transformer Industry Segmentation By Geography
-
1. North America
- 1.1. United States
- 1.2. Canada
- 1.3. Mexico
-
2. South America
- 2.1. Brazil
- 2.2. Argentina
- 2.3. Rest of South America
-
3. Europe
- 3.1. United Kingdom
- 3.2. Germany
- 3.3. France
- 3.4. Italy
- 3.5. Spain
- 3.6. Russia
- 3.7. Benelux
- 3.8. Nordics
- 3.9. Rest of Europe
-
4. Middle East & Africa
- 4.1. Turkey
- 4.2. Israel
- 4.3. GCC
- 4.4. North Africa
- 4.5. South Africa
- 4.6. Rest of Middle East & Africa
-
5. Asia Pacific
- 5.1. China
- 5.2. India
- 5.3. Japan
- 5.4. South Korea
- 5.5. ASEAN
- 5.6. Oceania
- 5.7. Rest of Asia Pacific
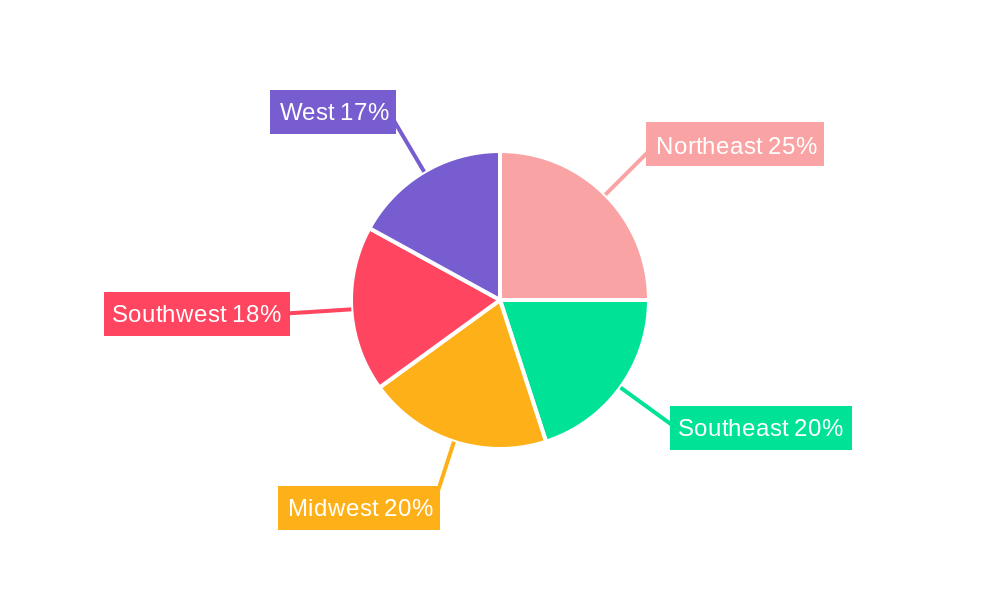
US Transformer Industry Regional Market Share
Geographic Coverage of US Transformer Industry
US Transformer Industry REPORT HIGHLIGHTS
| Aspects | Details |
|---|---|
| Study Period | 2020-2034 |
| Base Year | 2025 |
| Estimated Year | 2026 |
| Forecast Period | 2026-2034 |
| Historical Period | 2020-2025 |
| Growth Rate | CAGR of 9.95% from 2020-2034 |
| Segmentation |
|
Table of Contents
- 1. Introduction
- 1.1. Research Scope
- 1.2. Market Segmentation
- 1.3. Research Methodology
- 1.4. Definitions and Assumptions
- 2. Executive Summary
- 2.1. Introduction
- 3. Market Dynamics
- 3.1. Introduction
- 3.2. Market Drivers
- 3.2.1. 4.; Increasing Natural Gas Demand4.; Rising Pipeline Network and Associated Infrastructure Development
- 3.3. Market Restrains
- 3.3.1. 4.; Rising Shift toward Renewable Energy
- 3.4. Market Trends
- 3.4.1. Distribution Transformer Expected to Dominate the Market
- 4. Market Factor Analysis
- 4.1. Porters Five Forces
- 4.2. Supply/Value Chain
- 4.3. PESTEL analysis
- 4.4. Market Entropy
- 4.5. Patent/Trademark Analysis
- 5. Global US Transformer Industry Analysis, Insights and Forecast, 2020-2032
- 5.1. Market Analysis, Insights and Forecast - by Production Analysis
- 5.2. Market Analysis, Insights and Forecast - by Consumption Analysis
- 5.3. Market Analysis, Insights and Forecast - by Import Market Analysis (Value & Volume)
- 5.4. Market Analysis, Insights and Forecast - by Export Market Analysis (Value & Volume)
- 5.5. Market Analysis, Insights and Forecast - by Price Trend Analysis
- 5.6. Market Analysis, Insights and Forecast - by Region
- 5.6.1. North America
- 5.6.2. South America
- 5.6.3. Europe
- 5.6.4. Middle East & Africa
- 5.6.5. Asia Pacific
- 5.1. Market Analysis, Insights and Forecast - by Production Analysis
- 6. North America US Transformer Industry Analysis, Insights and Forecast, 2020-2032
- 6.1. Market Analysis, Insights and Forecast - by Production Analysis
- 6.2. Market Analysis, Insights and Forecast - by Consumption Analysis
- 6.3. Market Analysis, Insights and Forecast - by Import Market Analysis (Value & Volume)
- 6.4. Market Analysis, Insights and Forecast - by Export Market Analysis (Value & Volume)
- 6.5. Market Analysis, Insights and Forecast - by Price Trend Analysis
- 6.1. Market Analysis, Insights and Forecast - by Production Analysis
- 7. South America US Transformer Industry Analysis, Insights and Forecast, 2020-2032
- 7.1. Market Analysis, Insights and Forecast - by Production Analysis
- 7.2. Market Analysis, Insights and Forecast - by Consumption Analysis
- 7.3. Market Analysis, Insights and Forecast - by Import Market Analysis (Value & Volume)
- 7.4. Market Analysis, Insights and Forecast - by Export Market Analysis (Value & Volume)
- 7.5. Market Analysis, Insights and Forecast - by Price Trend Analysis
- 7.1. Market Analysis, Insights and Forecast - by Production Analysis
- 8. Europe US Transformer Industry Analysis, Insights and Forecast, 2020-2032
- 8.1. Market Analysis, Insights and Forecast - by Production Analysis
- 8.2. Market Analysis, Insights and Forecast - by Consumption Analysis
- 8.3. Market Analysis, Insights and Forecast - by Import Market Analysis (Value & Volume)
- 8.4. Market Analysis, Insights and Forecast - by Export Market Analysis (Value & Volume)
- 8.5. Market Analysis, Insights and Forecast - by Price Trend Analysis
- 8.1. Market Analysis, Insights and Forecast - by Production Analysis
- 9. Middle East & Africa US Transformer Industry Analysis, Insights and Forecast, 2020-2032
- 9.1. Market Analysis, Insights and Forecast - by Production Analysis
- 9.2. Market Analysis, Insights and Forecast - by Consumption Analysis
- 9.3. Market Analysis, Insights and Forecast - by Import Market Analysis (Value & Volume)
- 9.4. Market Analysis, Insights and Forecast - by Export Market Analysis (Value & Volume)
- 9.5. Market Analysis, Insights and Forecast - by Price Trend Analysis
- 9.1. Market Analysis, Insights and Forecast - by Production Analysis
- 10. Asia Pacific US Transformer Industry Analysis, Insights and Forecast, 2020-2032
- 10.1. Market Analysis, Insights and Forecast - by Production Analysis
- 10.2. Market Analysis, Insights and Forecast - by Consumption Analysis
- 10.3. Market Analysis, Insights and Forecast - by Import Market Analysis (Value & Volume)
- 10.4. Market Analysis, Insights and Forecast - by Export Market Analysis (Value & Volume)
- 10.5. Market Analysis, Insights and Forecast - by Price Trend Analysis
- 10.1. Market Analysis, Insights and Forecast - by Production Analysis
- 11. Competitive Analysis
- 11.1. Global Market Share Analysis 2025
- 11.2. Company Profiles
- 11.2.1 ABB Ltd
- 11.2.1.1. Overview
- 11.2.1.2. Products
- 11.2.1.3. SWOT Analysis
- 11.2.1.4. Recent Developments
- 11.2.1.5. Financials (Based on Availability)
- 11.2.2 Toshiba Corp*List Not Exhaustive
- 11.2.2.1. Overview
- 11.2.2.2. Products
- 11.2.2.3. SWOT Analysis
- 11.2.2.4. Recent Developments
- 11.2.2.5. Financials (Based on Availability)
- 11.2.3 Hitachi Ltd
- 11.2.3.1. Overview
- 11.2.3.2. Products
- 11.2.3.3. SWOT Analysis
- 11.2.3.4. Recent Developments
- 11.2.3.5. Financials (Based on Availability)
- 11.2.4 Emerson Electric Co
- 11.2.4.1. Overview
- 11.2.4.2. Products
- 11.2.4.3. SWOT Analysis
- 11.2.4.4. Recent Developments
- 11.2.4.5. Financials (Based on Availability)
- 11.2.5 Mitsubishi Electric Corporation
- 11.2.5.1. Overview
- 11.2.5.2. Products
- 11.2.5.3. SWOT Analysis
- 11.2.5.4. Recent Developments
- 11.2.5.5. Financials (Based on Availability)
- 11.2.6 Siemens AG
- 11.2.6.1. Overview
- 11.2.6.2. Products
- 11.2.6.3. SWOT Analysis
- 11.2.6.4. Recent Developments
- 11.2.6.5. Financials (Based on Availability)
- 11.2.7 Schneider Electric SE
- 11.2.7.1. Overview
- 11.2.7.2. Products
- 11.2.7.3. SWOT Analysis
- 11.2.7.4. Recent Developments
- 11.2.7.5. Financials (Based on Availability)
- 11.2.8 Eaton Corporation PLC
- 11.2.8.1. Overview
- 11.2.8.2. Products
- 11.2.8.3. SWOT Analysis
- 11.2.8.4. Recent Developments
- 11.2.8.5. Financials (Based on Availability)
- 11.2.9 General Electric Company
- 11.2.9.1. Overview
- 11.2.9.2. Products
- 11.2.9.3. SWOT Analysis
- 11.2.9.4. Recent Developments
- 11.2.9.5. Financials (Based on Availability)
- 11.2.10 Panasonic Corporation
- 11.2.10.1. Overview
- 11.2.10.2. Products
- 11.2.10.3. SWOT Analysis
- 11.2.10.4. Recent Developments
- 11.2.10.5. Financials (Based on Availability)
- 11.2.1 ABB Ltd
List of Figures
- Figure 1: Global US Transformer Industry Revenue Breakdown (billion, %) by Region 2025 & 2033
- Figure 2: North America US Transformer Industry Revenue (billion), by Production Analysis 2025 & 2033
- Figure 3: North America US Transformer Industry Revenue Share (%), by Production Analysis 2025 & 2033
- Figure 4: North America US Transformer Industry Revenue (billion), by Consumption Analysis 2025 & 2033
- Figure 5: North America US Transformer Industry Revenue Share (%), by Consumption Analysis 2025 & 2033
- Figure 6: North America US Transformer Industry Revenue (billion), by Import Market Analysis (Value & Volume) 2025 & 2033
- Figure 7: North America US Transformer Industry Revenue Share (%), by Import Market Analysis (Value & Volume) 2025 & 2033
- Figure 8: North America US Transformer Industry Revenue (billion), by Export Market Analysis (Value & Volume) 2025 & 2033
- Figure 9: North America US Transformer Industry Revenue Share (%), by Export Market Analysis (Value & Volume) 2025 & 2033
- Figure 10: North America US Transformer Industry Revenue (billion), by Price Trend Analysis 2025 & 2033
- Figure 11: North America US Transformer Industry Revenue Share (%), by Price Trend Analysis 2025 & 2033
- Figure 12: North America US Transformer Industry Revenue (billion), by Country 2025 & 2033
- Figure 13: North America US Transformer Industry Revenue Share (%), by Country 2025 & 2033
- Figure 14: South America US Transformer Industry Revenue (billion), by Production Analysis 2025 & 2033
- Figure 15: South America US Transformer Industry Revenue Share (%), by Production Analysis 2025 & 2033
- Figure 16: South America US Transformer Industry Revenue (billion), by Consumption Analysis 2025 & 2033
- Figure 17: South America US Transformer Industry Revenue Share (%), by Consumption Analysis 2025 & 2033
- Figure 18: South America US Transformer Industry Revenue (billion), by Import Market Analysis (Value & Volume) 2025 & 2033
- Figure 19: South America US Transformer Industry Revenue Share (%), by Import Market Analysis (Value & Volume) 2025 & 2033
- Figure 20: South America US Transformer Industry Revenue (billion), by Export Market Analysis (Value & Volume) 2025 & 2033
- Figure 21: South America US Transformer Industry Revenue Share (%), by Export Market Analysis (Value & Volume) 2025 & 2033
- Figure 22: South America US Transformer Industry Revenue (billion), by Price Trend Analysis 2025 & 2033
- Figure 23: South America US Transformer Industry Revenue Share (%), by Price Trend Analysis 2025 & 2033
- Figure 24: South America US Transformer Industry Revenue (billion), by Country 2025 & 2033
- Figure 25: South America US Transformer Industry Revenue Share (%), by Country 2025 & 2033
- Figure 26: Europe US Transformer Industry Revenue (billion), by Production Analysis 2025 & 2033
- Figure 27: Europe US Transformer Industry Revenue Share (%), by Production Analysis 2025 & 2033
- Figure 28: Europe US Transformer Industry Revenue (billion), by Consumption Analysis 2025 & 2033
- Figure 29: Europe US Transformer Industry Revenue Share (%), by Consumption Analysis 2025 & 2033
- Figure 30: Europe US Transformer Industry Revenue (billion), by Import Market Analysis (Value & Volume) 2025 & 2033
- Figure 31: Europe US Transformer Industry Revenue Share (%), by Import Market Analysis (Value & Volume) 2025 & 2033
- Figure 32: Europe US Transformer Industry Revenue (billion), by Export Market Analysis (Value & Volume) 2025 & 2033
- Figure 33: Europe US Transformer Industry Revenue Share (%), by Export Market Analysis (Value & Volume) 2025 & 2033
- Figure 34: Europe US Transformer Industry Revenue (billion), by Price Trend Analysis 2025 & 2033
- Figure 35: Europe US Transformer Industry Revenue Share (%), by Price Trend Analysis 2025 & 2033
- Figure 36: Europe US Transformer Industry Revenue (billion), by Country 2025 & 2033
- Figure 37: Europe US Transformer Industry Revenue Share (%), by Country 2025 & 2033
- Figure 38: Middle East & Africa US Transformer Industry Revenue (billion), by Production Analysis 2025 & 2033
- Figure 39: Middle East & Africa US Transformer Industry Revenue Share (%), by Production Analysis 2025 & 2033
- Figure 40: Middle East & Africa US Transformer Industry Revenue (billion), by Consumption Analysis 2025 & 2033
- Figure 41: Middle East & Africa US Transformer Industry Revenue Share (%), by Consumption Analysis 2025 & 2033
- Figure 42: Middle East & Africa US Transformer Industry Revenue (billion), by Import Market Analysis (Value & Volume) 2025 & 2033
- Figure 43: Middle East & Africa US Transformer Industry Revenue Share (%), by Import Market Analysis (Value & Volume) 2025 & 2033
- Figure 44: Middle East & Africa US Transformer Industry Revenue (billion), by Export Market Analysis (Value & Volume) 2025 & 2033
- Figure 45: Middle East & Africa US Transformer Industry Revenue Share (%), by Export Market Analysis (Value & Volume) 2025 & 2033
- Figure 46: Middle East & Africa US Transformer Industry Revenue (billion), by Price Trend Analysis 2025 & 2033
- Figure 47: Middle East & Africa US Transformer Industry Revenue Share (%), by Price Trend Analysis 2025 & 2033
- Figure 48: Middle East & Africa US Transformer Industry Revenue (billion), by Country 2025 & 2033
- Figure 49: Middle East & Africa US Transformer Industry Revenue Share (%), by Country 2025 & 2033
- Figure 50: Asia Pacific US Transformer Industry Revenue (billion), by Production Analysis 2025 & 2033
- Figure 51: Asia Pacific US Transformer Industry Revenue Share (%), by Production Analysis 2025 & 2033
- Figure 52: Asia Pacific US Transformer Industry Revenue (billion), by Consumption Analysis 2025 & 2033
- Figure 53: Asia Pacific US Transformer Industry Revenue Share (%), by Consumption Analysis 2025 & 2033
- Figure 54: Asia Pacific US Transformer Industry Revenue (billion), by Import Market Analysis (Value & Volume) 2025 & 2033
- Figure 55: Asia Pacific US Transformer Industry Revenue Share (%), by Import Market Analysis (Value & Volume) 2025 & 2033
- Figure 56: Asia Pacific US Transformer Industry Revenue (billion), by Export Market Analysis (Value & Volume) 2025 & 2033
- Figure 57: Asia Pacific US Transformer Industry Revenue Share (%), by Export Market Analysis (Value & Volume) 2025 & 2033
- Figure 58: Asia Pacific US Transformer Industry Revenue (billion), by Price Trend Analysis 2025 & 2033
- Figure 59: Asia Pacific US Transformer Industry Revenue Share (%), by Price Trend Analysis 2025 & 2033
- Figure 60: Asia Pacific US Transformer Industry Revenue (billion), by Country 2025 & 2033
- Figure 61: Asia Pacific US Transformer Industry Revenue Share (%), by Country 2025 & 2033
List of Tables
- Table 1: Global US Transformer Industry Revenue billion Forecast, by Production Analysis 2020 & 2033
- Table 2: Global US Transformer Industry Revenue billion Forecast, by Consumption Analysis 2020 & 2033
- Table 3: Global US Transformer Industry Revenue billion Forecast, by Import Market Analysis (Value & Volume) 2020 & 2033
- Table 4: Global US Transformer Industry Revenue billion Forecast, by Export Market Analysis (Value & Volume) 2020 & 2033
- Table 5: Global US Transformer Industry Revenue billion Forecast, by Price Trend Analysis 2020 & 2033
- Table 6: Global US Transformer Industry Revenue billion Forecast, by Region 2020 & 2033
- Table 7: Global US Transformer Industry Revenue billion Forecast, by Production Analysis 2020 & 2033
- Table 8: Global US Transformer Industry Revenue billion Forecast, by Consumption Analysis 2020 & 2033
- Table 9: Global US Transformer Industry Revenue billion Forecast, by Import Market Analysis (Value & Volume) 2020 & 2033
- Table 10: Global US Transformer Industry Revenue billion Forecast, by Export Market Analysis (Value & Volume) 2020 & 2033
- Table 11: Global US Transformer Industry Revenue billion Forecast, by Price Trend Analysis 2020 & 2033
- Table 12: Global US Transformer Industry Revenue billion Forecast, by Country 2020 & 2033
- Table 13: United States US Transformer Industry Revenue (billion) Forecast, by Application 2020 & 2033
- Table 14: Canada US Transformer Industry Revenue (billion) Forecast, by Application 2020 & 2033
- Table 15: Mexico US Transformer Industry Revenue (billion) Forecast, by Application 2020 & 2033
- Table 16: Global US Transformer Industry Revenue billion Forecast, by Production Analysis 2020 & 2033
- Table 17: Global US Transformer Industry Revenue billion Forecast, by Consumption Analysis 2020 & 2033
- Table 18: Global US Transformer Industry Revenue billion Forecast, by Import Market Analysis (Value & Volume) 2020 & 2033
- Table 19: Global US Transformer Industry Revenue billion Forecast, by Export Market Analysis (Value & Volume) 2020 & 2033
- Table 20: Global US Transformer Industry Revenue billion Forecast, by Price Trend Analysis 2020 & 2033
- Table 21: Global US Transformer Industry Revenue billion Forecast, by Country 2020 & 2033
- Table 22: Brazil US Transformer Industry Revenue (billion) Forecast, by Application 2020 & 2033
- Table 23: Argentina US Transformer Industry Revenue (billion) Forecast, by Application 2020 & 2033
- Table 24: Rest of South America US Transformer Industry Revenue (billion) Forecast, by Application 2020 & 2033
- Table 25: Global US Transformer Industry Revenue billion Forecast, by Production Analysis 2020 & 2033
- Table 26: Global US Transformer Industry Revenue billion Forecast, by Consumption Analysis 2020 & 2033
- Table 27: Global US Transformer Industry Revenue billion Forecast, by Import Market Analysis (Value & Volume) 2020 & 2033
- Table 28: Global US Transformer Industry Revenue billion Forecast, by Export Market Analysis (Value & Volume) 2020 & 2033
- Table 29: Global US Transformer Industry Revenue billion Forecast, by Price Trend Analysis 2020 & 2033
- Table 30: Global US Transformer Industry Revenue billion Forecast, by Country 2020 & 2033
- Table 31: United Kingdom US Transformer Industry Revenue (billion) Forecast, by Application 2020 & 2033
- Table 32: Germany US Transformer Industry Revenue (billion) Forecast, by Application 2020 & 2033
- Table 33: France US Transformer Industry Revenue (billion) Forecast, by Application 2020 & 2033
- Table 34: Italy US Transformer Industry Revenue (billion) Forecast, by Application 2020 & 2033
- Table 35: Spain US Transformer Industry Revenue (billion) Forecast, by Application 2020 & 2033
- Table 36: Russia US Transformer Industry Revenue (billion) Forecast, by Application 2020 & 2033
- Table 37: Benelux US Transformer Industry Revenue (billion) Forecast, by Application 2020 & 2033
- Table 38: Nordics US Transformer Industry Revenue (billion) Forecast, by Application 2020 & 2033
- Table 39: Rest of Europe US Transformer Industry Revenue (billion) Forecast, by Application 2020 & 2033
- Table 40: Global US Transformer Industry Revenue billion Forecast, by Production Analysis 2020 & 2033
- Table 41: Global US Transformer Industry Revenue billion Forecast, by Consumption Analysis 2020 & 2033
- Table 42: Global US Transformer Industry Revenue billion Forecast, by Import Market Analysis (Value & Volume) 2020 & 2033
- Table 43: Global US Transformer Industry Revenue billion Forecast, by Export Market Analysis (Value & Volume) 2020 & 2033
- Table 44: Global US Transformer Industry Revenue billion Forecast, by Price Trend Analysis 2020 & 2033
- Table 45: Global US Transformer Industry Revenue billion Forecast, by Country 2020 & 2033
- Table 46: Turkey US Transformer Industry Revenue (billion) Forecast, by Application 2020 & 2033
- Table 47: Israel US Transformer Industry Revenue (billion) Forecast, by Application 2020 & 2033
- Table 48: GCC US Transformer Industry Revenue (billion) Forecast, by Application 2020 & 2033
- Table 49: North Africa US Transformer Industry Revenue (billion) Forecast, by Application 2020 & 2033
- Table 50: South Africa US Transformer Industry Revenue (billion) Forecast, by Application 2020 & 2033
- Table 51: Rest of Middle East & Africa US Transformer Industry Revenue (billion) Forecast, by Application 2020 & 2033
- Table 52: Global US Transformer Industry Revenue billion Forecast, by Production Analysis 2020 & 2033
- Table 53: Global US Transformer Industry Revenue billion Forecast, by Consumption Analysis 2020 & 2033
- Table 54: Global US Transformer Industry Revenue billion Forecast, by Import Market Analysis (Value & Volume) 2020 & 2033
- Table 55: Global US Transformer Industry Revenue billion Forecast, by Export Market Analysis (Value & Volume) 2020 & 2033
- Table 56: Global US Transformer Industry Revenue billion Forecast, by Price Trend Analysis 2020 & 2033
- Table 57: Global US Transformer Industry Revenue billion Forecast, by Country 2020 & 2033
- Table 58: China US Transformer Industry Revenue (billion) Forecast, by Application 2020 & 2033
- Table 59: India US Transformer Industry Revenue (billion) Forecast, by Application 2020 & 2033
- Table 60: Japan US Transformer Industry Revenue (billion) Forecast, by Application 2020 & 2033
- Table 61: South Korea US Transformer Industry Revenue (billion) Forecast, by Application 2020 & 2033
- Table 62: ASEAN US Transformer Industry Revenue (billion) Forecast, by Application 2020 & 2033
- Table 63: Oceania US Transformer Industry Revenue (billion) Forecast, by Application 2020 & 2033
- Table 64: Rest of Asia Pacific US Transformer Industry Revenue (billion) Forecast, by Application 2020 & 2033
Frequently Asked Questions
1. What is the projected Compound Annual Growth Rate (CAGR) of the US Transformer Industry?
The projected CAGR is approximately 9.95%.
2. Which companies are prominent players in the US Transformer Industry?
Key companies in the market include ABB Ltd, Toshiba Corp*List Not Exhaustive, Hitachi Ltd, Emerson Electric Co, Mitsubishi Electric Corporation, Siemens AG, Schneider Electric SE, Eaton Corporation PLC, General Electric Company, Panasonic Corporation.
3. What are the main segments of the US Transformer Industry?
The market segments include Production Analysis, Consumption Analysis, Import Market Analysis (Value & Volume), Export Market Analysis (Value & Volume), Price Trend Analysis.
4. Can you provide details about the market size?
The market size is estimated to be USD 70.9 billion as of 2022.
5. What are some drivers contributing to market growth?
4.; Increasing Natural Gas Demand4.; Rising Pipeline Network and Associated Infrastructure Development.
6. What are the notable trends driving market growth?
Distribution Transformer Expected to Dominate the Market.
7. Are there any restraints impacting market growth?
4.; Rising Shift toward Renewable Energy.
8. Can you provide examples of recent developments in the market?
December 2022: Hitachi Energy announced plans to invest more than USD 37 million in the expansion and modernization of its power transformer manufacturing facility in South Boston, Virginia, to meet rapidly growing demand from utility customers and for applications such as renewable energy generation and data centers.
9. What pricing options are available for accessing the report?
Pricing options include single-user, multi-user, and enterprise licenses priced at USD 3800, USD 4500, and USD 5800 respectively.
10. Is the market size provided in terms of value or volume?
The market size is provided in terms of value, measured in billion.
11. Are there any specific market keywords associated with the report?
Yes, the market keyword associated with the report is "US Transformer Industry," which aids in identifying and referencing the specific market segment covered.
12. How do I determine which pricing option suits my needs best?
The pricing options vary based on user requirements and access needs. Individual users may opt for single-user licenses, while businesses requiring broader access may choose multi-user or enterprise licenses for cost-effective access to the report.
13. Are there any additional resources or data provided in the US Transformer Industry report?
While the report offers comprehensive insights, it's advisable to review the specific contents or supplementary materials provided to ascertain if additional resources or data are available.
14. How can I stay updated on further developments or reports in the US Transformer Industry?
To stay informed about further developments, trends, and reports in the US Transformer Industry, consider subscribing to industry newsletters, following relevant companies and organizations, or regularly checking reputable industry news sources and publications.
Methodology
Step 1 - Identification of Relevant Samples Size from Population Database


Step 2 - Approaches for Defining Global Market Size (Value, Volume* & Price*)

Note*: In applicable scenarios
Step 3 - Data Sources
Primary Research
- Web Analytics
- Survey Reports
- Research Institute
- Latest Research Reports
- Opinion Leaders
Secondary Research
- Annual Reports
- White Paper
- Latest Press Release
- Industry Association
- Paid Database
- Investor Presentations

Step 4 - Data Triangulation
Involves using different sources of information in order to increase the validity of a study
These sources are likely to be stakeholders in a program - participants, other researchers, program staff, other community members, and so on.
Then we put all data in single framework & apply various statistical tools to find out the dynamic on the market.
During the analysis stage, feedback from the stakeholder groups would be compared to determine areas of agreement as well as areas of divergence