

Key Insights
The Vanadium Redox Battery (VRB) market is projected for significant expansion, driven by the escalating demand for advanced energy storage solutions. The market is currently valued at $262.45 million and is anticipated to grow at a Compound Annual Growth Rate (CAGR) of 54.94% from the base year 2025 through 2033. This robust growth is underpinned by the increasing integration of renewable energy sources, the critical need for grid stabilization, and supportive government policies promoting clean energy adoption. VRBs offer superior performance characteristics, including extended lifespan, deep discharge capabilities, rapid response times, and enhanced safety, making them an ideal choice for renewable energy intermittency management and improved power quality across utility and commercial sectors. Key applications span utility-scale storage, microgrids, data centers, and industrial backup power. Geographically, North America, Europe, and Asia-Pacific are expected to lead market penetration due to substantial investments in renewable energy infrastructure and early adoption trends. While initial capital costs and vanadium resource availability present challenges, ongoing technological advancements focused on cost reduction and efficiency improvements are poised to accelerate VRB market growth.
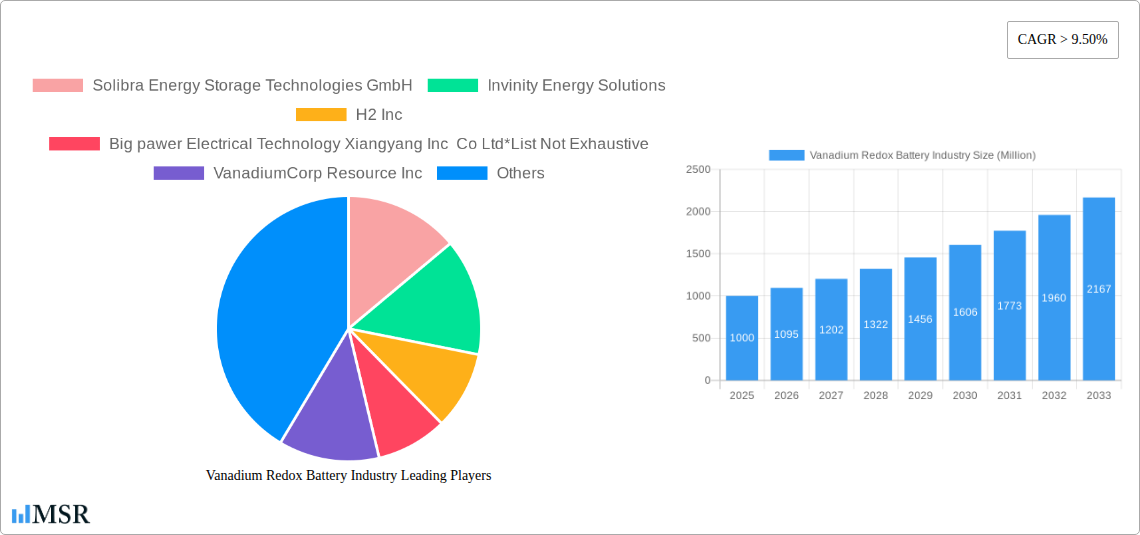
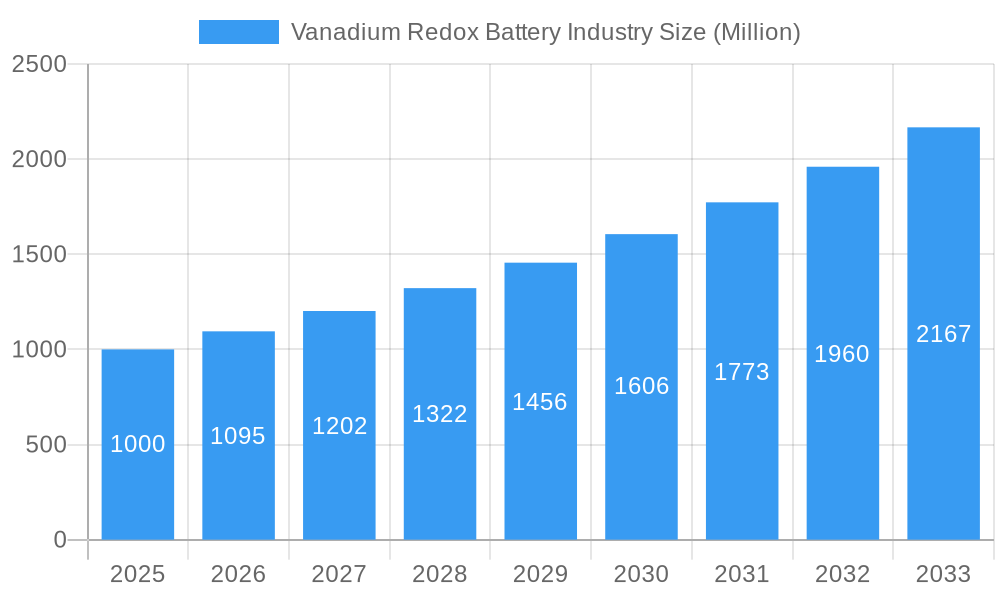
Vanadium Redox Battery Industry Market Size (In Million)
The competitive VRB market features a dynamic interplay between established industry leaders and innovative emerging enterprises. Key players such as Solibra Energy Storage Technologies GmbH, Invinity Energy Solutions, H2 Inc, Big Power Electrical Technology Xiangyang Inc Co Ltd, VanadiumCorp Resource Inc, UniEnergy Technologies, and VRB Energy are actively engaged in technological innovation, capacity expansion, and strategic collaborations. The industry's trajectory is marked by both competitive pressures and collaborative efforts aimed at advancing VRB technology, enhancing energy density, extending cycle life, and reducing manufacturing costs. These advancements are crucial for increasing VRB competitiveness and broadening their application scope, further solidifying their role in the global energy transition.
Vanadium Redox Battery Industry Company Market Share
Vanadium Redox Battery Industry: A Comprehensive Market Report (2019-2033)
This in-depth report provides a comprehensive analysis of the vanadium redox battery (VRB) industry, offering invaluable insights for stakeholders, investors, and industry professionals. Covering the period from 2019 to 2033, with a focus on 2025, this report meticulously examines market dynamics, technological advancements, and key players shaping this rapidly evolving sector. The report incorporates extensive data analysis, forecasting, and expert opinions to provide actionable strategies for navigating the complexities of the VRB market. Expect detailed insights into market size, CAGR, M&A activity, and future growth projections.
Vanadium Redox Battery Industry Market Concentration & Dynamics
The Vanadium Redox Battery (VRB) market is experiencing significant growth, driven by increasing demand for energy storage solutions. Market concentration is currently moderate, with several key players vying for market share. The innovation ecosystem is vibrant, with ongoing research and development efforts focused on improving battery efficiency, lifespan, and cost-effectiveness. Regulatory frameworks are evolving, with governments worldwide implementing policies to support the adoption of renewable energy and energy storage technologies. Substitute products, such as lithium-ion batteries, pose a competitive challenge, while advancements in VRB technology are countering this threat. End-user trends indicate a strong demand from the utility sector, followed by commercial and other applications. M&A activities are increasing, reflecting industry consolidation and strategic partnerships to accelerate growth.
- Market Share: The top 5 players account for approximately xx% of the global market in 2025.
- M&A Deal Count: xx deals were recorded between 2019 and 2024, with a projected xx deals for 2025-2033.
- Key Innovation Areas: Improved electrolyte solutions, enhanced cell designs, and advanced control systems.
- Regulatory Landscape: Government incentives and mandates for renewable energy integration are boosting market growth.
Vanadium Redox Battery Industry Insights & Trends
The global vanadium redox battery market size was valued at USD xx Million in 2024 and is projected to reach USD xx Million by 2033, exhibiting a CAGR of xx% during the forecast period (2025-2033). This robust growth is fueled by several key factors. The increasing adoption of renewable energy sources, coupled with the need for reliable energy storage, is a significant driver. Technological advancements, such as improved energy density and reduced costs, are further enhancing the market appeal of VRBs. Evolving consumer behaviors, particularly a growing emphasis on sustainability and environmental responsibility, are also contributing to this growth trajectory. The market is experiencing technological disruptions in the form of improved material science and manufacturing processes which is pushing down costs and improving performance. Fluctuations in vanadium prices remain a challenge but advancements in vanadium extraction and recycling are expected to mitigate this in the future.
Key Markets & Segments Leading Vanadium Redox Battery Industry
The utility sector is currently the dominant end-user segment for VRBs, accounting for xx% of the total market in 2025. This segment is propelled by the growing need for grid-scale energy storage to manage the intermittency of renewable energy sources. Commercial applications are also experiencing significant growth, driven by the increasing demand for backup power and energy efficiency in various sectors. The “Others” segment, encompassing niche applications such as microgrids and off-grid systems, is also demonstrating growth potential.
- Utility Sector Drivers:
- Increasing renewable energy penetration.
- Need for grid stabilization and improved reliability.
- Government incentives and policies supporting energy storage deployment.
- Commercial Sector Drivers:
- Rising demand for backup power and uninterrupted power supply (UPS) systems.
- Focus on energy efficiency and cost savings.
- Growing adoption of microgrids and distributed energy resources.
The key region for VRB adoption is currently North America, followed by Europe and Asia Pacific. North America's leadership stems from supportive government policies, abundant renewable energy resources, and a strong focus on grid modernization. Europe's growth is fueled by similar factors along with stringent emission reduction targets. Asia-Pacific is anticipated to witness rapid growth in the coming years due to large-scale renewable energy projects and rising energy demand.
Vanadium Redox Battery Industry Product Developments
Recent advancements in VRB technology focus on enhancing energy density, lifespan, and cost-effectiveness. Innovations in electrolyte solutions, membrane technology, and cell design are driving improvements in performance and efficiency. VRBs are finding increasing applications in grid-scale energy storage, backup power systems, and microgrids. These advancements provide competitive advantages, offering longer lifespans, superior cycle life, and higher safety compared to alternative battery technologies.
Challenges in the Vanadium Redox Battery Industry Market
The VRB industry faces several challenges, including the relatively high initial capital cost compared to lithium-ion batteries, the limited availability of high-purity vanadium, and the need for robust and reliable infrastructure for vanadium sourcing and processing. Regulatory hurdles and standardization issues also pose obstacles to market penetration. Supply chain complexities, particularly regarding vanadium sourcing, can lead to price volatility and potentially impact profitability. Intense competition from other energy storage technologies further presents a market challenge. These factors contribute to an estimated xx% market penetration barrier in 2025.
Forces Driving Vanadium Redox Battery Industry Growth
Several key factors are driving the growth of the VRB industry. Technological advancements, leading to improved performance and reduced costs, are significant contributors. The increasing adoption of renewable energy sources and the need for reliable energy storage are fueling demand. Favorable government policies and regulatory frameworks are further boosting market growth. The development of new applications, particularly in grid-scale energy storage and microgrids, continues to expand the market’s potential. For example, the growing number of government initiatives offering subsidies and tax breaks for renewable energy adoption indirectly supports the VRB market.
Long-Term Growth Catalysts in the Vanadium Redox Battery Industry Market
Long-term growth in the VRB industry hinges on ongoing technological innovations that reduce costs, enhance performance, and improve scalability. Strategic partnerships and collaborations between battery manufacturers, material suppliers, and energy companies are crucial for fostering innovation and driving market expansion. The development of efficient vanadium recycling processes will help alleviate reliance on primary vanadium sources and mitigate the impact of price fluctuations. Expansion into new geographical markets with supportive regulatory environments will be instrumental in unlocking the VRB industry's full potential.
Emerging Opportunities in Vanadium Redox Battery Industry
Emerging opportunities lie in the development of new applications for VRBs, including the integration with smart grids and the expansion into developing economies with growing energy demands. The development of more efficient and cost-effective manufacturing processes will further enhance market potential. The growing demand for long-duration energy storage solutions, particularly for applications requiring extended periods of power autonomy, represents a lucrative market niche for VRBs. Exploration of novel vanadium sources and improved vanadium extraction technologies are key to mitigating supply chain risks.
Leading Players in the Vanadium Redox Battery Industry Sector
- Solibra Energy Storage Technologies GmbH
- Invinity Energy Solutions
- H2 Inc
- Big pawer Electrical Technology Xiangyang Inc Co Ltd
- VanadiumCorp Resource Inc
- UniEnergy Technologies
- VRB Energy
Key Milestones in Vanadium Redox Battery Industry
- November 2022: North Harbour Clean Energy PTY Ltd. and CellCube sign a strategic manufacturing cooperation agreement in Australia, targeting an initial production capacity of 40-160 megawatt-hours per year, with a long-term goal of up to 8,000 megawatt-hours. A 4-16 megawatt-hour VRB system, set to be Australia's largest, is also planned.
- November 2022: The Viejas Tribe of Kumeyaay Indians secures a USD 31 Million grant from the California Energy Commission to construct a 60 MWh long-duration energy storage system incorporating a 10 MWh vanadium redox flow battery from Infinity Energy Systems.
Strategic Outlook for Vanadium Redox Battery Industry Market
The future of the VRB industry looks promising, with significant growth potential driven by technological innovation, supportive government policies, and the increasing demand for sustainable energy solutions. Strategic opportunities abound for companies focusing on cost reduction, performance enhancement, and market expansion. Companies that can successfully navigate the challenges related to vanadium sourcing, manufacturing scalability, and competition from other battery technologies are poised to capture substantial market share in the coming years. The long-term outlook remains positive, with the VRB market expected to experience substantial growth and become a crucial component of the global energy landscape.
Vanadium Redox Battery Industry Segmentation
-
1. End-User
- 1.1. Utility
- 1.2. Commercial
- 1.3. Others
Vanadium Redox Battery Industry Segmentation By Geography
- 1. North America
- 2. Europe
- 3. Asia Pacific
- 4. South America
- 5. Middle East and Africa
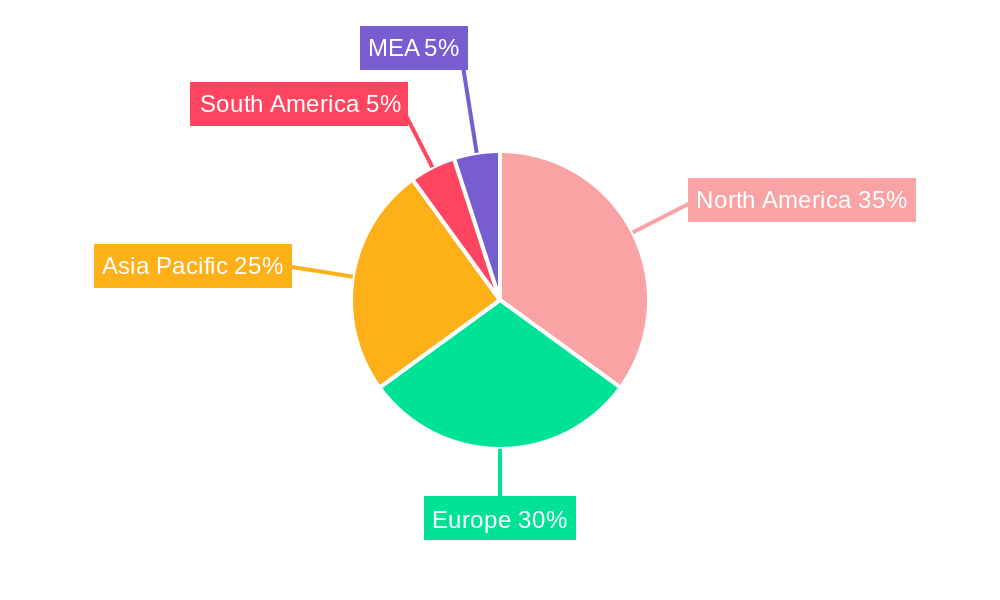
Vanadium Redox Battery Industry Regional Market Share
Geographic Coverage of Vanadium Redox Battery Industry
Vanadium Redox Battery Industry REPORT HIGHLIGHTS
| Aspects | Details |
|---|---|
| Study Period | 2020-2034 |
| Base Year | 2025 |
| Estimated Year | 2026 |
| Forecast Period | 2026-2034 |
| Historical Period | 2020-2025 |
| Growth Rate | CAGR of 54.94% from 2020-2034 |
| Segmentation |
|
Table of Contents
- 1. Introduction
- 1.1. Research Scope
- 1.2. Market Segmentation
- 1.3. Research Methodology
- 1.4. Definitions and Assumptions
- 2. Executive Summary
- 2.1. Introduction
- 3. Market Dynamics
- 3.1. Introduction
- 3.2. Market Drivers
- 3.2.1. 4.; Growing Penetration of the Technology in Long-Duration Energy Storage Applications4.; Increasing Adoption of Renewable Energy
- 3.3. Market Restrains
- 3.3.1. 4.; Low Energy of Battery Cells
- 3.4. Market Trends
- 3.4.1. Utility Sector to Witness Significant Growth
- 4. Market Factor Analysis
- 4.1. Porters Five Forces
- 4.2. Supply/Value Chain
- 4.3. PESTEL analysis
- 4.4. Market Entropy
- 4.5. Patent/Trademark Analysis
- 5. Global Vanadium Redox Battery Industry Analysis, Insights and Forecast, 2020-2032
- 5.1. Market Analysis, Insights and Forecast - by End-User
- 5.1.1. Utility
- 5.1.2. Commercial
- 5.1.3. Others
- 5.2. Market Analysis, Insights and Forecast - by Region
- 5.2.1. North America
- 5.2.2. Europe
- 5.2.3. Asia Pacific
- 5.2.4. South America
- 5.2.5. Middle East and Africa
- 5.1. Market Analysis, Insights and Forecast - by End-User
- 6. North America Vanadium Redox Battery Industry Analysis, Insights and Forecast, 2020-2032
- 6.1. Market Analysis, Insights and Forecast - by End-User
- 6.1.1. Utility
- 6.1.2. Commercial
- 6.1.3. Others
- 6.1. Market Analysis, Insights and Forecast - by End-User
- 7. Europe Vanadium Redox Battery Industry Analysis, Insights and Forecast, 2020-2032
- 7.1. Market Analysis, Insights and Forecast - by End-User
- 7.1.1. Utility
- 7.1.2. Commercial
- 7.1.3. Others
- 7.1. Market Analysis, Insights and Forecast - by End-User
- 8. Asia Pacific Vanadium Redox Battery Industry Analysis, Insights and Forecast, 2020-2032
- 8.1. Market Analysis, Insights and Forecast - by End-User
- 8.1.1. Utility
- 8.1.2. Commercial
- 8.1.3. Others
- 8.1. Market Analysis, Insights and Forecast - by End-User
- 9. South America Vanadium Redox Battery Industry Analysis, Insights and Forecast, 2020-2032
- 9.1. Market Analysis, Insights and Forecast - by End-User
- 9.1.1. Utility
- 9.1.2. Commercial
- 9.1.3. Others
- 9.1. Market Analysis, Insights and Forecast - by End-User
- 10. Middle East and Africa Vanadium Redox Battery Industry Analysis, Insights and Forecast, 2020-2032
- 10.1. Market Analysis, Insights and Forecast - by End-User
- 10.1.1. Utility
- 10.1.2. Commercial
- 10.1.3. Others
- 10.1. Market Analysis, Insights and Forecast - by End-User
- 11. Competitive Analysis
- 11.1. Global Market Share Analysis 2025
- 11.2. Company Profiles
- 11.2.1 Solibra Energy Storage Technologies GmbH
- 11.2.1.1. Overview
- 11.2.1.2. Products
- 11.2.1.3. SWOT Analysis
- 11.2.1.4. Recent Developments
- 11.2.1.5. Financials (Based on Availability)
- 11.2.2 Invinity Energy Solutions
- 11.2.2.1. Overview
- 11.2.2.2. Products
- 11.2.2.3. SWOT Analysis
- 11.2.2.4. Recent Developments
- 11.2.2.5. Financials (Based on Availability)
- 11.2.3 H2 Inc
- 11.2.3.1. Overview
- 11.2.3.2. Products
- 11.2.3.3. SWOT Analysis
- 11.2.3.4. Recent Developments
- 11.2.3.5. Financials (Based on Availability)
- 11.2.4 Big pawer Electrical Technology Xiangyang Inc Co Ltd*List Not Exhaustive
- 11.2.4.1. Overview
- 11.2.4.2. Products
- 11.2.4.3. SWOT Analysis
- 11.2.4.4. Recent Developments
- 11.2.4.5. Financials (Based on Availability)
- 11.2.5 VanadiumCorp Resource Inc
- 11.2.5.1. Overview
- 11.2.5.2. Products
- 11.2.5.3. SWOT Analysis
- 11.2.5.4. Recent Developments
- 11.2.5.5. Financials (Based on Availability)
- 11.2.6 UniEnergy Technologies
- 11.2.6.1. Overview
- 11.2.6.2. Products
- 11.2.6.3. SWOT Analysis
- 11.2.6.4. Recent Developments
- 11.2.6.5. Financials (Based on Availability)
- 11.2.7 VRB Energy
- 11.2.7.1. Overview
- 11.2.7.2. Products
- 11.2.7.3. SWOT Analysis
- 11.2.7.4. Recent Developments
- 11.2.7.5. Financials (Based on Availability)
- 11.2.1 Solibra Energy Storage Technologies GmbH
List of Figures
- Figure 1: Global Vanadium Redox Battery Industry Revenue Breakdown (million, %) by Region 2025 & 2033
- Figure 2: Global Vanadium Redox Battery Industry Volume Breakdown (K Units, %) by Region 2025 & 2033
- Figure 3: North America Vanadium Redox Battery Industry Revenue (million), by End-User 2025 & 2033
- Figure 4: North America Vanadium Redox Battery Industry Volume (K Units), by End-User 2025 & 2033
- Figure 5: North America Vanadium Redox Battery Industry Revenue Share (%), by End-User 2025 & 2033
- Figure 6: North America Vanadium Redox Battery Industry Volume Share (%), by End-User 2025 & 2033
- Figure 7: North America Vanadium Redox Battery Industry Revenue (million), by Country 2025 & 2033
- Figure 8: North America Vanadium Redox Battery Industry Volume (K Units), by Country 2025 & 2033
- Figure 9: North America Vanadium Redox Battery Industry Revenue Share (%), by Country 2025 & 2033
- Figure 10: North America Vanadium Redox Battery Industry Volume Share (%), by Country 2025 & 2033
- Figure 11: Europe Vanadium Redox Battery Industry Revenue (million), by End-User 2025 & 2033
- Figure 12: Europe Vanadium Redox Battery Industry Volume (K Units), by End-User 2025 & 2033
- Figure 13: Europe Vanadium Redox Battery Industry Revenue Share (%), by End-User 2025 & 2033
- Figure 14: Europe Vanadium Redox Battery Industry Volume Share (%), by End-User 2025 & 2033
- Figure 15: Europe Vanadium Redox Battery Industry Revenue (million), by Country 2025 & 2033
- Figure 16: Europe Vanadium Redox Battery Industry Volume (K Units), by Country 2025 & 2033
- Figure 17: Europe Vanadium Redox Battery Industry Revenue Share (%), by Country 2025 & 2033
- Figure 18: Europe Vanadium Redox Battery Industry Volume Share (%), by Country 2025 & 2033
- Figure 19: Asia Pacific Vanadium Redox Battery Industry Revenue (million), by End-User 2025 & 2033
- Figure 20: Asia Pacific Vanadium Redox Battery Industry Volume (K Units), by End-User 2025 & 2033
- Figure 21: Asia Pacific Vanadium Redox Battery Industry Revenue Share (%), by End-User 2025 & 2033
- Figure 22: Asia Pacific Vanadium Redox Battery Industry Volume Share (%), by End-User 2025 & 2033
- Figure 23: Asia Pacific Vanadium Redox Battery Industry Revenue (million), by Country 2025 & 2033
- Figure 24: Asia Pacific Vanadium Redox Battery Industry Volume (K Units), by Country 2025 & 2033
- Figure 25: Asia Pacific Vanadium Redox Battery Industry Revenue Share (%), by Country 2025 & 2033
- Figure 26: Asia Pacific Vanadium Redox Battery Industry Volume Share (%), by Country 2025 & 2033
- Figure 27: South America Vanadium Redox Battery Industry Revenue (million), by End-User 2025 & 2033
- Figure 28: South America Vanadium Redox Battery Industry Volume (K Units), by End-User 2025 & 2033
- Figure 29: South America Vanadium Redox Battery Industry Revenue Share (%), by End-User 2025 & 2033
- Figure 30: South America Vanadium Redox Battery Industry Volume Share (%), by End-User 2025 & 2033
- Figure 31: South America Vanadium Redox Battery Industry Revenue (million), by Country 2025 & 2033
- Figure 32: South America Vanadium Redox Battery Industry Volume (K Units), by Country 2025 & 2033
- Figure 33: South America Vanadium Redox Battery Industry Revenue Share (%), by Country 2025 & 2033
- Figure 34: South America Vanadium Redox Battery Industry Volume Share (%), by Country 2025 & 2033
- Figure 35: Middle East and Africa Vanadium Redox Battery Industry Revenue (million), by End-User 2025 & 2033
- Figure 36: Middle East and Africa Vanadium Redox Battery Industry Volume (K Units), by End-User 2025 & 2033
- Figure 37: Middle East and Africa Vanadium Redox Battery Industry Revenue Share (%), by End-User 2025 & 2033
- Figure 38: Middle East and Africa Vanadium Redox Battery Industry Volume Share (%), by End-User 2025 & 2033
- Figure 39: Middle East and Africa Vanadium Redox Battery Industry Revenue (million), by Country 2025 & 2033
- Figure 40: Middle East and Africa Vanadium Redox Battery Industry Volume (K Units), by Country 2025 & 2033
- Figure 41: Middle East and Africa Vanadium Redox Battery Industry Revenue Share (%), by Country 2025 & 2033
- Figure 42: Middle East and Africa Vanadium Redox Battery Industry Volume Share (%), by Country 2025 & 2033
List of Tables
- Table 1: Global Vanadium Redox Battery Industry Revenue million Forecast, by End-User 2020 & 2033
- Table 2: Global Vanadium Redox Battery Industry Volume K Units Forecast, by End-User 2020 & 2033
- Table 3: Global Vanadium Redox Battery Industry Revenue million Forecast, by Region 2020 & 2033
- Table 4: Global Vanadium Redox Battery Industry Volume K Units Forecast, by Region 2020 & 2033
- Table 5: Global Vanadium Redox Battery Industry Revenue million Forecast, by End-User 2020 & 2033
- Table 6: Global Vanadium Redox Battery Industry Volume K Units Forecast, by End-User 2020 & 2033
- Table 7: Global Vanadium Redox Battery Industry Revenue million Forecast, by Country 2020 & 2033
- Table 8: Global Vanadium Redox Battery Industry Volume K Units Forecast, by Country 2020 & 2033
- Table 9: Global Vanadium Redox Battery Industry Revenue million Forecast, by End-User 2020 & 2033
- Table 10: Global Vanadium Redox Battery Industry Volume K Units Forecast, by End-User 2020 & 2033
- Table 11: Global Vanadium Redox Battery Industry Revenue million Forecast, by Country 2020 & 2033
- Table 12: Global Vanadium Redox Battery Industry Volume K Units Forecast, by Country 2020 & 2033
- Table 13: Global Vanadium Redox Battery Industry Revenue million Forecast, by End-User 2020 & 2033
- Table 14: Global Vanadium Redox Battery Industry Volume K Units Forecast, by End-User 2020 & 2033
- Table 15: Global Vanadium Redox Battery Industry Revenue million Forecast, by Country 2020 & 2033
- Table 16: Global Vanadium Redox Battery Industry Volume K Units Forecast, by Country 2020 & 2033
- Table 17: Global Vanadium Redox Battery Industry Revenue million Forecast, by End-User 2020 & 2033
- Table 18: Global Vanadium Redox Battery Industry Volume K Units Forecast, by End-User 2020 & 2033
- Table 19: Global Vanadium Redox Battery Industry Revenue million Forecast, by Country 2020 & 2033
- Table 20: Global Vanadium Redox Battery Industry Volume K Units Forecast, by Country 2020 & 2033
- Table 21: Global Vanadium Redox Battery Industry Revenue million Forecast, by End-User 2020 & 2033
- Table 22: Global Vanadium Redox Battery Industry Volume K Units Forecast, by End-User 2020 & 2033
- Table 23: Global Vanadium Redox Battery Industry Revenue million Forecast, by Country 2020 & 2033
- Table 24: Global Vanadium Redox Battery Industry Volume K Units Forecast, by Country 2020 & 2033
Frequently Asked Questions
1. What is the projected Compound Annual Growth Rate (CAGR) of the Vanadium Redox Battery Industry?
The projected CAGR is approximately 54.94%.
2. Which companies are prominent players in the Vanadium Redox Battery Industry?
Key companies in the market include Solibra Energy Storage Technologies GmbH, Invinity Energy Solutions, H2 Inc, Big pawer Electrical Technology Xiangyang Inc Co Ltd*List Not Exhaustive, VanadiumCorp Resource Inc, UniEnergy Technologies, VRB Energy.
3. What are the main segments of the Vanadium Redox Battery Industry?
The market segments include End-User.
4. Can you provide details about the market size?
The market size is estimated to be USD 262.45 million as of 2022.
5. What are some drivers contributing to market growth?
4.; Growing Penetration of the Technology in Long-Duration Energy Storage Applications4.; Increasing Adoption of Renewable Energy.
6. What are the notable trends driving market growth?
Utility Sector to Witness Significant Growth.
7. Are there any restraints impacting market growth?
4.; Low Energy of Battery Cells.
8. Can you provide examples of recent developments in the market?
In November 2022, a strategic manufacturing cooperation agreement was signed between North Harbour Clean Energy PTY Ltd. in Australia and CellCube to build an assembly and manufacturing line in Eastern Australia. A production capacity of 40-160 megawatt hours per year is the initial target on the way to a target of up to 8,000 megawatt hours. In addition, the partners have decided to build Australia's biggest vanadium flow battery, with a capacity of 4 to 16 megawatt-hours.
9. What pricing options are available for accessing the report?
Pricing options include single-user, multi-user, and enterprise licenses priced at USD 4750, USD 5250, and USD 8750 respectively.
10. Is the market size provided in terms of value or volume?
The market size is provided in terms of value, measured in million and volume, measured in K Units.
11. Are there any specific market keywords associated with the report?
Yes, the market keyword associated with the report is "Vanadium Redox Battery Industry," which aids in identifying and referencing the specific market segment covered.
12. How do I determine which pricing option suits my needs best?
The pricing options vary based on user requirements and access needs. Individual users may opt for single-user licenses, while businesses requiring broader access may choose multi-user or enterprise licenses for cost-effective access to the report.
13. Are there any additional resources or data provided in the Vanadium Redox Battery Industry report?
While the report offers comprehensive insights, it's advisable to review the specific contents or supplementary materials provided to ascertain if additional resources or data are available.
14. How can I stay updated on further developments or reports in the Vanadium Redox Battery Industry?
To stay informed about further developments, trends, and reports in the Vanadium Redox Battery Industry, consider subscribing to industry newsletters, following relevant companies and organizations, or regularly checking reputable industry news sources and publications.
Methodology
Step 1 - Identification of Relevant Samples Size from Population Database


Step 2 - Approaches for Defining Global Market Size (Value, Volume* & Price*)

Note*: In applicable scenarios
Step 3 - Data Sources
Primary Research
- Web Analytics
- Survey Reports
- Research Institute
- Latest Research Reports
- Opinion Leaders
Secondary Research
- Annual Reports
- White Paper
- Latest Press Release
- Industry Association
- Paid Database
- Investor Presentations

Step 4 - Data Triangulation
Involves using different sources of information in order to increase the validity of a study
These sources are likely to be stakeholders in a program - participants, other researchers, program staff, other community members, and so on.
Then we put all data in single framework & apply various statistical tools to find out the dynamic on the market.
During the analysis stage, feedback from the stakeholder groups would be compared to determine areas of agreement as well as areas of divergence