

Key Insights
The Indian Buy Now Pay Later (BNPL) market is demonstrating substantial expansion, propelled by widespread smartphone adoption, enhanced digital literacy, and a flourishing e-commerce ecosystem. The market, projected to reach $21.95 billion in 2025, is anticipated to sustain a Compound Annual Growth Rate (CAGR) of 13.4% through 2033. This accelerated growth is attributed to the inherent convenience and accessibility of BNPL for both online and offline transactions, particularly appealing to younger consumers. Aggressive marketing by key providers and the seamless integration of BNPL options across major e-commerce platforms and retail outlets are also significant drivers. Nevertheless, the industry confronts challenges including concerns over consumer indebtedness and the imperative for robust regulatory oversight to mitigate potential risks. The competitive arena is dynamic, featuring established players such as Paytm Postpaid, Amazon Pay Later, and Flipkart Pay Later, alongside emerging disruptors. Competitive advantage will be determined by sophisticated credit scoring mechanisms, superior customer service, and strategic merchant network expansion. Sustainable success will require a delicate balance between rapid growth and responsible lending to foster customer confidence and ensure long-term viability.
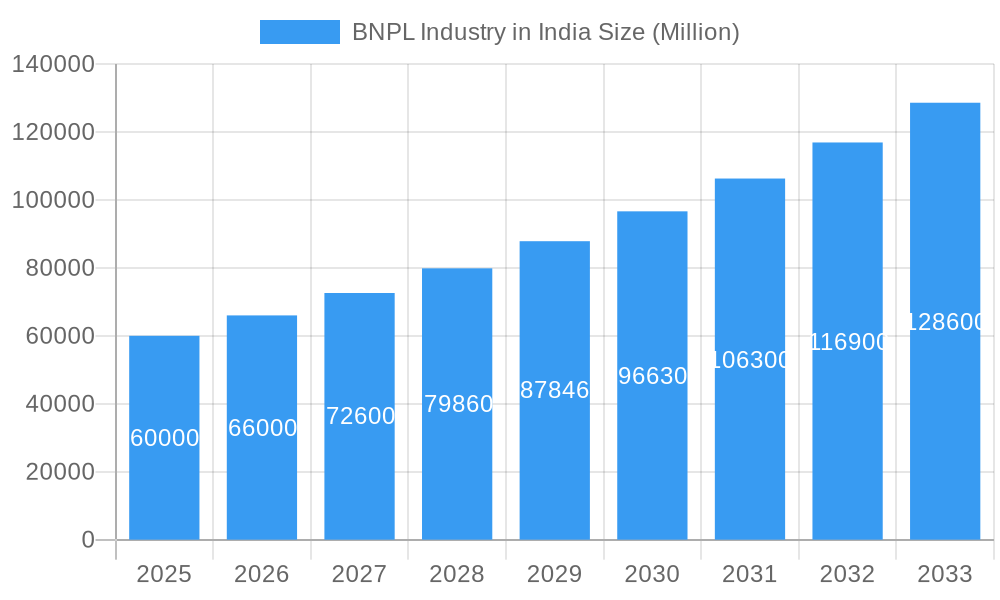
BNPL Industry in India Market Size (In Billion)
The Indian BNPL market segmentation highlights a varied array of service provisions, from broad-appeal solutions to specialized offerings catering to specific retail sectors or consumer groups. Geographic adoption mirrors internet connectivity and e-commerce activity, with metropolitan areas showing higher penetration. Future expansion is expected to target underserved markets through innovative FinTech solutions and the promotion of financial inclusion. The increasing adoption of BNPL in offline retail environments, including supermarkets and restaurants, presents a substantial avenue for further market penetration. Overall, the Indian BNPL sector is positioned for sustained, significant growth, contingent upon technological advancement, regulatory adherence, and a steadfast commitment to responsible financial practices.
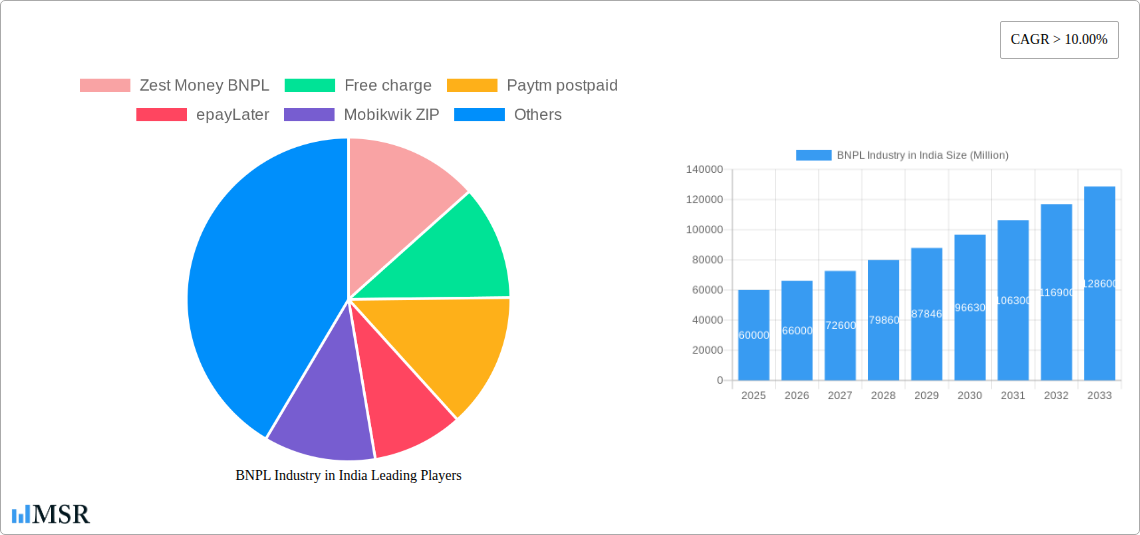
BNPL Industry in India Company Market Share
BNPL Industry in India: A Comprehensive Market Report (2019-2033)
This in-depth report provides a comprehensive analysis of the Buy Now Pay Later (BNPL) industry in India, covering market dynamics, key players, emerging trends, and future growth prospects. With a study period spanning 2019-2033, a base year of 2025, and a forecast period of 2025-2033, this report is an essential resource for industry stakeholders, investors, and businesses seeking to understand this rapidly evolving market. The report leverages data from the historical period (2019-2024) to project the market's future trajectory, providing valuable insights into the opportunities and challenges that lie ahead. The Indian BNPL market is expected to reach xx Million by 2033, exhibiting a CAGR of xx%.
BNPL Industry in India Market Concentration & Dynamics
The Indian BNPL market is characterized by a dynamic competitive landscape with several established players and emerging fintechs vying for market share. While a few players command significant portions of the market, the overall concentration remains relatively low, indicating ample opportunities for new entrants. Innovation ecosystems are thriving, with ongoing developments in technology, partnerships, and regulatory frameworks shaping the industry. The rise of super-apps integrating BNPL services is also increasing competition.
- Market Share: While precise market share data for each player is proprietary, key players like Paytm Postpaid, PhonePe, and Amazon Pay Later hold significant shares. Smaller players like ZestMoney BNPL, LazyPay, and Mobikwik ZIP are actively competing for market share.
- M&A Activity: The number of M&A deals in the BNPL sector in India has shown a fluctuating trend, correlating with regulatory changes. From 2019 to 2024, approximately xx M&A deals were recorded, with a slight decrease observed in the past couple of years due to regulatory scrutiny. However, this trend is expected to rebound with renewed investor confidence.
- Regulatory Frameworks: The regulatory environment has been a key factor, with changes impacting market dynamics. The Reserve Bank of India (RBI) and other regulatory bodies are actively shaping the landscape with guidelines for lending and data privacy, impacting both the operational aspects and risk profiles of BNPL providers.
- Substitute Products: Traditional credit cards and personal loans remain substitutes, though the convenience and accessibility of BNPL services are gaining traction, especially amongst younger demographics.
- End-User Trends: Increasing smartphone penetration, digital adoption, and a growing preference for flexible payment options are key drivers for BNPL’s expansion.
BNPL Industry in India Industry Insights & Trends
The Indian BNPL market is experiencing robust growth, fueled by several factors. The increasing adoption of e-commerce, rising disposable incomes among the millennial and Gen Z populations, and the relative ease of access compared to traditional credit products are key growth drivers. The market size stood at xx Million in 2024 and is projected to reach xx Million by 2025, exhibiting a significant CAGR. Technological disruptions, including advancements in AI-powered risk assessment and personalized offers, are further propelling the sector’s growth. Evolving consumer behaviors, such as a preference for instant gratification and flexible payment options, are also significantly impacting market dynamics. The industry is witnessing the integration of BNPL into various platforms, from e-commerce websites to ride-hailing apps, expanding its reach and driving wider adoption.
Key Markets & Segments Leading BNPL Industry in India
Tier 1 and Tier 2 cities are currently the dominant markets for BNPL services in India due to higher internet and smartphone penetration, along with a larger concentration of young professionals and digitally active consumers. Rural markets are showing promising growth potential, however, as digital infrastructure improves and financial literacy increases.
- Drivers for Dominant Regions:
- High Smartphone & Internet Penetration: Enables seamless access to BNPL apps and services.
- Young & Digitally Savvy Population: Millennials and Gen Z are early adopters of new technologies and financial services.
- Growing E-commerce Sector: BNPL is intrinsically linked to online shopping trends.
- Increasing Disposable Incomes: Provides purchasing power to utilize BNPL options.
The dominance of Tier 1 and Tier 2 cities is expected to continue in the coming years, but the growth potential of rural areas is significant, contributing to the overall expansion of the market.
BNPL Industry in India Product Developments
Recent product innovations in the Indian BNPL space are focused on enhancing user experience, improving risk management, and expanding service offerings. Key developments include integrations with various e-commerce platforms, personalized credit limits, and the incorporation of rewards programs to incentivize user engagement. Some players are exploring the use of open banking data to assess creditworthiness more efficiently, while others are moving towards partnerships with banks and NBFCs to mitigate risk and improve affordability. These advancements are crucial for staying competitive and attracting a wider range of customers.
Challenges in the BNPL Industry in India Market
The BNPL industry in India faces several challenges, primarily centered around regulatory hurdles and risk management. Stringent regulatory requirements for lending and data privacy add operational complexities and compliance costs. The high default rates among certain customer segments also pose significant financial risks. Furthermore, intense competition among numerous providers necessitates ongoing innovation and cost management strategies. These challenges contribute to a complex operating environment, requiring sophisticated risk assessment capabilities and regulatory compliance efforts. The impact of these factors can be seen in fluctuating investor sentiments and the consolidation of some players within the market.
Forces Driving BNPL Industry in India Growth
Several factors drive the growth of the BNPL industry in India. Technological advancements, such as improved risk assessment models and the use of AI, improve the efficiency and effectiveness of BNPL services. Economic growth and rising disposable incomes are widening the pool of potential customers. Favorable government policies promoting digital finance further contribute to the expansion of the industry. The increasing integration of BNPL services into various e-commerce and other platforms also plays a major role in driving market growth.
Long-Term Growth Catalysts in the BNPL Industry in India
Long-term growth catalysts include ongoing technological advancements, strategic partnerships with banks and NBFCs, and expansion into underserved markets. The development of more sophisticated risk management tools to reduce defaults will be crucial for sustainable growth. Expanding BNPL services beyond online shopping to include offline purchases and utility payments will unlock new revenue streams. Further development of financial literacy programs can broaden adoption among previously unserved customer segments.
Emerging Opportunities in BNPL Industry in India
Emerging opportunities include expansion into under-served rural markets, development of innovative BNPL products for specific sectors like healthcare and education, and leveraging technologies like blockchain for enhanced security and transparency. Exploring new partnerships with other financial institutions to expand credit access to more customers presents a substantial opportunity for growth. The integration of BNPL with other financial services and the adoption of advanced analytics for better risk management are further areas of exploration.
Leading Players in the BNPL Industry in India Sector
- ZestMoney BNPL https://www.zestmoney.in/
- Freecharge
- Paytm Postpaid https://paytm.com/
- epayLater
- Mobikwik ZIP https://www.mobikwik.com/
- Flipkart Pay Later https://www.flipkart.com/
- Olamoney Postpaid
- Money Tap
- Simpl
- LazyPay
- Flexmoney
- Amazon Pay Later https://www.amazon.in/
- Capital Float
- Slice
- Kreditbee
- Postpe
Key Milestones in BNPL Industry in India Industry
- May 2023: ZestMoney announces plans to achieve profitability within six months and secures a new investment round from existing shareholders, signaling confidence in the sector despite challenges. The shift to an LSP model indicates a strategic adaptation to regulatory pressures.
- February 2023: The Indian IT Ministry lifts the ban on several lending apps, including LazyPay, providing a significant boost to the industry after a period of regulatory scrutiny and uncertainty. This event showcases the ongoing evolution of the regulatory landscape.
Strategic Outlook for BNPL Industry in India Market
The Indian BNPL market is poised for substantial growth in the coming years, driven by increasing digital adoption, favorable demographics, and continuous innovation. Strategic opportunities lie in developing robust risk management systems, expanding into underserved markets, and forging strategic partnerships to enhance service offerings and reach. The industry will likely witness further consolidation as players seek to achieve scale and profitability in a competitive market. A focus on responsible lending practices and regulatory compliance will be crucial for long-term sustainable growth.
BNPL Industry in India Segmentation
-
1. Channel
- 1.1. Online
- 1.2. POS
-
2. Enterprise
- 2.1. Large Enterprise
- 2.2. Small & medium enterprise
-
3. End-user
- 3.1. Consmer electronics
- 3.2. Fashion & garments
- 3.3. Healthcare
- 3.4. Leisure & entertainment
- 3.5. Retail
- 3.6. Other End-users
BNPL Industry in India Segmentation By Geography
-
1. North America
- 1.1. United States
- 1.2. Canada
- 1.3. Mexico
-
2. South America
- 2.1. Brazil
- 2.2. Argentina
- 2.3. Rest of South America
-
3. Europe
- 3.1. United Kingdom
- 3.2. Germany
- 3.3. France
- 3.4. Italy
- 3.5. Spain
- 3.6. Russia
- 3.7. Benelux
- 3.8. Nordics
- 3.9. Rest of Europe
-
4. Middle East & Africa
- 4.1. Turkey
- 4.2. Israel
- 4.3. GCC
- 4.4. North Africa
- 4.5. South Africa
- 4.6. Rest of Middle East & Africa
-
5. Asia Pacific
- 5.1. China
- 5.2. India
- 5.3. Japan
- 5.4. South Korea
- 5.5. ASEAN
- 5.6. Oceania
- 5.7. Rest of Asia Pacific
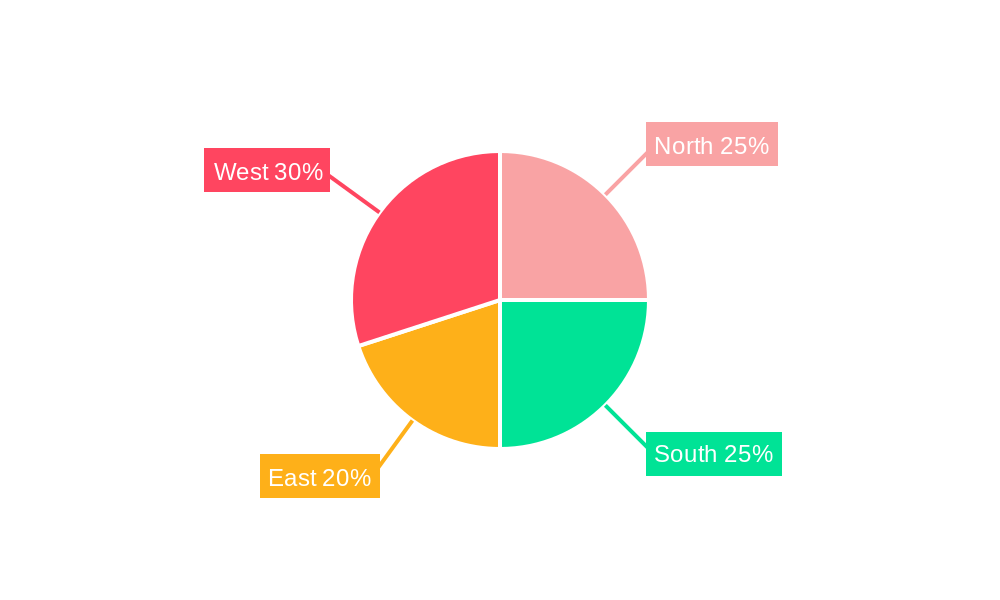
BNPL Industry in India Regional Market Share
Geographic Coverage of BNPL Industry in India
BNPL Industry in India REPORT HIGHLIGHTS
| Aspects | Details |
|---|---|
| Study Period | 2020-2034 |
| Base Year | 2025 |
| Estimated Year | 2026 |
| Forecast Period | 2026-2034 |
| Historical Period | 2020-2025 |
| Growth Rate | CAGR of 13.4% from 2020-2034 |
| Segmentation |
|
Table of Contents
- 1. Introduction
- 1.1. Research Scope
- 1.2. Market Segmentation
- 1.3. Research Objective
- 1.4. Definitions and Assumptions
- 2. Executive Summary
- 2.1. Market Snapshot
- 3. Market Dynamics
- 3.1. Market Drivers
- 3.2. Market Restrains
- 3.3. Market Trends
- 3.4. Market Opportunities
- 4. Market Factor Analysis
- 4.1. Porters Five Forces
- 4.1.1. Bargaining Power of Suppliers
- 4.1.2. Bargaining Power of Buyers
- 4.1.3. Threat of New Entrants
- 4.1.4. Threat of Substitutes
- 4.1.5. Competitive Rivalry
- 4.2. PESTEL analysis
- 4.3. BCG Analysis
- 4.3.1. Stars (High Growth, High Market Share)
- 4.3.2. Cash Cows (Low Growth, High Market Share)
- 4.3.3. Question Mark (High Growth, Low Market Share)
- 4.3.4. Dogs (Low Growth, Low Market Share)
- 4.4. Ansoff Matrix Analysis
- 4.5. Supply Chain Analysis
- 4.6. Regulatory Landscape
- 4.7. Current Market Potential and Opportunity Assessment (TAM–SAM–SOM Framework)
- 4.8. MSR Analyst Note
- 4.1. Porters Five Forces
- 5. Market Analysis, Insights and Forecast 2021-2033
- 5.1. Market Analysis, Insights and Forecast - by Channel
- 5.1.1. Online
- 5.1.2. POS
- 5.2. Market Analysis, Insights and Forecast - by Enterprise
- 5.2.1. Large Enterprise
- 5.2.2. Small & medium enterprise
- 5.3. Market Analysis, Insights and Forecast - by End-user
- 5.3.1. Consmer electronics
- 5.3.2. Fashion & garments
- 5.3.3. Healthcare
- 5.3.4. Leisure & entertainment
- 5.3.5. Retail
- 5.3.6. Other End-users
- 5.4. Market Analysis, Insights and Forecast - by Region
- 5.4.1. North America
- 5.4.2. South America
- 5.4.3. Europe
- 5.4.4. Middle East & Africa
- 5.4.5. Asia Pacific
- 5.1. Market Analysis, Insights and Forecast - by Channel
- 6. Global BNPL Industry in India Analysis, Insights and Forecast, 2021-2033
- 6.1. Market Analysis, Insights and Forecast - by Channel
- 6.1.1. Online
- 6.1.2. POS
- 6.2. Market Analysis, Insights and Forecast - by Enterprise
- 6.2.1. Large Enterprise
- 6.2.2. Small & medium enterprise
- 6.3. Market Analysis, Insights and Forecast - by End-user
- 6.3.1. Consmer electronics
- 6.3.2. Fashion & garments
- 6.3.3. Healthcare
- 6.3.4. Leisure & entertainment
- 6.3.5. Retail
- 6.3.6. Other End-users
- 6.1. Market Analysis, Insights and Forecast - by Channel
- 7. North America BNPL Industry in India Analysis, Insights and Forecast, 2020-2032
- 7.1. Market Analysis, Insights and Forecast - by Channel
- 7.1.1. Online
- 7.1.2. POS
- 7.2. Market Analysis, Insights and Forecast - by Enterprise
- 7.2.1. Large Enterprise
- 7.2.2. Small & medium enterprise
- 7.3. Market Analysis, Insights and Forecast - by End-user
- 7.3.1. Consmer electronics
- 7.3.2. Fashion & garments
- 7.3.3. Healthcare
- 7.3.4. Leisure & entertainment
- 7.3.5. Retail
- 7.3.6. Other End-users
- 7.1. Market Analysis, Insights and Forecast - by Channel
- 8. South America BNPL Industry in India Analysis, Insights and Forecast, 2020-2032
- 8.1. Market Analysis, Insights and Forecast - by Channel
- 8.1.1. Online
- 8.1.2. POS
- 8.2. Market Analysis, Insights and Forecast - by Enterprise
- 8.2.1. Large Enterprise
- 8.2.2. Small & medium enterprise
- 8.3. Market Analysis, Insights and Forecast - by End-user
- 8.3.1. Consmer electronics
- 8.3.2. Fashion & garments
- 8.3.3. Healthcare
- 8.3.4. Leisure & entertainment
- 8.3.5. Retail
- 8.3.6. Other End-users
- 8.1. Market Analysis, Insights and Forecast - by Channel
- 9. Europe BNPL Industry in India Analysis, Insights and Forecast, 2020-2032
- 9.1. Market Analysis, Insights and Forecast - by Channel
- 9.1.1. Online
- 9.1.2. POS
- 9.2. Market Analysis, Insights and Forecast - by Enterprise
- 9.2.1. Large Enterprise
- 9.2.2. Small & medium enterprise
- 9.3. Market Analysis, Insights and Forecast - by End-user
- 9.3.1. Consmer electronics
- 9.3.2. Fashion & garments
- 9.3.3. Healthcare
- 9.3.4. Leisure & entertainment
- 9.3.5. Retail
- 9.3.6. Other End-users
- 9.1. Market Analysis, Insights and Forecast - by Channel
- 10. Middle East & Africa BNPL Industry in India Analysis, Insights and Forecast, 2020-2032
- 10.1. Market Analysis, Insights and Forecast - by Channel
- 10.1.1. Online
- 10.1.2. POS
- 10.2. Market Analysis, Insights and Forecast - by Enterprise
- 10.2.1. Large Enterprise
- 10.2.2. Small & medium enterprise
- 10.3. Market Analysis, Insights and Forecast - by End-user
- 10.3.1. Consmer electronics
- 10.3.2. Fashion & garments
- 10.3.3. Healthcare
- 10.3.4. Leisure & entertainment
- 10.3.5. Retail
- 10.3.6. Other End-users
- 10.1. Market Analysis, Insights and Forecast - by Channel
- 11. Asia Pacific BNPL Industry in India Analysis, Insights and Forecast, 2020-2032
- 11.1. Market Analysis, Insights and Forecast - by Channel
- 11.1.1. Online
- 11.1.2. POS
- 11.2. Market Analysis, Insights and Forecast - by Enterprise
- 11.2.1. Large Enterprise
- 11.2.2. Small & medium enterprise
- 11.3. Market Analysis, Insights and Forecast - by End-user
- 11.3.1. Consmer electronics
- 11.3.2. Fashion & garments
- 11.3.3. Healthcare
- 11.3.4. Leisure & entertainment
- 11.3.5. Retail
- 11.3.6. Other End-users
- 11.1. Market Analysis, Insights and Forecast - by Channel
- 12. Competitive Analysis
- 12.1. Company Profiles
- 12.1.1 Zest Money BNPL
- 12.1.1.1. Company Overview
- 12.1.1.2. Products
- 12.1.1.3. Company Financials
- 12.1.1.4. SWOT Analysis
- 12.1.2 Free charge
- 12.1.2.1. Company Overview
- 12.1.2.2. Products
- 12.1.2.3. Company Financials
- 12.1.2.4. SWOT Analysis
- 12.1.3 Paytm postpaid
- 12.1.3.1. Company Overview
- 12.1.3.2. Products
- 12.1.3.3. Company Financials
- 12.1.3.4. SWOT Analysis
- 12.1.4 epayLater
- 12.1.4.1. Company Overview
- 12.1.4.2. Products
- 12.1.4.3. Company Financials
- 12.1.4.4. SWOT Analysis
- 12.1.5 Mobikwik ZIP
- 12.1.5.1. Company Overview
- 12.1.5.2. Products
- 12.1.5.3. Company Financials
- 12.1.5.4. SWOT Analysis
- 12.1.6 Flipkart pay later
- 12.1.6.1. Company Overview
- 12.1.6.2. Products
- 12.1.6.3. Company Financials
- 12.1.6.4. SWOT Analysis
- 12.1.7 Olamoney Postpaid
- 12.1.7.1. Company Overview
- 12.1.7.2. Products
- 12.1.7.3. Company Financials
- 12.1.7.4. SWOT Analysis
- 12.1.8 Money Tap
- 12.1.8.1. Company Overview
- 12.1.8.2. Products
- 12.1.8.3. Company Financials
- 12.1.8.4. SWOT Analysis
- 12.1.9 Simpl
- 12.1.9.1. Company Overview
- 12.1.9.2. Products
- 12.1.9.3. Company Financials
- 12.1.9.4. SWOT Analysis
- 12.1.10 Lazy Pay
- 12.1.10.1. Company Overview
- 12.1.10.2. Products
- 12.1.10.3. Company Financials
- 12.1.10.4. SWOT Analysis
- 12.1.11 Flexmoney
- 12.1.11.1. Company Overview
- 12.1.11.2. Products
- 12.1.11.3. Company Financials
- 12.1.11.4. SWOT Analysis
- 12.1.12 Amazon Pay later
- 12.1.12.1. Company Overview
- 12.1.12.2. Products
- 12.1.12.3. Company Financials
- 12.1.12.4. SWOT Analysis
- 12.1.13 Capital float
- 12.1.13.1. Company Overview
- 12.1.13.2. Products
- 12.1.13.3. Company Financials
- 12.1.13.4. SWOT Analysis
- 12.1.14 Slice
- 12.1.14.1. Company Overview
- 12.1.14.2. Products
- 12.1.14.3. Company Financials
- 12.1.14.4. SWOT Analysis
- 12.1.15 Kreditbee
- 12.1.15.1. Company Overview
- 12.1.15.2. Products
- 12.1.15.3. Company Financials
- 12.1.15.4. SWOT Analysis
- 12.1.16 Postpe**List Not Exhaustive
- 12.1.16.1. Company Overview
- 12.1.16.2. Products
- 12.1.16.3. Company Financials
- 12.1.16.4. SWOT Analysis
- 12.1.1 Zest Money BNPL
- 12.2. Market Entropy
- 12.2.1 Company's Key Areas Served
- 12.2.2 Recent Developments
- 12.3. Company Market Share Analysis 2025
- 12.3.1 Top 5 Companies Market Share Analysis
- 12.3.2 Top 3 Companies Market Share Analysis
- 12.4. List of Potential Customers
- 13. Research Methodology
List of Figures
- Figure 1: Global BNPL Industry in India Revenue Breakdown (billion, %) by Region 2025 & 2033
- Figure 2: North America BNPL Industry in India Revenue (billion), by Channel 2025 & 2033
- Figure 3: North America BNPL Industry in India Revenue Share (%), by Channel 2025 & 2033
- Figure 4: North America BNPL Industry in India Revenue (billion), by Enterprise 2025 & 2033
- Figure 5: North America BNPL Industry in India Revenue Share (%), by Enterprise 2025 & 2033
- Figure 6: North America BNPL Industry in India Revenue (billion), by End-user 2025 & 2033
- Figure 7: North America BNPL Industry in India Revenue Share (%), by End-user 2025 & 2033
- Figure 8: North America BNPL Industry in India Revenue (billion), by Country 2025 & 2033
- Figure 9: North America BNPL Industry in India Revenue Share (%), by Country 2025 & 2033
- Figure 10: South America BNPL Industry in India Revenue (billion), by Channel 2025 & 2033
- Figure 11: South America BNPL Industry in India Revenue Share (%), by Channel 2025 & 2033
- Figure 12: South America BNPL Industry in India Revenue (billion), by Enterprise 2025 & 2033
- Figure 13: South America BNPL Industry in India Revenue Share (%), by Enterprise 2025 & 2033
- Figure 14: South America BNPL Industry in India Revenue (billion), by End-user 2025 & 2033
- Figure 15: South America BNPL Industry in India Revenue Share (%), by End-user 2025 & 2033
- Figure 16: South America BNPL Industry in India Revenue (billion), by Country 2025 & 2033
- Figure 17: South America BNPL Industry in India Revenue Share (%), by Country 2025 & 2033
- Figure 18: Europe BNPL Industry in India Revenue (billion), by Channel 2025 & 2033
- Figure 19: Europe BNPL Industry in India Revenue Share (%), by Channel 2025 & 2033
- Figure 20: Europe BNPL Industry in India Revenue (billion), by Enterprise 2025 & 2033
- Figure 21: Europe BNPL Industry in India Revenue Share (%), by Enterprise 2025 & 2033
- Figure 22: Europe BNPL Industry in India Revenue (billion), by End-user 2025 & 2033
- Figure 23: Europe BNPL Industry in India Revenue Share (%), by End-user 2025 & 2033
- Figure 24: Europe BNPL Industry in India Revenue (billion), by Country 2025 & 2033
- Figure 25: Europe BNPL Industry in India Revenue Share (%), by Country 2025 & 2033
- Figure 26: Middle East & Africa BNPL Industry in India Revenue (billion), by Channel 2025 & 2033
- Figure 27: Middle East & Africa BNPL Industry in India Revenue Share (%), by Channel 2025 & 2033
- Figure 28: Middle East & Africa BNPL Industry in India Revenue (billion), by Enterprise 2025 & 2033
- Figure 29: Middle East & Africa BNPL Industry in India Revenue Share (%), by Enterprise 2025 & 2033
- Figure 30: Middle East & Africa BNPL Industry in India Revenue (billion), by End-user 2025 & 2033
- Figure 31: Middle East & Africa BNPL Industry in India Revenue Share (%), by End-user 2025 & 2033
- Figure 32: Middle East & Africa BNPL Industry in India Revenue (billion), by Country 2025 & 2033
- Figure 33: Middle East & Africa BNPL Industry in India Revenue Share (%), by Country 2025 & 2033
- Figure 34: Asia Pacific BNPL Industry in India Revenue (billion), by Channel 2025 & 2033
- Figure 35: Asia Pacific BNPL Industry in India Revenue Share (%), by Channel 2025 & 2033
- Figure 36: Asia Pacific BNPL Industry in India Revenue (billion), by Enterprise 2025 & 2033
- Figure 37: Asia Pacific BNPL Industry in India Revenue Share (%), by Enterprise 2025 & 2033
- Figure 38: Asia Pacific BNPL Industry in India Revenue (billion), by End-user 2025 & 2033
- Figure 39: Asia Pacific BNPL Industry in India Revenue Share (%), by End-user 2025 & 2033
- Figure 40: Asia Pacific BNPL Industry in India Revenue (billion), by Country 2025 & 2033
- Figure 41: Asia Pacific BNPL Industry in India Revenue Share (%), by Country 2025 & 2033
List of Tables
- Table 1: Global BNPL Industry in India Revenue billion Forecast, by Channel 2020 & 2033
- Table 2: Global BNPL Industry in India Revenue billion Forecast, by Enterprise 2020 & 2033
- Table 3: Global BNPL Industry in India Revenue billion Forecast, by End-user 2020 & 2033
- Table 4: Global BNPL Industry in India Revenue billion Forecast, by Region 2020 & 2033
- Table 5: Global BNPL Industry in India Revenue billion Forecast, by Channel 2020 & 2033
- Table 6: Global BNPL Industry in India Revenue billion Forecast, by Enterprise 2020 & 2033
- Table 7: Global BNPL Industry in India Revenue billion Forecast, by End-user 2020 & 2033
- Table 8: Global BNPL Industry in India Revenue billion Forecast, by Country 2020 & 2033
- Table 9: United States BNPL Industry in India Revenue (billion) Forecast, by Application 2020 & 2033
- Table 10: Canada BNPL Industry in India Revenue (billion) Forecast, by Application 2020 & 2033
- Table 11: Mexico BNPL Industry in India Revenue (billion) Forecast, by Application 2020 & 2033
- Table 12: Global BNPL Industry in India Revenue billion Forecast, by Channel 2020 & 2033
- Table 13: Global BNPL Industry in India Revenue billion Forecast, by Enterprise 2020 & 2033
- Table 14: Global BNPL Industry in India Revenue billion Forecast, by End-user 2020 & 2033
- Table 15: Global BNPL Industry in India Revenue billion Forecast, by Country 2020 & 2033
- Table 16: Brazil BNPL Industry in India Revenue (billion) Forecast, by Application 2020 & 2033
- Table 17: Argentina BNPL Industry in India Revenue (billion) Forecast, by Application 2020 & 2033
- Table 18: Rest of South America BNPL Industry in India Revenue (billion) Forecast, by Application 2020 & 2033
- Table 19: Global BNPL Industry in India Revenue billion Forecast, by Channel 2020 & 2033
- Table 20: Global BNPL Industry in India Revenue billion Forecast, by Enterprise 2020 & 2033
- Table 21: Global BNPL Industry in India Revenue billion Forecast, by End-user 2020 & 2033
- Table 22: Global BNPL Industry in India Revenue billion Forecast, by Country 2020 & 2033
- Table 23: United Kingdom BNPL Industry in India Revenue (billion) Forecast, by Application 2020 & 2033
- Table 24: Germany BNPL Industry in India Revenue (billion) Forecast, by Application 2020 & 2033
- Table 25: France BNPL Industry in India Revenue (billion) Forecast, by Application 2020 & 2033
- Table 26: Italy BNPL Industry in India Revenue (billion) Forecast, by Application 2020 & 2033
- Table 27: Spain BNPL Industry in India Revenue (billion) Forecast, by Application 2020 & 2033
- Table 28: Russia BNPL Industry in India Revenue (billion) Forecast, by Application 2020 & 2033
- Table 29: Benelux BNPL Industry in India Revenue (billion) Forecast, by Application 2020 & 2033
- Table 30: Nordics BNPL Industry in India Revenue (billion) Forecast, by Application 2020 & 2033
- Table 31: Rest of Europe BNPL Industry in India Revenue (billion) Forecast, by Application 2020 & 2033
- Table 32: Global BNPL Industry in India Revenue billion Forecast, by Channel 2020 & 2033
- Table 33: Global BNPL Industry in India Revenue billion Forecast, by Enterprise 2020 & 2033
- Table 34: Global BNPL Industry in India Revenue billion Forecast, by End-user 2020 & 2033
- Table 35: Global BNPL Industry in India Revenue billion Forecast, by Country 2020 & 2033
- Table 36: Turkey BNPL Industry in India Revenue (billion) Forecast, by Application 2020 & 2033
- Table 37: Israel BNPL Industry in India Revenue (billion) Forecast, by Application 2020 & 2033
- Table 38: GCC BNPL Industry in India Revenue (billion) Forecast, by Application 2020 & 2033
- Table 39: North Africa BNPL Industry in India Revenue (billion) Forecast, by Application 2020 & 2033
- Table 40: South Africa BNPL Industry in India Revenue (billion) Forecast, by Application 2020 & 2033
- Table 41: Rest of Middle East & Africa BNPL Industry in India Revenue (billion) Forecast, by Application 2020 & 2033
- Table 42: Global BNPL Industry in India Revenue billion Forecast, by Channel 2020 & 2033
- Table 43: Global BNPL Industry in India Revenue billion Forecast, by Enterprise 2020 & 2033
- Table 44: Global BNPL Industry in India Revenue billion Forecast, by End-user 2020 & 2033
- Table 45: Global BNPL Industry in India Revenue billion Forecast, by Country 2020 & 2033
- Table 46: China BNPL Industry in India Revenue (billion) Forecast, by Application 2020 & 2033
- Table 47: India BNPL Industry in India Revenue (billion) Forecast, by Application 2020 & 2033
- Table 48: Japan BNPL Industry in India Revenue (billion) Forecast, by Application 2020 & 2033
- Table 49: South Korea BNPL Industry in India Revenue (billion) Forecast, by Application 2020 & 2033
- Table 50: ASEAN BNPL Industry in India Revenue (billion) Forecast, by Application 2020 & 2033
- Table 51: Oceania BNPL Industry in India Revenue (billion) Forecast, by Application 2020 & 2033
- Table 52: Rest of Asia Pacific BNPL Industry in India Revenue (billion) Forecast, by Application 2020 & 2033
Frequently Asked Questions
1. What is the projected Compound Annual Growth Rate (CAGR) of the BNPL Industry in India?
The projected CAGR is approximately 13.4%.
2. Which companies are prominent players in the BNPL Industry in India?
Key companies in the market include Zest Money BNPL, Free charge, Paytm postpaid, epayLater, Mobikwik ZIP, Flipkart pay later, Olamoney Postpaid, Money Tap, Simpl, Lazy Pay, Flexmoney, Amazon Pay later, Capital float, Slice, Kreditbee, Postpe**List Not Exhaustive.
3. What are the main segments of the BNPL Industry in India?
The market segments include Channel, Enterprise, End-user.
4. Can you provide details about the market size?
The market size is estimated to be USD 21.95 billion as of 2022.
5. What are some drivers contributing to market growth?
Increasing e-commerce adoption; Rising middle class and disposable income; Access to credit and financial inclusion.
6. What are the notable trends driving market growth?
Surging E-commerce and Digital P2M Payments Boosting the Market.
7. Are there any restraints impacting market growth?
Increasing e-commerce adoption; Rising middle class and disposable income; Access to credit and financial inclusion.
8. Can you provide examples of recent developments in the market?
May 2023: ZestMoney plans to be profitable in 6 months. The fintech firm is said to be finalizing a new investment round from its existing shareholders, including Quona Capital, Zip, Omidyar Network India, Flourish VC, and Scarlet Digital. To ensure business continuity, ZestMoney plans to operate as a lending service provider (LSP), partnering with banks and NBFCs to write out loans rather than lending directly from its balance sheet.
9. What pricing options are available for accessing the report?
Pricing options include single-user, multi-user, and enterprise licenses priced at USD 3800, USD 4500, and USD 5800 respectively.
10. Is the market size provided in terms of value or volume?
The market size is provided in terms of value, measured in billion.
11. Are there any specific market keywords associated with the report?
Yes, the market keyword associated with the report is "BNPL Industry in India," which aids in identifying and referencing the specific market segment covered.
12. How do I determine which pricing option suits my needs best?
The pricing options vary based on user requirements and access needs. Individual users may opt for single-user licenses, while businesses requiring broader access may choose multi-user or enterprise licenses for cost-effective access to the report.
13. Are there any additional resources or data provided in the BNPL Industry in India report?
While the report offers comprehensive insights, it's advisable to review the specific contents or supplementary materials provided to ascertain if additional resources or data are available.
14. How can I stay updated on further developments or reports in the BNPL Industry in India?
To stay informed about further developments, trends, and reports in the BNPL Industry in India, consider subscribing to industry newsletters, following relevant companies and organizations, or regularly checking reputable industry news sources and publications.
Methodology
Step 1 - Identification of Relevant Samples Size from Population Database


Step 2 - Approaches for Defining Global Market Size (Value, Volume* & Price*)

Note*: In applicable scenarios
Step 3 - Data Sources
Primary Research
- Web Analytics
- Survey Reports
- Research Institute
- Latest Research Reports
- Opinion Leaders
Secondary Research
- Annual Reports
- White Paper
- Latest Press Release
- Industry Association
- Paid Database
- Investor Presentations

Step 4 - Data Triangulation
Involves using different sources of information in order to increase the validity of a study
These sources are likely to be stakeholders in a program - participants, other researchers, program staff, other community members, and so on.
Then we put all data in single framework & apply various statistical tools to find out the dynamic on the market.
During the analysis stage, feedback from the stakeholder groups would be compared to determine areas of agreement as well as areas of divergence