

Key Insights
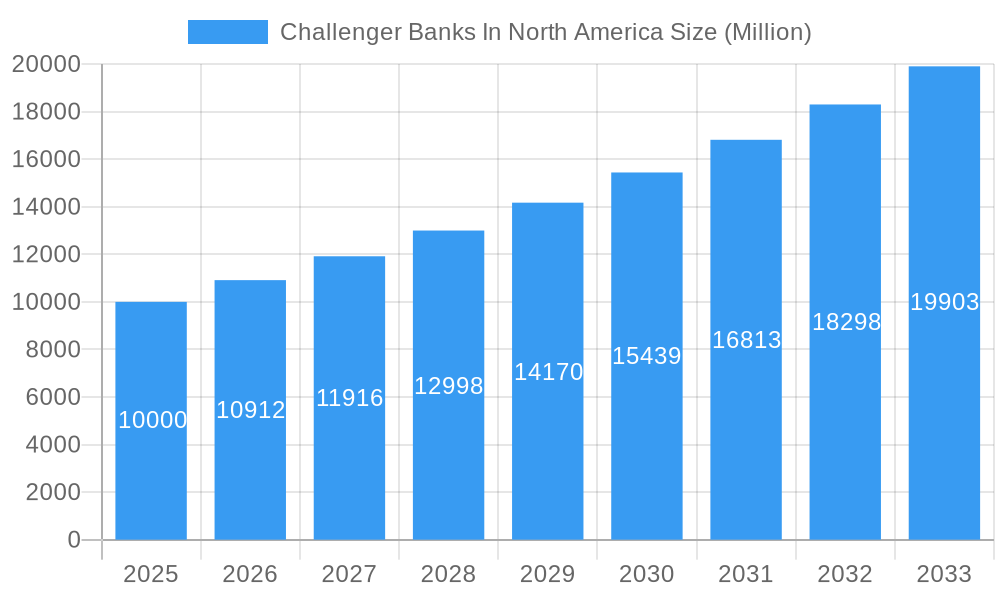
The North American challenger bank market, valued at approximately $10 billion in 2025, is experiencing robust growth, projected to expand at a Compound Annual Growth Rate (CAGR) of 9.12% from 2025 to 2033. This surge is driven by several key factors. Increased consumer demand for digital-first banking solutions, coupled with the frustration over traditional banking fees and complexities, fuels the adoption of challenger banks. These institutions offer streamlined user experiences, often incorporating advanced features like personalized financial management tools and budgeting assistance. Furthermore, the rise of embedded finance, where financial services are integrated into non-financial platforms, is expanding the reach and accessibility of these services. Strong competition among established players like Chime, Varo, and others, is also driving innovation and pushing the boundaries of what consumers expect from their banking experiences. This competitive landscape is encouraging continuous improvement in features, security, and customer service, further accelerating market growth.
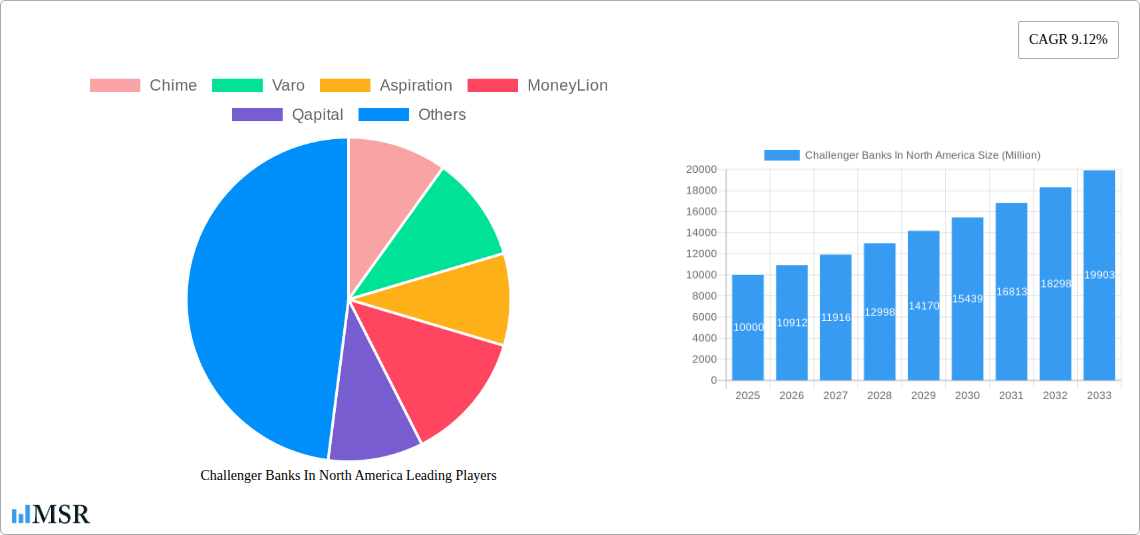
Challenger Banks In North America Market Size (In Billion)
However, the market also faces certain restraints. Regulatory hurdles, particularly around compliance and licensing, can pose challenges for new entrants. Maintaining robust security measures in the face of evolving cyber threats is crucial for customer trust and continued growth. The need to balance innovation with regulatory compliance and the ever-present risk of market disruption through technological advancements are key challenges that challenger banks must navigate to ensure continued success. Furthermore, attracting and retaining customer loyalty requires a constant effort to improve existing offerings and adapt to emerging customer demands. Nevertheless, the projected CAGR indicates a positive outlook for the North American challenger banking sector, driven by continuous innovation and a growing customer base seeking more modern and accessible banking solutions.
Challenger Banks In North America Company Market Share
Challenger Banks in North America: A Comprehensive Market Report (2019-2033)
This in-depth report provides a comprehensive analysis of the North American challenger bank market, covering the period from 2019 to 2033. It offers invaluable insights into market dynamics, growth drivers, key players, and emerging opportunities for industry stakeholders, investors, and strategic decision-makers. With a focus on key players like Chime, Varo, Aspiration, MoneyLion, and others, this report unveils the competitive landscape and future trajectory of this rapidly evolving sector. The report utilizes data from the historical period (2019-2024), base year (2025), and estimated/forecast period (2025-2033) to provide a complete picture of market evolution. The report also examines recent key milestones including Varo Bank's fundraising and Aspiration's credit card launch, impacting market valuations and competitive dynamics.
Challenger Banks In North America Market Concentration & Dynamics
The North American challenger bank market is characterized by moderate concentration, with a few major players holding significant market share, but a dynamic landscape of smaller, rapidly growing firms. Innovation ecosystems are vibrant, fueled by fintech advancements and a focus on digital-first solutions. Regulatory frameworks, while evolving, present both opportunities and challenges for challenger banks. Substitute products include traditional banks and other financial technology services. End-user trends show a strong preference for digital banking experiences, personalized services, and fee transparency. M&A activity is significant, with several notable acquisitions and partnerships shaping market consolidation.
- Market Share: Chime holds an estimated xx% market share in 2025, followed by Varo at xx%, and Aspiration at xx%. The remaining market share is distributed among numerous smaller players.
- M&A Deal Counts: xx M&A deals were recorded between 2019 and 2024, reflecting a high level of consolidation and strategic partnerships.
Challenger Banks In North America Industry Insights & Trends
The North American challenger bank market experienced significant growth between 2019 and 2024, with a Compound Annual Growth Rate (CAGR) of xx%. This growth is driven by several factors: increasing adoption of digital banking, a desire for better customer experiences, and the emergence of innovative financial products. Technological disruptions, such as open banking and AI-powered personalization, are further fueling market expansion. Consumer behavior shifts towards mobile-first banking and demand for financial inclusivity create substantial opportunities for challenger banks. The market size is estimated to reach USD xx Million by 2025, and is projected to reach USD xx Million by 2033.
Key Markets & Segments Leading Challenger Banks In North America
The United States represents the dominant market for challenger banks in North America. Strong economic growth, advanced technological infrastructure, and a high level of smartphone penetration contribute to this dominance.
- Key Drivers in the US Market:
- High smartphone penetration
- Robust technological infrastructure
- Growing demand for digital banking services
- Favorable regulatory environment (relative to other regions)
The detailed dominance analysis reveals that the US market’s growth is primarily driven by younger demographics, a surge in digital adoption, and the limitations of legacy banks in keeping up with evolving customer preferences.
Challenger Banks In North America Product Developments
Challenger banks are constantly innovating their product offerings. Key developments include the introduction of advanced mobile banking apps, personalized financial management tools, and innovative credit products. The use of AI and machine learning is enhancing customer experiences and risk assessment processes. These technological advancements provide challenger banks with a competitive edge over traditional institutions.
Challenges in the Challenger Banks In North America Market
The market faces several challenges including regulatory hurdles regarding compliance and licensing, intense competition from established players and other fintech firms, and the need for significant investment in technology and customer acquisition. These factors can affect profitability and market share, potentially reducing the CAGR. The estimated impact of these challenges on market growth is a reduction in CAGR by approximately xx% in the forecast period.
Forces Driving Challenger Banks In North America Growth
Key growth drivers include advancements in technology like AI and machine learning, increased customer demand for digital banking experiences, and evolving regulatory frameworks that support innovation. The growth of mobile-first banking adoption and the increasing financial inclusion initiatives also contribute to market expansion.
Challenges in the Challenger Banks In North America Market
Long-term growth will depend on continuous innovation, strategic partnerships with other fintech players, and successful expansion into new market segments. Further strengthening customer trust and building strong brand recognition are also crucial factors for long-term success.
Emerging Opportunities in Challenger Banks In North America
Emerging opportunities include expanding into underserved markets, leveraging embedded finance strategies, and developing innovative products that address niche customer needs. Exploring the use of blockchain technology and the growing demand for sustainable banking solutions also offer significant potential for growth.
Leading Players in the Challenger Banks In North America Sector
- Chime
- Varo
- Aspiration
- MoneyLion
- Qapital
- BankMobile
- Upgrade
- Dave
- Zero
- Stash
- Deserve
- Current
Key Milestones in Challenger Banks In North America Industry
- March 2023: Varo Bank raises USD 50 Million at a USD 1.8 Billion valuation, a 28% decline from its previous valuation.
- October 2022: Aspiration launches its Aspiration Zero Credit Card.
Strategic Outlook for Challenger Banks In North America Market
The North American challenger bank market presents significant future potential. Strategic opportunities lie in fostering innovation, leveraging technological advancements, and capitalizing on evolving consumer preferences. Focusing on customer experience, financial inclusion, and sustainable practices will be key to long-term success in this dynamic and competitive market.
Challenger Banks In North America Segmentation
-
1. Service Type
- 1.1. Loans
- 1.2. Mobile Banking
- 1.3. Checking & Savings Account
- 1.4. Payment & Money Transfer
- 1.5. Others
-
2. End-User Type
- 2.1. Business
- 2.2. Personal
Challenger Banks In North America Segmentation By Geography
-
1. North America
- 1.1. United States
- 1.2. Canada
- 1.3. Mexico
-
2. South America
- 2.1. Brazil
- 2.2. Argentina
- 2.3. Rest of South America
-
3. Europe
- 3.1. United Kingdom
- 3.2. Germany
- 3.3. France
- 3.4. Italy
- 3.5. Spain
- 3.6. Russia
- 3.7. Benelux
- 3.8. Nordics
- 3.9. Rest of Europe
-
4. Middle East & Africa
- 4.1. Turkey
- 4.2. Israel
- 4.3. GCC
- 4.4. North Africa
- 4.5. South Africa
- 4.6. Rest of Middle East & Africa
-
5. Asia Pacific
- 5.1. China
- 5.2. India
- 5.3. Japan
- 5.4. South Korea
- 5.5. ASEAN
- 5.6. Oceania
- 5.7. Rest of Asia Pacific
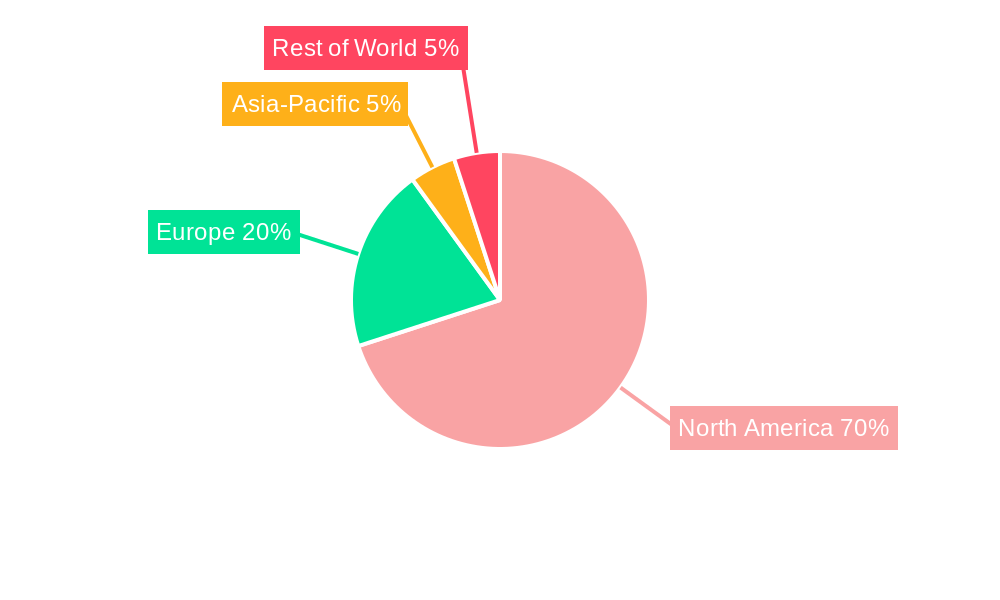
Challenger Banks In North America Regional Market Share
Geographic Coverage of Challenger Banks In North America
Challenger Banks In North America REPORT HIGHLIGHTS
| Aspects | Details |
|---|---|
| Study Period | 2020-2034 |
| Base Year | 2025 |
| Estimated Year | 2026 |
| Forecast Period | 2026-2034 |
| Historical Period | 2020-2025 |
| Growth Rate | CAGR of 9.12% from 2020-2034 |
| Segmentation |
|
Table of Contents
- 1. Introduction
- 1.1. Research Scope
- 1.2. Market Segmentation
- 1.3. Research Objective
- 1.4. Definitions and Assumptions
- 2. Executive Summary
- 2.1. Market Snapshot
- 3. Market Dynamics
- 3.1. Market Drivers
- 3.2. Market Restrains
- 3.3. Market Trends
- 3.4. Market Opportunities
- 4. Market Factor Analysis
- 4.1. Porters Five Forces
- 4.1.1. Bargaining Power of Suppliers
- 4.1.2. Bargaining Power of Buyers
- 4.1.3. Threat of New Entrants
- 4.1.4. Threat of Substitutes
- 4.1.5. Competitive Rivalry
- 4.2. PESTEL analysis
- 4.3. BCG Analysis
- 4.3.1. Stars (High Growth, High Market Share)
- 4.3.2. Cash Cows (Low Growth, High Market Share)
- 4.3.3. Question Mark (High Growth, Low Market Share)
- 4.3.4. Dogs (Low Growth, Low Market Share)
- 4.4. Ansoff Matrix Analysis
- 4.5. Supply Chain Analysis
- 4.6. Regulatory Landscape
- 4.7. Current Market Potential and Opportunity Assessment (TAM–SAM–SOM Framework)
- 4.8. MSR Analyst Note
- 4.1. Porters Five Forces
- 5. Market Analysis, Insights and Forecast 2021-2033
- 5.1. Market Analysis, Insights and Forecast - by Service Type
- 5.1.1. Loans
- 5.1.2. Mobile Banking
- 5.1.3. Checking & Savings Account
- 5.1.4. Payment & Money Transfer
- 5.1.5. Others
- 5.2. Market Analysis, Insights and Forecast - by End-User Type
- 5.2.1. Business
- 5.2.2. Personal
- 5.3. Market Analysis, Insights and Forecast - by Region
- 5.3.1. North America
- 5.3.2. South America
- 5.3.3. Europe
- 5.3.4. Middle East & Africa
- 5.3.5. Asia Pacific
- 5.1. Market Analysis, Insights and Forecast - by Service Type
- 6. Global Challenger Banks In North America Analysis, Insights and Forecast, 2021-2033
- 6.1. Market Analysis, Insights and Forecast - by Service Type
- 6.1.1. Loans
- 6.1.2. Mobile Banking
- 6.1.3. Checking & Savings Account
- 6.1.4. Payment & Money Transfer
- 6.1.5. Others
- 6.2. Market Analysis, Insights and Forecast - by End-User Type
- 6.2.1. Business
- 6.2.2. Personal
- 6.1. Market Analysis, Insights and Forecast - by Service Type
- 7. North America Challenger Banks In North America Analysis, Insights and Forecast, 2020-2032
- 7.1. Market Analysis, Insights and Forecast - by Service Type
- 7.1.1. Loans
- 7.1.2. Mobile Banking
- 7.1.3. Checking & Savings Account
- 7.1.4. Payment & Money Transfer
- 7.1.5. Others
- 7.2. Market Analysis, Insights and Forecast - by End-User Type
- 7.2.1. Business
- 7.2.2. Personal
- 7.1. Market Analysis, Insights and Forecast - by Service Type
- 8. South America Challenger Banks In North America Analysis, Insights and Forecast, 2020-2032
- 8.1. Market Analysis, Insights and Forecast - by Service Type
- 8.1.1. Loans
- 8.1.2. Mobile Banking
- 8.1.3. Checking & Savings Account
- 8.1.4. Payment & Money Transfer
- 8.1.5. Others
- 8.2. Market Analysis, Insights and Forecast - by End-User Type
- 8.2.1. Business
- 8.2.2. Personal
- 8.1. Market Analysis, Insights and Forecast - by Service Type
- 9. Europe Challenger Banks In North America Analysis, Insights and Forecast, 2020-2032
- 9.1. Market Analysis, Insights and Forecast - by Service Type
- 9.1.1. Loans
- 9.1.2. Mobile Banking
- 9.1.3. Checking & Savings Account
- 9.1.4. Payment & Money Transfer
- 9.1.5. Others
- 9.2. Market Analysis, Insights and Forecast - by End-User Type
- 9.2.1. Business
- 9.2.2. Personal
- 9.1. Market Analysis, Insights and Forecast - by Service Type
- 10. Middle East & Africa Challenger Banks In North America Analysis, Insights and Forecast, 2020-2032
- 10.1. Market Analysis, Insights and Forecast - by Service Type
- 10.1.1. Loans
- 10.1.2. Mobile Banking
- 10.1.3. Checking & Savings Account
- 10.1.4. Payment & Money Transfer
- 10.1.5. Others
- 10.2. Market Analysis, Insights and Forecast - by End-User Type
- 10.2.1. Business
- 10.2.2. Personal
- 10.1. Market Analysis, Insights and Forecast - by Service Type
- 11. Asia Pacific Challenger Banks In North America Analysis, Insights and Forecast, 2020-2032
- 11.1. Market Analysis, Insights and Forecast - by Service Type
- 11.1.1. Loans
- 11.1.2. Mobile Banking
- 11.1.3. Checking & Savings Account
- 11.1.4. Payment & Money Transfer
- 11.1.5. Others
- 11.2. Market Analysis, Insights and Forecast - by End-User Type
- 11.2.1. Business
- 11.2.2. Personal
- 11.1. Market Analysis, Insights and Forecast - by Service Type
- 12. Competitive Analysis
- 12.1. Company Profiles
- 12.1.1 Chime
- 12.1.1.1. Company Overview
- 12.1.1.2. Products
- 12.1.1.3. Company Financials
- 12.1.1.4. SWOT Analysis
- 12.1.2 Varo
- 12.1.2.1. Company Overview
- 12.1.2.2. Products
- 12.1.2.3. Company Financials
- 12.1.2.4. SWOT Analysis
- 12.1.3 Aspiration
- 12.1.3.1. Company Overview
- 12.1.3.2. Products
- 12.1.3.3. Company Financials
- 12.1.3.4. SWOT Analysis
- 12.1.4 MoneyLion
- 12.1.4.1. Company Overview
- 12.1.4.2. Products
- 12.1.4.3. Company Financials
- 12.1.4.4. SWOT Analysis
- 12.1.5 Qapital
- 12.1.5.1. Company Overview
- 12.1.5.2. Products
- 12.1.5.3. Company Financials
- 12.1.5.4. SWOT Analysis
- 12.1.6 BankMobile
- 12.1.6.1. Company Overview
- 12.1.6.2. Products
- 12.1.6.3. Company Financials
- 12.1.6.4. SWOT Analysis
- 12.1.7 Upgrade
- 12.1.7.1. Company Overview
- 12.1.7.2. Products
- 12.1.7.3. Company Financials
- 12.1.7.4. SWOT Analysis
- 12.1.8 Dave
- 12.1.8.1. Company Overview
- 12.1.8.2. Products
- 12.1.8.3. Company Financials
- 12.1.8.4. SWOT Analysis
- 12.1.9 Zero
- 12.1.9.1. Company Overview
- 12.1.9.2. Products
- 12.1.9.3. Company Financials
- 12.1.9.4. SWOT Analysis
- 12.1.10 Stash
- 12.1.10.1. Company Overview
- 12.1.10.2. Products
- 12.1.10.3. Company Financials
- 12.1.10.4. SWOT Analysis
- 12.1.11 Deserve
- 12.1.11.1. Company Overview
- 12.1.11.2. Products
- 12.1.11.3. Company Financials
- 12.1.11.4. SWOT Analysis
- 12.1.12 Current**List Not Exhaustive
- 12.1.12.1. Company Overview
- 12.1.12.2. Products
- 12.1.12.3. Company Financials
- 12.1.12.4. SWOT Analysis
- 12.1.1 Chime
- 12.2. Market Entropy
- 12.2.1 Company's Key Areas Served
- 12.2.2 Recent Developments
- 12.3. Company Market Share Analysis 2025
- 12.3.1 Top 5 Companies Market Share Analysis
- 12.3.2 Top 3 Companies Market Share Analysis
- 12.4. List of Potential Customers
- 13. Research Methodology
List of Figures
- Figure 1: Global Challenger Banks In North America Revenue Breakdown (Million, %) by Region 2025 & 2033
- Figure 2: Global Challenger Banks In North America Volume Breakdown (Billion, %) by Region 2025 & 2033
- Figure 3: North America Challenger Banks In North America Revenue (Million), by Service Type 2025 & 2033
- Figure 4: North America Challenger Banks In North America Volume (Billion), by Service Type 2025 & 2033
- Figure 5: North America Challenger Banks In North America Revenue Share (%), by Service Type 2025 & 2033
- Figure 6: North America Challenger Banks In North America Volume Share (%), by Service Type 2025 & 2033
- Figure 7: North America Challenger Banks In North America Revenue (Million), by End-User Type 2025 & 2033
- Figure 8: North America Challenger Banks In North America Volume (Billion), by End-User Type 2025 & 2033
- Figure 9: North America Challenger Banks In North America Revenue Share (%), by End-User Type 2025 & 2033
- Figure 10: North America Challenger Banks In North America Volume Share (%), by End-User Type 2025 & 2033
- Figure 11: North America Challenger Banks In North America Revenue (Million), by Country 2025 & 2033
- Figure 12: North America Challenger Banks In North America Volume (Billion), by Country 2025 & 2033
- Figure 13: North America Challenger Banks In North America Revenue Share (%), by Country 2025 & 2033
- Figure 14: North America Challenger Banks In North America Volume Share (%), by Country 2025 & 2033
- Figure 15: South America Challenger Banks In North America Revenue (Million), by Service Type 2025 & 2033
- Figure 16: South America Challenger Banks In North America Volume (Billion), by Service Type 2025 & 2033
- Figure 17: South America Challenger Banks In North America Revenue Share (%), by Service Type 2025 & 2033
- Figure 18: South America Challenger Banks In North America Volume Share (%), by Service Type 2025 & 2033
- Figure 19: South America Challenger Banks In North America Revenue (Million), by End-User Type 2025 & 2033
- Figure 20: South America Challenger Banks In North America Volume (Billion), by End-User Type 2025 & 2033
- Figure 21: South America Challenger Banks In North America Revenue Share (%), by End-User Type 2025 & 2033
- Figure 22: South America Challenger Banks In North America Volume Share (%), by End-User Type 2025 & 2033
- Figure 23: South America Challenger Banks In North America Revenue (Million), by Country 2025 & 2033
- Figure 24: South America Challenger Banks In North America Volume (Billion), by Country 2025 & 2033
- Figure 25: South America Challenger Banks In North America Revenue Share (%), by Country 2025 & 2033
- Figure 26: South America Challenger Banks In North America Volume Share (%), by Country 2025 & 2033
- Figure 27: Europe Challenger Banks In North America Revenue (Million), by Service Type 2025 & 2033
- Figure 28: Europe Challenger Banks In North America Volume (Billion), by Service Type 2025 & 2033
- Figure 29: Europe Challenger Banks In North America Revenue Share (%), by Service Type 2025 & 2033
- Figure 30: Europe Challenger Banks In North America Volume Share (%), by Service Type 2025 & 2033
- Figure 31: Europe Challenger Banks In North America Revenue (Million), by End-User Type 2025 & 2033
- Figure 32: Europe Challenger Banks In North America Volume (Billion), by End-User Type 2025 & 2033
- Figure 33: Europe Challenger Banks In North America Revenue Share (%), by End-User Type 2025 & 2033
- Figure 34: Europe Challenger Banks In North America Volume Share (%), by End-User Type 2025 & 2033
- Figure 35: Europe Challenger Banks In North America Revenue (Million), by Country 2025 & 2033
- Figure 36: Europe Challenger Banks In North America Volume (Billion), by Country 2025 & 2033
- Figure 37: Europe Challenger Banks In North America Revenue Share (%), by Country 2025 & 2033
- Figure 38: Europe Challenger Banks In North America Volume Share (%), by Country 2025 & 2033
- Figure 39: Middle East & Africa Challenger Banks In North America Revenue (Million), by Service Type 2025 & 2033
- Figure 40: Middle East & Africa Challenger Banks In North America Volume (Billion), by Service Type 2025 & 2033
- Figure 41: Middle East & Africa Challenger Banks In North America Revenue Share (%), by Service Type 2025 & 2033
- Figure 42: Middle East & Africa Challenger Banks In North America Volume Share (%), by Service Type 2025 & 2033
- Figure 43: Middle East & Africa Challenger Banks In North America Revenue (Million), by End-User Type 2025 & 2033
- Figure 44: Middle East & Africa Challenger Banks In North America Volume (Billion), by End-User Type 2025 & 2033
- Figure 45: Middle East & Africa Challenger Banks In North America Revenue Share (%), by End-User Type 2025 & 2033
- Figure 46: Middle East & Africa Challenger Banks In North America Volume Share (%), by End-User Type 2025 & 2033
- Figure 47: Middle East & Africa Challenger Banks In North America Revenue (Million), by Country 2025 & 2033
- Figure 48: Middle East & Africa Challenger Banks In North America Volume (Billion), by Country 2025 & 2033
- Figure 49: Middle East & Africa Challenger Banks In North America Revenue Share (%), by Country 2025 & 2033
- Figure 50: Middle East & Africa Challenger Banks In North America Volume Share (%), by Country 2025 & 2033
- Figure 51: Asia Pacific Challenger Banks In North America Revenue (Million), by Service Type 2025 & 2033
- Figure 52: Asia Pacific Challenger Banks In North America Volume (Billion), by Service Type 2025 & 2033
- Figure 53: Asia Pacific Challenger Banks In North America Revenue Share (%), by Service Type 2025 & 2033
- Figure 54: Asia Pacific Challenger Banks In North America Volume Share (%), by Service Type 2025 & 2033
- Figure 55: Asia Pacific Challenger Banks In North America Revenue (Million), by End-User Type 2025 & 2033
- Figure 56: Asia Pacific Challenger Banks In North America Volume (Billion), by End-User Type 2025 & 2033
- Figure 57: Asia Pacific Challenger Banks In North America Revenue Share (%), by End-User Type 2025 & 2033
- Figure 58: Asia Pacific Challenger Banks In North America Volume Share (%), by End-User Type 2025 & 2033
- Figure 59: Asia Pacific Challenger Banks In North America Revenue (Million), by Country 2025 & 2033
- Figure 60: Asia Pacific Challenger Banks In North America Volume (Billion), by Country 2025 & 2033
- Figure 61: Asia Pacific Challenger Banks In North America Revenue Share (%), by Country 2025 & 2033
- Figure 62: Asia Pacific Challenger Banks In North America Volume Share (%), by Country 2025 & 2033
List of Tables
- Table 1: Global Challenger Banks In North America Revenue Million Forecast, by Service Type 2020 & 2033
- Table 2: Global Challenger Banks In North America Volume Billion Forecast, by Service Type 2020 & 2033
- Table 3: Global Challenger Banks In North America Revenue Million Forecast, by End-User Type 2020 & 2033
- Table 4: Global Challenger Banks In North America Volume Billion Forecast, by End-User Type 2020 & 2033
- Table 5: Global Challenger Banks In North America Revenue Million Forecast, by Region 2020 & 2033
- Table 6: Global Challenger Banks In North America Volume Billion Forecast, by Region 2020 & 2033
- Table 7: Global Challenger Banks In North America Revenue Million Forecast, by Service Type 2020 & 2033
- Table 8: Global Challenger Banks In North America Volume Billion Forecast, by Service Type 2020 & 2033
- Table 9: Global Challenger Banks In North America Revenue Million Forecast, by End-User Type 2020 & 2033
- Table 10: Global Challenger Banks In North America Volume Billion Forecast, by End-User Type 2020 & 2033
- Table 11: Global Challenger Banks In North America Revenue Million Forecast, by Country 2020 & 2033
- Table 12: Global Challenger Banks In North America Volume Billion Forecast, by Country 2020 & 2033
- Table 13: United States Challenger Banks In North America Revenue (Million) Forecast, by Application 2020 & 2033
- Table 14: United States Challenger Banks In North America Volume (Billion) Forecast, by Application 2020 & 2033
- Table 15: Canada Challenger Banks In North America Revenue (Million) Forecast, by Application 2020 & 2033
- Table 16: Canada Challenger Banks In North America Volume (Billion) Forecast, by Application 2020 & 2033
- Table 17: Mexico Challenger Banks In North America Revenue (Million) Forecast, by Application 2020 & 2033
- Table 18: Mexico Challenger Banks In North America Volume (Billion) Forecast, by Application 2020 & 2033
- Table 19: Global Challenger Banks In North America Revenue Million Forecast, by Service Type 2020 & 2033
- Table 20: Global Challenger Banks In North America Volume Billion Forecast, by Service Type 2020 & 2033
- Table 21: Global Challenger Banks In North America Revenue Million Forecast, by End-User Type 2020 & 2033
- Table 22: Global Challenger Banks In North America Volume Billion Forecast, by End-User Type 2020 & 2033
- Table 23: Global Challenger Banks In North America Revenue Million Forecast, by Country 2020 & 2033
- Table 24: Global Challenger Banks In North America Volume Billion Forecast, by Country 2020 & 2033
- Table 25: Brazil Challenger Banks In North America Revenue (Million) Forecast, by Application 2020 & 2033
- Table 26: Brazil Challenger Banks In North America Volume (Billion) Forecast, by Application 2020 & 2033
- Table 27: Argentina Challenger Banks In North America Revenue (Million) Forecast, by Application 2020 & 2033
- Table 28: Argentina Challenger Banks In North America Volume (Billion) Forecast, by Application 2020 & 2033
- Table 29: Rest of South America Challenger Banks In North America Revenue (Million) Forecast, by Application 2020 & 2033
- Table 30: Rest of South America Challenger Banks In North America Volume (Billion) Forecast, by Application 2020 & 2033
- Table 31: Global Challenger Banks In North America Revenue Million Forecast, by Service Type 2020 & 2033
- Table 32: Global Challenger Banks In North America Volume Billion Forecast, by Service Type 2020 & 2033
- Table 33: Global Challenger Banks In North America Revenue Million Forecast, by End-User Type 2020 & 2033
- Table 34: Global Challenger Banks In North America Volume Billion Forecast, by End-User Type 2020 & 2033
- Table 35: Global Challenger Banks In North America Revenue Million Forecast, by Country 2020 & 2033
- Table 36: Global Challenger Banks In North America Volume Billion Forecast, by Country 2020 & 2033
- Table 37: United Kingdom Challenger Banks In North America Revenue (Million) Forecast, by Application 2020 & 2033
- Table 38: United Kingdom Challenger Banks In North America Volume (Billion) Forecast, by Application 2020 & 2033
- Table 39: Germany Challenger Banks In North America Revenue (Million) Forecast, by Application 2020 & 2033
- Table 40: Germany Challenger Banks In North America Volume (Billion) Forecast, by Application 2020 & 2033
- Table 41: France Challenger Banks In North America Revenue (Million) Forecast, by Application 2020 & 2033
- Table 42: France Challenger Banks In North America Volume (Billion) Forecast, by Application 2020 & 2033
- Table 43: Italy Challenger Banks In North America Revenue (Million) Forecast, by Application 2020 & 2033
- Table 44: Italy Challenger Banks In North America Volume (Billion) Forecast, by Application 2020 & 2033
- Table 45: Spain Challenger Banks In North America Revenue (Million) Forecast, by Application 2020 & 2033
- Table 46: Spain Challenger Banks In North America Volume (Billion) Forecast, by Application 2020 & 2033
- Table 47: Russia Challenger Banks In North America Revenue (Million) Forecast, by Application 2020 & 2033
- Table 48: Russia Challenger Banks In North America Volume (Billion) Forecast, by Application 2020 & 2033
- Table 49: Benelux Challenger Banks In North America Revenue (Million) Forecast, by Application 2020 & 2033
- Table 50: Benelux Challenger Banks In North America Volume (Billion) Forecast, by Application 2020 & 2033
- Table 51: Nordics Challenger Banks In North America Revenue (Million) Forecast, by Application 2020 & 2033
- Table 52: Nordics Challenger Banks In North America Volume (Billion) Forecast, by Application 2020 & 2033
- Table 53: Rest of Europe Challenger Banks In North America Revenue (Million) Forecast, by Application 2020 & 2033
- Table 54: Rest of Europe Challenger Banks In North America Volume (Billion) Forecast, by Application 2020 & 2033
- Table 55: Global Challenger Banks In North America Revenue Million Forecast, by Service Type 2020 & 2033
- Table 56: Global Challenger Banks In North America Volume Billion Forecast, by Service Type 2020 & 2033
- Table 57: Global Challenger Banks In North America Revenue Million Forecast, by End-User Type 2020 & 2033
- Table 58: Global Challenger Banks In North America Volume Billion Forecast, by End-User Type 2020 & 2033
- Table 59: Global Challenger Banks In North America Revenue Million Forecast, by Country 2020 & 2033
- Table 60: Global Challenger Banks In North America Volume Billion Forecast, by Country 2020 & 2033
- Table 61: Turkey Challenger Banks In North America Revenue (Million) Forecast, by Application 2020 & 2033
- Table 62: Turkey Challenger Banks In North America Volume (Billion) Forecast, by Application 2020 & 2033
- Table 63: Israel Challenger Banks In North America Revenue (Million) Forecast, by Application 2020 & 2033
- Table 64: Israel Challenger Banks In North America Volume (Billion) Forecast, by Application 2020 & 2033
- Table 65: GCC Challenger Banks In North America Revenue (Million) Forecast, by Application 2020 & 2033
- Table 66: GCC Challenger Banks In North America Volume (Billion) Forecast, by Application 2020 & 2033
- Table 67: North Africa Challenger Banks In North America Revenue (Million) Forecast, by Application 2020 & 2033
- Table 68: North Africa Challenger Banks In North America Volume (Billion) Forecast, by Application 2020 & 2033
- Table 69: South Africa Challenger Banks In North America Revenue (Million) Forecast, by Application 2020 & 2033
- Table 70: South Africa Challenger Banks In North America Volume (Billion) Forecast, by Application 2020 & 2033
- Table 71: Rest of Middle East & Africa Challenger Banks In North America Revenue (Million) Forecast, by Application 2020 & 2033
- Table 72: Rest of Middle East & Africa Challenger Banks In North America Volume (Billion) Forecast, by Application 2020 & 2033
- Table 73: Global Challenger Banks In North America Revenue Million Forecast, by Service Type 2020 & 2033
- Table 74: Global Challenger Banks In North America Volume Billion Forecast, by Service Type 2020 & 2033
- Table 75: Global Challenger Banks In North America Revenue Million Forecast, by End-User Type 2020 & 2033
- Table 76: Global Challenger Banks In North America Volume Billion Forecast, by End-User Type 2020 & 2033
- Table 77: Global Challenger Banks In North America Revenue Million Forecast, by Country 2020 & 2033
- Table 78: Global Challenger Banks In North America Volume Billion Forecast, by Country 2020 & 2033
- Table 79: China Challenger Banks In North America Revenue (Million) Forecast, by Application 2020 & 2033
- Table 80: China Challenger Banks In North America Volume (Billion) Forecast, by Application 2020 & 2033
- Table 81: India Challenger Banks In North America Revenue (Million) Forecast, by Application 2020 & 2033
- Table 82: India Challenger Banks In North America Volume (Billion) Forecast, by Application 2020 & 2033
- Table 83: Japan Challenger Banks In North America Revenue (Million) Forecast, by Application 2020 & 2033
- Table 84: Japan Challenger Banks In North America Volume (Billion) Forecast, by Application 2020 & 2033
- Table 85: South Korea Challenger Banks In North America Revenue (Million) Forecast, by Application 2020 & 2033
- Table 86: South Korea Challenger Banks In North America Volume (Billion) Forecast, by Application 2020 & 2033
- Table 87: ASEAN Challenger Banks In North America Revenue (Million) Forecast, by Application 2020 & 2033
- Table 88: ASEAN Challenger Banks In North America Volume (Billion) Forecast, by Application 2020 & 2033
- Table 89: Oceania Challenger Banks In North America Revenue (Million) Forecast, by Application 2020 & 2033
- Table 90: Oceania Challenger Banks In North America Volume (Billion) Forecast, by Application 2020 & 2033
- Table 91: Rest of Asia Pacific Challenger Banks In North America Revenue (Million) Forecast, by Application 2020 & 2033
- Table 92: Rest of Asia Pacific Challenger Banks In North America Volume (Billion) Forecast, by Application 2020 & 2033
Frequently Asked Questions
1. What is the projected Compound Annual Growth Rate (CAGR) of the Challenger Banks In North America?
The projected CAGR is approximately 9.12%.
2. Which companies are prominent players in the Challenger Banks In North America?
Key companies in the market include Chime, Varo, Aspiration, MoneyLion, Qapital, BankMobile, Upgrade, Dave, Zero, Stash, Deserve, Current**List Not Exhaustive.
3. What are the main segments of the Challenger Banks In North America?
The market segments include Service Type, End-User Type.
4. Can you provide details about the market size?
The market size is estimated to be USD 10 Million as of 2022.
5. What are some drivers contributing to market growth?
N/A
6. What are the notable trends driving market growth?
Convenience Offered to Consumers Drives The Market.
7. Are there any restraints impacting market growth?
N/A
8. Can you provide examples of recent developments in the market?
March 2023: US challenger Varo Bank is reportedly raising USD 50 million at a USD 1.8 billion valuation, a 28% decline in value since its last fundraising. The firm was valued at USD 2.5 billion in September 2021 after raising USD 510 million in a Series E funding round led by Lone Pine Capital.
9. What pricing options are available for accessing the report?
Pricing options include single-user, multi-user, and enterprise licenses priced at USD 4750, USD 4950, and USD 6800 respectively.
10. Is the market size provided in terms of value or volume?
The market size is provided in terms of value, measured in Million and volume, measured in Billion.
11. Are there any specific market keywords associated with the report?
Yes, the market keyword associated with the report is "Challenger Banks In North America," which aids in identifying and referencing the specific market segment covered.
12. How do I determine which pricing option suits my needs best?
The pricing options vary based on user requirements and access needs. Individual users may opt for single-user licenses, while businesses requiring broader access may choose multi-user or enterprise licenses for cost-effective access to the report.
13. Are there any additional resources or data provided in the Challenger Banks In North America report?
While the report offers comprehensive insights, it's advisable to review the specific contents or supplementary materials provided to ascertain if additional resources or data are available.
14. How can I stay updated on further developments or reports in the Challenger Banks In North America?
To stay informed about further developments, trends, and reports in the Challenger Banks In North America, consider subscribing to industry newsletters, following relevant companies and organizations, or regularly checking reputable industry news sources and publications.
Methodology
Step 1 - Identification of Relevant Samples Size from Population Database


Step 2 - Approaches for Defining Global Market Size (Value, Volume* & Price*)

Note*: In applicable scenarios
Step 3 - Data Sources
Primary Research
- Web Analytics
- Survey Reports
- Research Institute
- Latest Research Reports
- Opinion Leaders
Secondary Research
- Annual Reports
- White Paper
- Latest Press Release
- Industry Association
- Paid Database
- Investor Presentations

Step 4 - Data Triangulation
Involves using different sources of information in order to increase the validity of a study
These sources are likely to be stakeholders in a program - participants, other researchers, program staff, other community members, and so on.
Then we put all data in single framework & apply various statistical tools to find out the dynamic on the market.
During the analysis stage, feedback from the stakeholder groups would be compared to determine areas of agreement as well as areas of divergence