

Key Insights
The Netherlands' electronic brokerage sector demonstrates significant growth potential, aligning with broader European market expansion. Leveraging the nation's advanced digital infrastructure, high internet penetration, and a mature financial ecosystem, the estimated market size for 2024 is €1.12 billion. This projection, derived from analysis of comparable EU markets adjusted for Dutch demographic and financial activity metrics, reflects a robust outlook. The historical period (2019-2024) experienced consistent growth, propelled by increased retail online trading, the proliferation of mobile trading applications, and the adoption of algorithmic strategies by institutional investors. The forecast period (2025-2033) anticipates sustained expansion, driven by technological innovation, evolving regulatory frameworks, and heightened demand for efficient, cost-effective brokerage solutions. An estimated Compound Annual Growth Rate (CAGR) of 7.3% is projected, balancing market expansion with potential saturation. This trajectory suggests a market size exceeding €1.12 billion by 2024. Expect intensified competition among established entities and fintech innovators, alongside ongoing adaptation to regulatory changes and the integration of cutting-edge financial technologies.
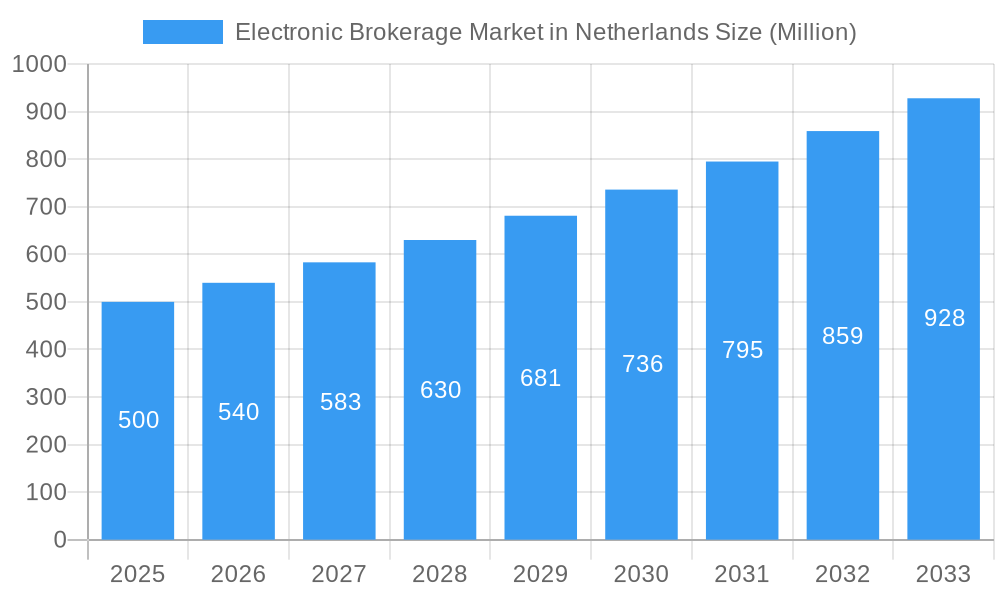
Electronic Brokerage Market in Netherlands Market Size (In Billion)
Electronic brokerage firms in the Netherlands will achieve success through intuitive platforms, competitive pricing, stringent security protocols, and superior customer support. Market consolidation is anticipated as smaller firms face challenges against larger entities offering comprehensive services and advanced technology. Key growth avenues include the expansion of robo-advisory services and the integration of artificial intelligence to enhance trading capabilities and investment strategies. Shifting investor preferences, particularly among digitally native younger demographics, will continue to be a significant market determinant.
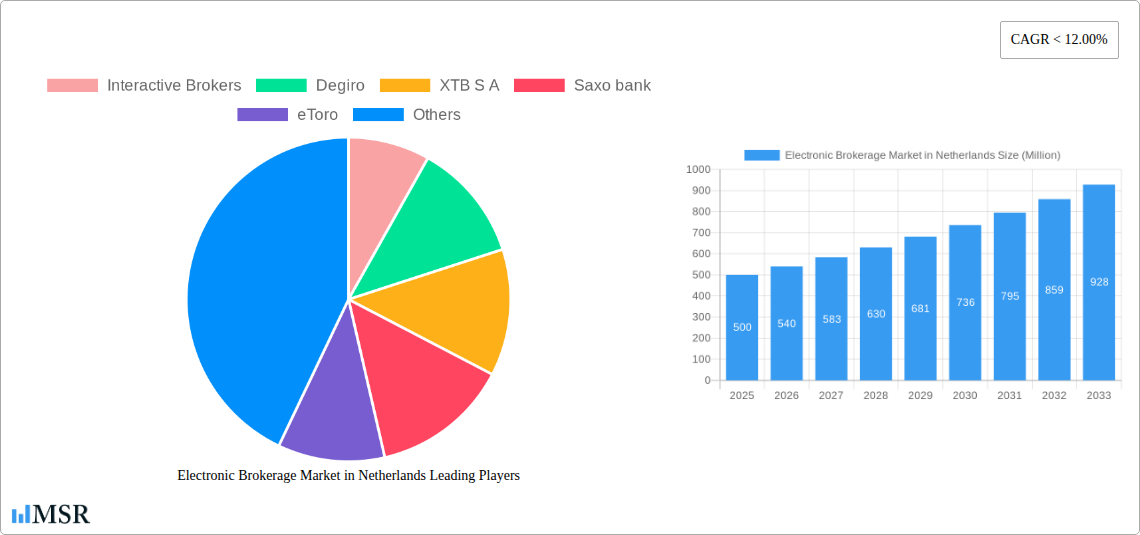
Electronic Brokerage Market in Netherlands Company Market Share
Electronic Brokerage Market in Netherlands: A Comprehensive Report (2019-2033)
This in-depth report provides a comprehensive analysis of the Electronic Brokerage Market in the Netherlands, covering market dynamics, industry trends, key players, and future opportunities. The study period spans from 2019 to 2033, with 2025 serving as the base and estimated year. The report offers actionable insights for industry stakeholders, investors, and businesses seeking to understand and capitalize on this dynamic market.
Electronic Brokerage Market in Netherlands Market Concentration & Dynamics
This section assesses the competitive landscape, regulatory environment, and market forces shaping the Dutch electronic brokerage sector. The market exhibits moderate concentration, with several key players vying for market share.
Market Share: While precise figures require further research, Degiro and Interactive Brokers are predicted to hold significant market share in 2025, followed by XTB S.A., Saxo Bank, and eToro. Other players such as Lynx, IC Markets, RoboForex, and FP Markets contribute to the competitive intensity. The exact market share for each company in 2025 is estimated at xx%.
Innovation Ecosystems: The Netherlands boasts a robust fintech ecosystem fostering innovation in trading technologies, mobile platforms, and algorithmic trading strategies.
Regulatory Frameworks: The Dutch regulatory environment, primarily governed by De Nederlandsche Bank (DNB), plays a significant role in shaping market practices and ensuring investor protection. Compliance with MiFID II and other EU regulations remains crucial.
Substitute Products: Traditional brokerage services and direct investment options pose some competitive pressure. However, the convenience and technological advancements of electronic brokerage continue to drive market growth.
End-User Trends: Growing digital literacy, coupled with the increasing popularity of online investing and trading among retail and institutional investors, fuels demand for electronic brokerage services.
M&A Activities: The market has witnessed significant M&A activity. For example, the 2020 acquisition of DEGIRO by Flatex exemplifies the consolidation trend, with a total investment of EUR 59.4 million (EUR 23.6 million initial and EUR 36.4 million subsequent). The number of M&A deals in the period 2019-2024 is estimated at xx.
Electronic Brokerage Market in Netherlands Industry Insights & Trends
The Dutch electronic brokerage market demonstrates robust growth, driven by several key factors. The market size in 2025 is estimated at xx Million, exhibiting a Compound Annual Growth Rate (CAGR) of xx% during the forecast period (2025-2033).
Several factors contribute to this growth:
- Increased retail investor participation: The pandemic spurred a surge in online investing, driving demand for user-friendly platforms.
- Technological advancements: Improved trading platforms, mobile apps, and AI-driven tools enhance the user experience and trading efficiency.
- Expanding product offerings: Brokerage firms continually expand their product portfolios to encompass ETFs, cryptocurrencies, and other investment instruments.
- Growing adoption of mobile trading: The convenience of mobile trading platforms further accelerates market penetration.
- Competitive pricing models: Increased competition leads to more competitive pricing, making electronic brokerage more accessible.
- Industry Developments: The entry of Scalable Capital in September 2022 signifies the continued interest and investment in the Dutch market.
Key Markets & Segments Leading Electronic Brokerage Market in Netherlands
The retail investor segment dominates the Dutch electronic brokerage market. This is driven by:
- Economic Growth: A relatively strong Dutch economy fuels disposable income and investment appetite.
- Financial Literacy: Increased financial awareness among the Dutch population contributes to participation in online investment platforms.
- Technological Infrastructure: Excellent internet penetration and digital infrastructure support seamless online trading.
The dominance of the retail segment is underpinned by the accessibility and ease of use provided by electronic platforms. Institutional investors also utilize electronic brokerage services, though their share is smaller compared to the retail segment.
Electronic Brokerage Market in Netherlands Product Developments
Recent product innovations include advanced charting tools, sophisticated order management systems, fractional share trading, and enhanced mobile apps with personalized investment advice. These advancements cater to evolving user preferences and create competitive advantages for brokerage firms. The integration of AI-powered tools for portfolio management and algorithmic trading represents a significant technological leap.
Challenges in the Electronic Brokerage Market in Netherlands Market
The market faces challenges such as:
- Regulatory Scrutiny: Stricter regulations can increase compliance costs and operational complexity.
- Cybersecurity Threats: The increasing reliance on digital platforms raises concerns about data breaches and cyberattacks, necessitating robust security measures.
- Intense Competition: A highly competitive market necessitates continuous innovation and differentiation to retain market share.
- Economic Downturns: A potential economic slowdown could negatively impact investor confidence and trading activity, potentially lowering trading volume.
Forces Driving Electronic Brokerage Market in Netherlands Growth
Key growth drivers include technological advancements, increasing financial literacy, and supportive regulatory frameworks. Technological innovations such as AI-driven portfolio management and advanced charting tools enhance the user experience. Furthermore, government initiatives promoting financial inclusion and investor education contribute positively to market expansion.
Long-Term Growth Catalysts in the Electronic Brokerage Market in Netherlands
Long-term growth will be driven by:
The continued development of innovative trading platforms, strategic partnerships with financial institutions, and expansion into new product offerings (e.g., ESG investing). Internationalization and expansion into adjacent markets are also expected to be major drivers.
Emerging Opportunities in Electronic Brokerage Market in Netherlands
Emerging opportunities include personalized investment advisory services, the increasing adoption of cryptocurrencies, and the growth of sustainable and ethical investing options. Brokerages that integrate these trends into their offerings are poised for significant growth.
Leading Players in the Electronic Brokerage Market in Netherlands Sector
- Interactive Brokers
- Degiro
- XTB S.A.
- Saxo Bank
- eToro
- Euronext Group
- LYNX
- IC Markets
- RoboForex
- FP Markets (List Not Exhaustive)
Key Milestones in Electronic Brokerage Market in Netherlands Industry
- September 2022: Scalable Capital expands its presence in the Netherlands, offering cost-effective trading and saving plans. This significantly impacts market competition and product offerings.
- 2020: Flatex acquires DEGIRO, demonstrating a major consolidation within the market and influencing the competitive landscape.
Strategic Outlook for Electronic Brokerage Market in Netherlands Market
The Dutch electronic brokerage market holds significant future potential. Strategic opportunities for growth include technological innovation, expansion into niche markets, and the development of personalized investment solutions. Companies that successfully adapt to evolving investor preferences and embrace technological advancements are best positioned for long-term success.
Electronic Brokerage Market in Netherlands Segmentation
-
1. Investor Type
- 1.1. Retail
- 1.2. Institutional
-
2. Services Provided
- 2.1. Full Time Brokers
- 2.2. Discount Brokers
-
3. Operation
- 3.1. Domestic
- 3.2. International
Electronic Brokerage Market in Netherlands Segmentation By Geography
-
1. North America
- 1.1. United States
- 1.2. Canada
- 1.3. Mexico
-
2. South America
- 2.1. Brazil
- 2.2. Argentina
- 2.3. Rest of South America
-
3. Europe
- 3.1. United Kingdom
- 3.2. Germany
- 3.3. France
- 3.4. Italy
- 3.5. Spain
- 3.6. Russia
- 3.7. Benelux
- 3.8. Nordics
- 3.9. Rest of Europe
-
4. Middle East & Africa
- 4.1. Turkey
- 4.2. Israel
- 4.3. GCC
- 4.4. North Africa
- 4.5. South Africa
- 4.6. Rest of Middle East & Africa
-
5. Asia Pacific
- 5.1. China
- 5.2. India
- 5.3. Japan
- 5.4. South Korea
- 5.5. ASEAN
- 5.6. Oceania
- 5.7. Rest of Asia Pacific
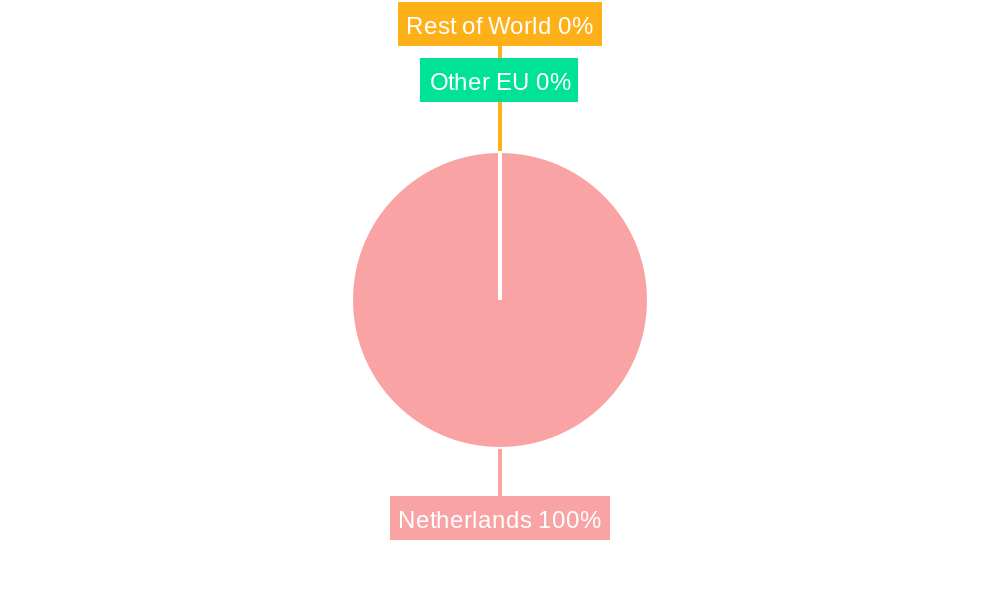
Electronic Brokerage Market in Netherlands Regional Market Share
Geographic Coverage of Electronic Brokerage Market in Netherlands
Electronic Brokerage Market in Netherlands REPORT HIGHLIGHTS
| Aspects | Details |
|---|---|
| Study Period | 2020-2034 |
| Base Year | 2025 |
| Estimated Year | 2026 |
| Forecast Period | 2026-2034 |
| Historical Period | 2020-2025 |
| Growth Rate | CAGR of 7.3% from 2020-2034 |
| Segmentation |
|
Table of Contents
- 1. Introduction
- 1.1. Research Scope
- 1.2. Market Segmentation
- 1.3. Research Objective
- 1.4. Definitions and Assumptions
- 2. Executive Summary
- 2.1. Market Snapshot
- 3. Market Dynamics
- 3.1. Market Drivers
- 3.2. Market Restrains
- 3.3. Market Trends
- 3.4. Market Opportunities
- 4. Market Factor Analysis
- 4.1. Porters Five Forces
- 4.1.1. Bargaining Power of Suppliers
- 4.1.2. Bargaining Power of Buyers
- 4.1.3. Threat of New Entrants
- 4.1.4. Threat of Substitutes
- 4.1.5. Competitive Rivalry
- 4.2. PESTEL analysis
- 4.3. BCG Analysis
- 4.3.1. Stars (High Growth, High Market Share)
- 4.3.2. Cash Cows (Low Growth, High Market Share)
- 4.3.3. Question Mark (High Growth, Low Market Share)
- 4.3.4. Dogs (Low Growth, Low Market Share)
- 4.4. Ansoff Matrix Analysis
- 4.5. Supply Chain Analysis
- 4.6. Regulatory Landscape
- 4.7. Current Market Potential and Opportunity Assessment (TAM–SAM–SOM Framework)
- 4.8. MSR Analyst Note
- 4.1. Porters Five Forces
- 5. Market Analysis, Insights and Forecast 2021-2033
- 5.1. Market Analysis, Insights and Forecast - by Investor Type
- 5.1.1. Retail
- 5.1.2. Institutional
- 5.2. Market Analysis, Insights and Forecast - by Services Provided
- 5.2.1. Full Time Brokers
- 5.2.2. Discount Brokers
- 5.3. Market Analysis, Insights and Forecast - by Operation
- 5.3.1. Domestic
- 5.3.2. International
- 5.4. Market Analysis, Insights and Forecast - by Region
- 5.4.1. North America
- 5.4.2. South America
- 5.4.3. Europe
- 5.4.4. Middle East & Africa
- 5.4.5. Asia Pacific
- 5.1. Market Analysis, Insights and Forecast - by Investor Type
- 6. Global Electronic Brokerage Market in Netherlands Analysis, Insights and Forecast, 2021-2033
- 6.1. Market Analysis, Insights and Forecast - by Investor Type
- 6.1.1. Retail
- 6.1.2. Institutional
- 6.2. Market Analysis, Insights and Forecast - by Services Provided
- 6.2.1. Full Time Brokers
- 6.2.2. Discount Brokers
- 6.3. Market Analysis, Insights and Forecast - by Operation
- 6.3.1. Domestic
- 6.3.2. International
- 6.1. Market Analysis, Insights and Forecast - by Investor Type
- 7. North America Electronic Brokerage Market in Netherlands Analysis, Insights and Forecast, 2020-2032
- 7.1. Market Analysis, Insights and Forecast - by Investor Type
- 7.1.1. Retail
- 7.1.2. Institutional
- 7.2. Market Analysis, Insights and Forecast - by Services Provided
- 7.2.1. Full Time Brokers
- 7.2.2. Discount Brokers
- 7.3. Market Analysis, Insights and Forecast - by Operation
- 7.3.1. Domestic
- 7.3.2. International
- 7.1. Market Analysis, Insights and Forecast - by Investor Type
- 8. South America Electronic Brokerage Market in Netherlands Analysis, Insights and Forecast, 2020-2032
- 8.1. Market Analysis, Insights and Forecast - by Investor Type
- 8.1.1. Retail
- 8.1.2. Institutional
- 8.2. Market Analysis, Insights and Forecast - by Services Provided
- 8.2.1. Full Time Brokers
- 8.2.2. Discount Brokers
- 8.3. Market Analysis, Insights and Forecast - by Operation
- 8.3.1. Domestic
- 8.3.2. International
- 8.1. Market Analysis, Insights and Forecast - by Investor Type
- 9. Europe Electronic Brokerage Market in Netherlands Analysis, Insights and Forecast, 2020-2032
- 9.1. Market Analysis, Insights and Forecast - by Investor Type
- 9.1.1. Retail
- 9.1.2. Institutional
- 9.2. Market Analysis, Insights and Forecast - by Services Provided
- 9.2.1. Full Time Brokers
- 9.2.2. Discount Brokers
- 9.3. Market Analysis, Insights and Forecast - by Operation
- 9.3.1. Domestic
- 9.3.2. International
- 9.1. Market Analysis, Insights and Forecast - by Investor Type
- 10. Middle East & Africa Electronic Brokerage Market in Netherlands Analysis, Insights and Forecast, 2020-2032
- 10.1. Market Analysis, Insights and Forecast - by Investor Type
- 10.1.1. Retail
- 10.1.2. Institutional
- 10.2. Market Analysis, Insights and Forecast - by Services Provided
- 10.2.1. Full Time Brokers
- 10.2.2. Discount Brokers
- 10.3. Market Analysis, Insights and Forecast - by Operation
- 10.3.1. Domestic
- 10.3.2. International
- 10.1. Market Analysis, Insights and Forecast - by Investor Type
- 11. Asia Pacific Electronic Brokerage Market in Netherlands Analysis, Insights and Forecast, 2020-2032
- 11.1. Market Analysis, Insights and Forecast - by Investor Type
- 11.1.1. Retail
- 11.1.2. Institutional
- 11.2. Market Analysis, Insights and Forecast - by Services Provided
- 11.2.1. Full Time Brokers
- 11.2.2. Discount Brokers
- 11.3. Market Analysis, Insights and Forecast - by Operation
- 11.3.1. Domestic
- 11.3.2. International
- 11.1. Market Analysis, Insights and Forecast - by Investor Type
- 12. Competitive Analysis
- 12.1. Company Profiles
- 12.1.1 Interactive Brokers
- 12.1.1.1. Company Overview
- 12.1.1.2. Products
- 12.1.1.3. Company Financials
- 12.1.1.4. SWOT Analysis
- 12.1.2 Degiro
- 12.1.2.1. Company Overview
- 12.1.2.2. Products
- 12.1.2.3. Company Financials
- 12.1.2.4. SWOT Analysis
- 12.1.3 XTB S A
- 12.1.3.1. Company Overview
- 12.1.3.2. Products
- 12.1.3.3. Company Financials
- 12.1.3.4. SWOT Analysis
- 12.1.4 Saxo bank
- 12.1.4.1. Company Overview
- 12.1.4.2. Products
- 12.1.4.3. Company Financials
- 12.1.4.4. SWOT Analysis
- 12.1.5 eToro
- 12.1.5.1. Company Overview
- 12.1.5.2. Products
- 12.1.5.3. Company Financials
- 12.1.5.4. SWOT Analysis
- 12.1.6 Euronext Group
- 12.1.6.1. Company Overview
- 12.1.6.2. Products
- 12.1.6.3. Company Financials
- 12.1.6.4. SWOT Analysis
- 12.1.7 LYNX
- 12.1.7.1. Company Overview
- 12.1.7.2. Products
- 12.1.7.3. Company Financials
- 12.1.7.4. SWOT Analysis
- 12.1.8 IC Markets
- 12.1.8.1. Company Overview
- 12.1.8.2. Products
- 12.1.8.3. Company Financials
- 12.1.8.4. SWOT Analysis
- 12.1.9 RoboForex
- 12.1.9.1. Company Overview
- 12.1.9.2. Products
- 12.1.9.3. Company Financials
- 12.1.9.4. SWOT Analysis
- 12.1.10 FP Markets**List Not Exhaustive
- 12.1.10.1. Company Overview
- 12.1.10.2. Products
- 12.1.10.3. Company Financials
- 12.1.10.4. SWOT Analysis
- 12.1.1 Interactive Brokers
- 12.2. Market Entropy
- 12.2.1 Company's Key Areas Served
- 12.2.2 Recent Developments
- 12.3. Company Market Share Analysis 2025
- 12.3.1 Top 5 Companies Market Share Analysis
- 12.3.2 Top 3 Companies Market Share Analysis
- 12.4. List of Potential Customers
- 13. Research Methodology
List of Figures
- Figure 1: Global Electronic Brokerage Market in Netherlands Revenue Breakdown (billion, %) by Region 2025 & 2033
- Figure 2: North America Electronic Brokerage Market in Netherlands Revenue (billion), by Investor Type 2025 & 2033
- Figure 3: North America Electronic Brokerage Market in Netherlands Revenue Share (%), by Investor Type 2025 & 2033
- Figure 4: North America Electronic Brokerage Market in Netherlands Revenue (billion), by Services Provided 2025 & 2033
- Figure 5: North America Electronic Brokerage Market in Netherlands Revenue Share (%), by Services Provided 2025 & 2033
- Figure 6: North America Electronic Brokerage Market in Netherlands Revenue (billion), by Operation 2025 & 2033
- Figure 7: North America Electronic Brokerage Market in Netherlands Revenue Share (%), by Operation 2025 & 2033
- Figure 8: North America Electronic Brokerage Market in Netherlands Revenue (billion), by Country 2025 & 2033
- Figure 9: North America Electronic Brokerage Market in Netherlands Revenue Share (%), by Country 2025 & 2033
- Figure 10: South America Electronic Brokerage Market in Netherlands Revenue (billion), by Investor Type 2025 & 2033
- Figure 11: South America Electronic Brokerage Market in Netherlands Revenue Share (%), by Investor Type 2025 & 2033
- Figure 12: South America Electronic Brokerage Market in Netherlands Revenue (billion), by Services Provided 2025 & 2033
- Figure 13: South America Electronic Brokerage Market in Netherlands Revenue Share (%), by Services Provided 2025 & 2033
- Figure 14: South America Electronic Brokerage Market in Netherlands Revenue (billion), by Operation 2025 & 2033
- Figure 15: South America Electronic Brokerage Market in Netherlands Revenue Share (%), by Operation 2025 & 2033
- Figure 16: South America Electronic Brokerage Market in Netherlands Revenue (billion), by Country 2025 & 2033
- Figure 17: South America Electronic Brokerage Market in Netherlands Revenue Share (%), by Country 2025 & 2033
- Figure 18: Europe Electronic Brokerage Market in Netherlands Revenue (billion), by Investor Type 2025 & 2033
- Figure 19: Europe Electronic Brokerage Market in Netherlands Revenue Share (%), by Investor Type 2025 & 2033
- Figure 20: Europe Electronic Brokerage Market in Netherlands Revenue (billion), by Services Provided 2025 & 2033
- Figure 21: Europe Electronic Brokerage Market in Netherlands Revenue Share (%), by Services Provided 2025 & 2033
- Figure 22: Europe Electronic Brokerage Market in Netherlands Revenue (billion), by Operation 2025 & 2033
- Figure 23: Europe Electronic Brokerage Market in Netherlands Revenue Share (%), by Operation 2025 & 2033
- Figure 24: Europe Electronic Brokerage Market in Netherlands Revenue (billion), by Country 2025 & 2033
- Figure 25: Europe Electronic Brokerage Market in Netherlands Revenue Share (%), by Country 2025 & 2033
- Figure 26: Middle East & Africa Electronic Brokerage Market in Netherlands Revenue (billion), by Investor Type 2025 & 2033
- Figure 27: Middle East & Africa Electronic Brokerage Market in Netherlands Revenue Share (%), by Investor Type 2025 & 2033
- Figure 28: Middle East & Africa Electronic Brokerage Market in Netherlands Revenue (billion), by Services Provided 2025 & 2033
- Figure 29: Middle East & Africa Electronic Brokerage Market in Netherlands Revenue Share (%), by Services Provided 2025 & 2033
- Figure 30: Middle East & Africa Electronic Brokerage Market in Netherlands Revenue (billion), by Operation 2025 & 2033
- Figure 31: Middle East & Africa Electronic Brokerage Market in Netherlands Revenue Share (%), by Operation 2025 & 2033
- Figure 32: Middle East & Africa Electronic Brokerage Market in Netherlands Revenue (billion), by Country 2025 & 2033
- Figure 33: Middle East & Africa Electronic Brokerage Market in Netherlands Revenue Share (%), by Country 2025 & 2033
- Figure 34: Asia Pacific Electronic Brokerage Market in Netherlands Revenue (billion), by Investor Type 2025 & 2033
- Figure 35: Asia Pacific Electronic Brokerage Market in Netherlands Revenue Share (%), by Investor Type 2025 & 2033
- Figure 36: Asia Pacific Electronic Brokerage Market in Netherlands Revenue (billion), by Services Provided 2025 & 2033
- Figure 37: Asia Pacific Electronic Brokerage Market in Netherlands Revenue Share (%), by Services Provided 2025 & 2033
- Figure 38: Asia Pacific Electronic Brokerage Market in Netherlands Revenue (billion), by Operation 2025 & 2033
- Figure 39: Asia Pacific Electronic Brokerage Market in Netherlands Revenue Share (%), by Operation 2025 & 2033
- Figure 40: Asia Pacific Electronic Brokerage Market in Netherlands Revenue (billion), by Country 2025 & 2033
- Figure 41: Asia Pacific Electronic Brokerage Market in Netherlands Revenue Share (%), by Country 2025 & 2033
List of Tables
- Table 1: Global Electronic Brokerage Market in Netherlands Revenue billion Forecast, by Investor Type 2020 & 2033
- Table 2: Global Electronic Brokerage Market in Netherlands Revenue billion Forecast, by Services Provided 2020 & 2033
- Table 3: Global Electronic Brokerage Market in Netherlands Revenue billion Forecast, by Operation 2020 & 2033
- Table 4: Global Electronic Brokerage Market in Netherlands Revenue billion Forecast, by Region 2020 & 2033
- Table 5: Global Electronic Brokerage Market in Netherlands Revenue billion Forecast, by Investor Type 2020 & 2033
- Table 6: Global Electronic Brokerage Market in Netherlands Revenue billion Forecast, by Services Provided 2020 & 2033
- Table 7: Global Electronic Brokerage Market in Netherlands Revenue billion Forecast, by Operation 2020 & 2033
- Table 8: Global Electronic Brokerage Market in Netherlands Revenue billion Forecast, by Country 2020 & 2033
- Table 9: United States Electronic Brokerage Market in Netherlands Revenue (billion) Forecast, by Application 2020 & 2033
- Table 10: Canada Electronic Brokerage Market in Netherlands Revenue (billion) Forecast, by Application 2020 & 2033
- Table 11: Mexico Electronic Brokerage Market in Netherlands Revenue (billion) Forecast, by Application 2020 & 2033
- Table 12: Global Electronic Brokerage Market in Netherlands Revenue billion Forecast, by Investor Type 2020 & 2033
- Table 13: Global Electronic Brokerage Market in Netherlands Revenue billion Forecast, by Services Provided 2020 & 2033
- Table 14: Global Electronic Brokerage Market in Netherlands Revenue billion Forecast, by Operation 2020 & 2033
- Table 15: Global Electronic Brokerage Market in Netherlands Revenue billion Forecast, by Country 2020 & 2033
- Table 16: Brazil Electronic Brokerage Market in Netherlands Revenue (billion) Forecast, by Application 2020 & 2033
- Table 17: Argentina Electronic Brokerage Market in Netherlands Revenue (billion) Forecast, by Application 2020 & 2033
- Table 18: Rest of South America Electronic Brokerage Market in Netherlands Revenue (billion) Forecast, by Application 2020 & 2033
- Table 19: Global Electronic Brokerage Market in Netherlands Revenue billion Forecast, by Investor Type 2020 & 2033
- Table 20: Global Electronic Brokerage Market in Netherlands Revenue billion Forecast, by Services Provided 2020 & 2033
- Table 21: Global Electronic Brokerage Market in Netherlands Revenue billion Forecast, by Operation 2020 & 2033
- Table 22: Global Electronic Brokerage Market in Netherlands Revenue billion Forecast, by Country 2020 & 2033
- Table 23: United Kingdom Electronic Brokerage Market in Netherlands Revenue (billion) Forecast, by Application 2020 & 2033
- Table 24: Germany Electronic Brokerage Market in Netherlands Revenue (billion) Forecast, by Application 2020 & 2033
- Table 25: France Electronic Brokerage Market in Netherlands Revenue (billion) Forecast, by Application 2020 & 2033
- Table 26: Italy Electronic Brokerage Market in Netherlands Revenue (billion) Forecast, by Application 2020 & 2033
- Table 27: Spain Electronic Brokerage Market in Netherlands Revenue (billion) Forecast, by Application 2020 & 2033
- Table 28: Russia Electronic Brokerage Market in Netherlands Revenue (billion) Forecast, by Application 2020 & 2033
- Table 29: Benelux Electronic Brokerage Market in Netherlands Revenue (billion) Forecast, by Application 2020 & 2033
- Table 30: Nordics Electronic Brokerage Market in Netherlands Revenue (billion) Forecast, by Application 2020 & 2033
- Table 31: Rest of Europe Electronic Brokerage Market in Netherlands Revenue (billion) Forecast, by Application 2020 & 2033
- Table 32: Global Electronic Brokerage Market in Netherlands Revenue billion Forecast, by Investor Type 2020 & 2033
- Table 33: Global Electronic Brokerage Market in Netherlands Revenue billion Forecast, by Services Provided 2020 & 2033
- Table 34: Global Electronic Brokerage Market in Netherlands Revenue billion Forecast, by Operation 2020 & 2033
- Table 35: Global Electronic Brokerage Market in Netherlands Revenue billion Forecast, by Country 2020 & 2033
- Table 36: Turkey Electronic Brokerage Market in Netherlands Revenue (billion) Forecast, by Application 2020 & 2033
- Table 37: Israel Electronic Brokerage Market in Netherlands Revenue (billion) Forecast, by Application 2020 & 2033
- Table 38: GCC Electronic Brokerage Market in Netherlands Revenue (billion) Forecast, by Application 2020 & 2033
- Table 39: North Africa Electronic Brokerage Market in Netherlands Revenue (billion) Forecast, by Application 2020 & 2033
- Table 40: South Africa Electronic Brokerage Market in Netherlands Revenue (billion) Forecast, by Application 2020 & 2033
- Table 41: Rest of Middle East & Africa Electronic Brokerage Market in Netherlands Revenue (billion) Forecast, by Application 2020 & 2033
- Table 42: Global Electronic Brokerage Market in Netherlands Revenue billion Forecast, by Investor Type 2020 & 2033
- Table 43: Global Electronic Brokerage Market in Netherlands Revenue billion Forecast, by Services Provided 2020 & 2033
- Table 44: Global Electronic Brokerage Market in Netherlands Revenue billion Forecast, by Operation 2020 & 2033
- Table 45: Global Electronic Brokerage Market in Netherlands Revenue billion Forecast, by Country 2020 & 2033
- Table 46: China Electronic Brokerage Market in Netherlands Revenue (billion) Forecast, by Application 2020 & 2033
- Table 47: India Electronic Brokerage Market in Netherlands Revenue (billion) Forecast, by Application 2020 & 2033
- Table 48: Japan Electronic Brokerage Market in Netherlands Revenue (billion) Forecast, by Application 2020 & 2033
- Table 49: South Korea Electronic Brokerage Market in Netherlands Revenue (billion) Forecast, by Application 2020 & 2033
- Table 50: ASEAN Electronic Brokerage Market in Netherlands Revenue (billion) Forecast, by Application 2020 & 2033
- Table 51: Oceania Electronic Brokerage Market in Netherlands Revenue (billion) Forecast, by Application 2020 & 2033
- Table 52: Rest of Asia Pacific Electronic Brokerage Market in Netherlands Revenue (billion) Forecast, by Application 2020 & 2033
Frequently Asked Questions
1. What is the projected Compound Annual Growth Rate (CAGR) of the Electronic Brokerage Market in Netherlands?
The projected CAGR is approximately 7.3%.
2. Which companies are prominent players in the Electronic Brokerage Market in Netherlands?
Key companies in the market include Interactive Brokers, Degiro, XTB S A, Saxo bank, eToro, Euronext Group, LYNX, IC Markets, RoboForex, FP Markets**List Not Exhaustive.
3. What are the main segments of the Electronic Brokerage Market in Netherlands?
The market segments include Investor Type, Services Provided, Operation.
4. Can you provide details about the market size?
The market size is estimated to be USD 1.12 billion as of 2022.
5. What are some drivers contributing to market growth?
N/A
6. What are the notable trends driving market growth?
Growing Investing Household Signifying Rising E-Brokerage in Netherlands.
7. Are there any restraints impacting market growth?
N/A
8. Can you provide examples of recent developments in the market?
In September 2022, the leading European digital invetment platform, Scalable Capital expanded its presence in the Netherlands. Its subsidiaries Scalable Crypto and Scalable Broker are providing cost-effective and convenient trading and saving plans for Dutch retail clients with products like exchange traded funds (ETFs), stocks, cryptocurrencies, and mutual funds.
9. What pricing options are available for accessing the report?
Pricing options include single-user, multi-user, and enterprise licenses priced at USD 3800, USD 4500, and USD 5800 respectively.
10. Is the market size provided in terms of value or volume?
The market size is provided in terms of value, measured in billion.
11. Are there any specific market keywords associated with the report?
Yes, the market keyword associated with the report is "Electronic Brokerage Market in Netherlands," which aids in identifying and referencing the specific market segment covered.
12. How do I determine which pricing option suits my needs best?
The pricing options vary based on user requirements and access needs. Individual users may opt for single-user licenses, while businesses requiring broader access may choose multi-user or enterprise licenses for cost-effective access to the report.
13. Are there any additional resources or data provided in the Electronic Brokerage Market in Netherlands report?
While the report offers comprehensive insights, it's advisable to review the specific contents or supplementary materials provided to ascertain if additional resources or data are available.
14. How can I stay updated on further developments or reports in the Electronic Brokerage Market in Netherlands?
To stay informed about further developments, trends, and reports in the Electronic Brokerage Market in Netherlands, consider subscribing to industry newsletters, following relevant companies and organizations, or regularly checking reputable industry news sources and publications.
Methodology
Step 1 - Identification of Relevant Samples Size from Population Database


Step 2 - Approaches for Defining Global Market Size (Value, Volume* & Price*)

Note*: In applicable scenarios
Step 3 - Data Sources
Primary Research
- Web Analytics
- Survey Reports
- Research Institute
- Latest Research Reports
- Opinion Leaders
Secondary Research
- Annual Reports
- White Paper
- Latest Press Release
- Industry Association
- Paid Database
- Investor Presentations

Step 4 - Data Triangulation
Involves using different sources of information in order to increase the validity of a study
These sources are likely to be stakeholders in a program - participants, other researchers, program staff, other community members, and so on.
Then we put all data in single framework & apply various statistical tools to find out the dynamic on the market.
During the analysis stage, feedback from the stakeholder groups would be compared to determine areas of agreement as well as areas of divergence