

Key Insights
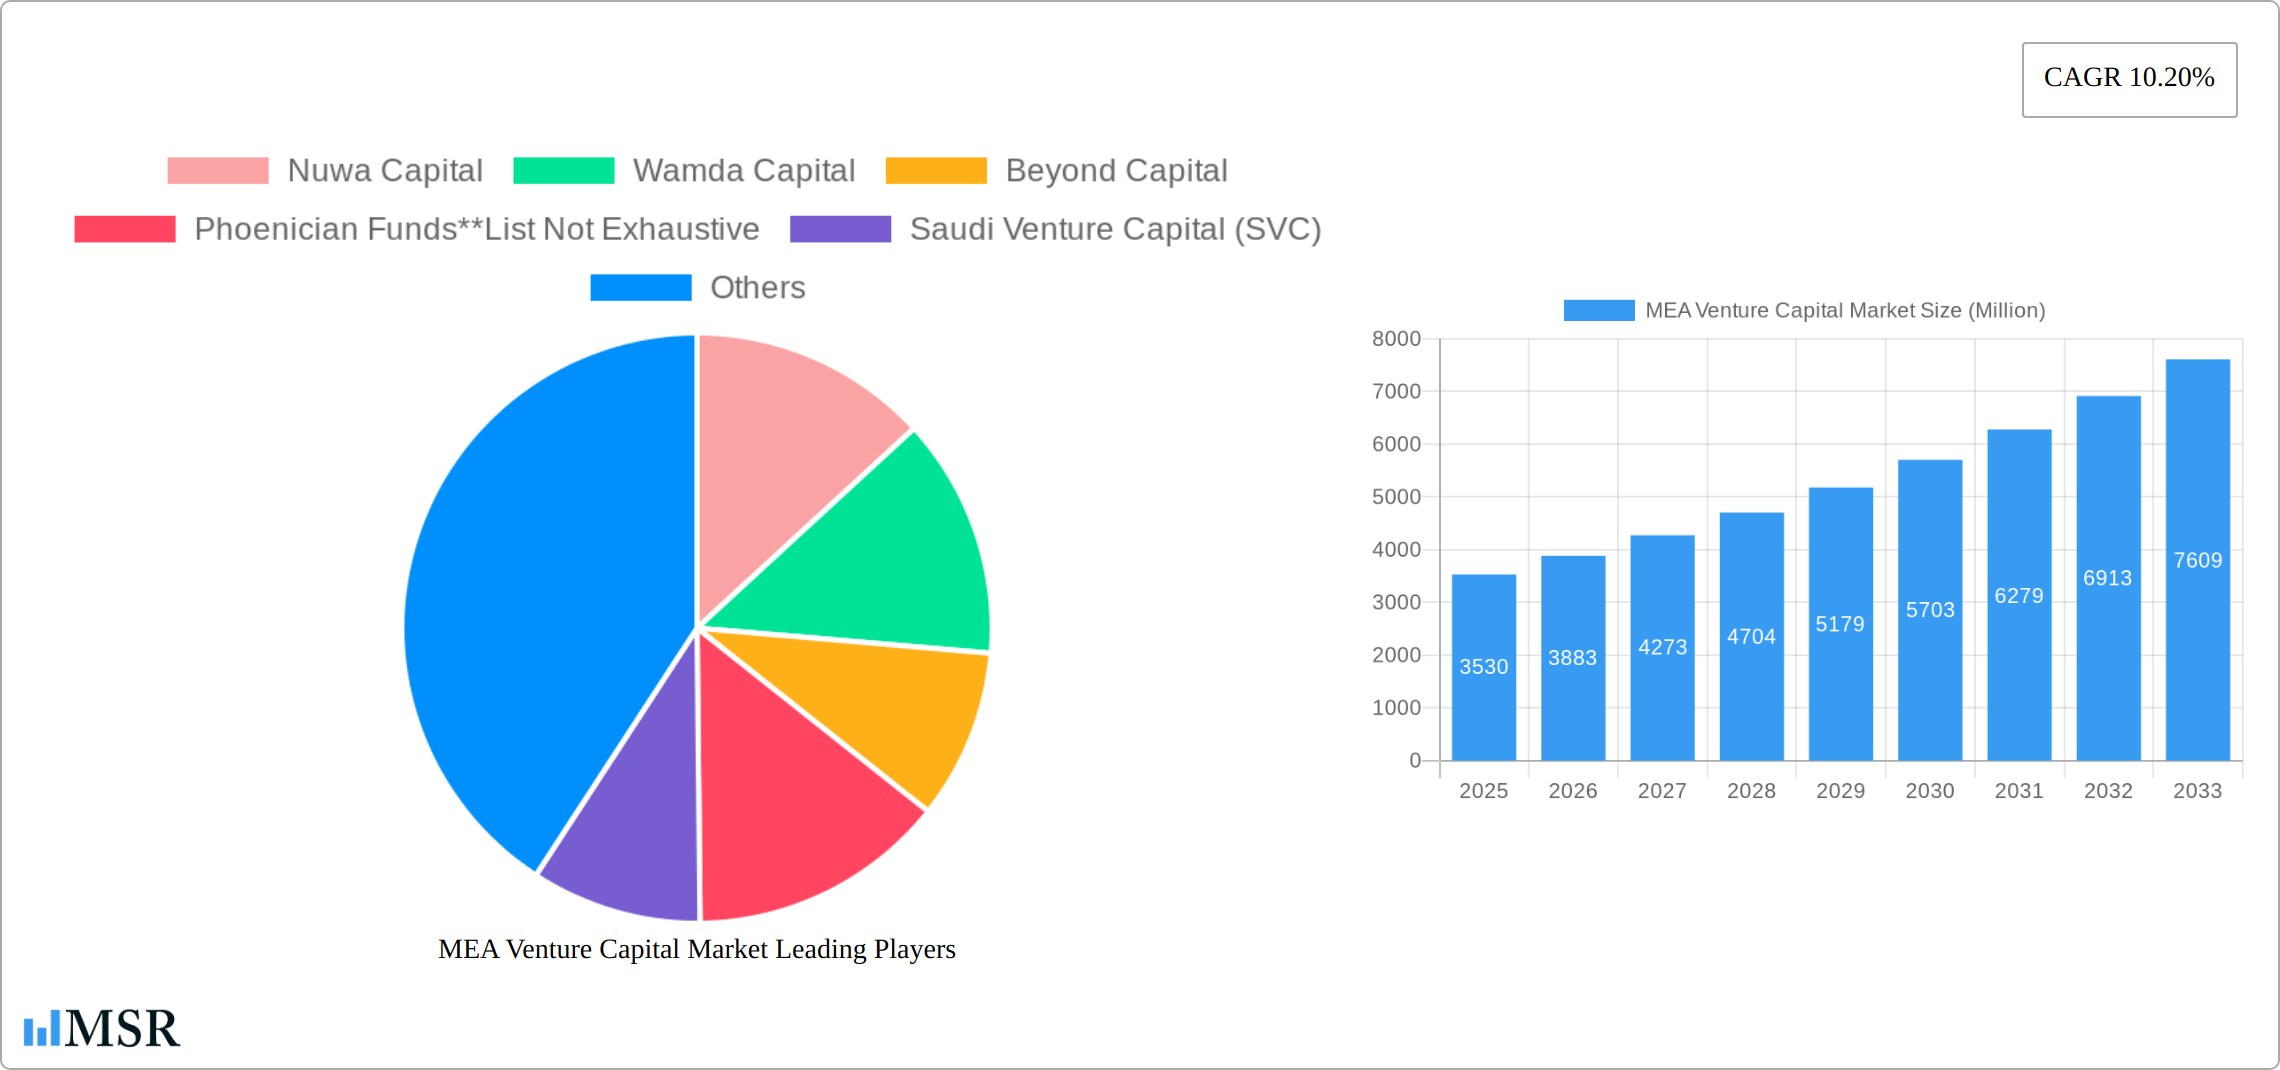
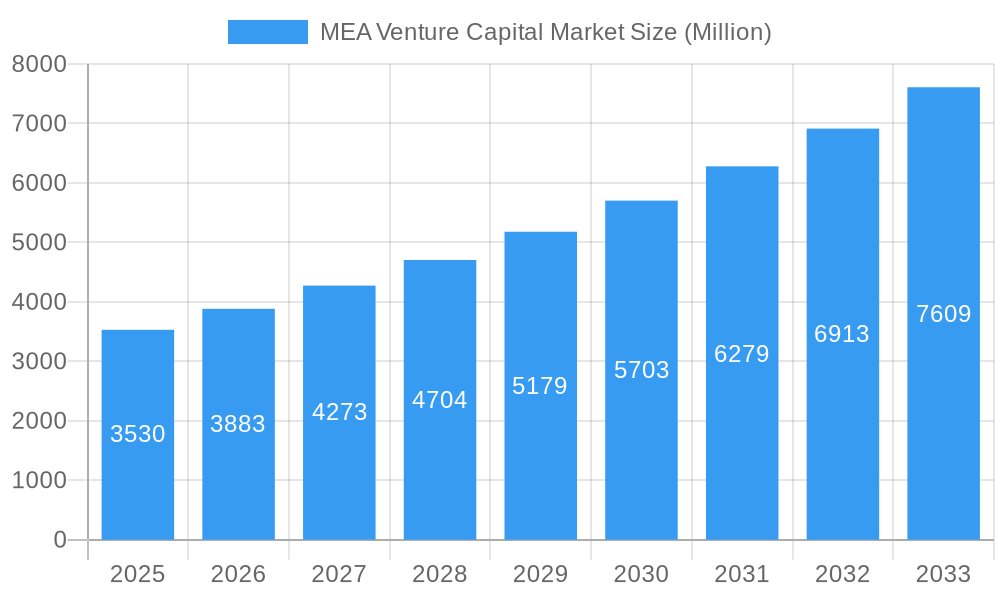
The Middle East and Africa (MEA) venture capital market is experiencing robust growth, projected to reach \$3.53 billion in 2025 and maintain a Compound Annual Growth Rate (CAGR) of 10.20% from 2025 to 2033. This expansion is fueled by several key factors. Firstly, a burgeoning entrepreneurial ecosystem within the region is attracting significant investment. Governments across the MEA are actively promoting innovation and entrepreneurship through supportive policies and initiatives, creating a fertile ground for venture capital activity. Secondly, the increasing digitalization across various sectors, including FinTech, e-commerce, and healthcare, presents lucrative opportunities for investors. The region's relatively young and digitally savvy population further accelerates this trend. Furthermore, the presence of established and emerging venture capital firms such as Nuwa Capital, Wamda Capital, and Algebra Ventures, alongside global players, signifies a growing confidence in the MEA market's potential. The diverse investment landscape, encompassing sectors like real estate, financial services, and technology, contributes to the market's dynamism and resilience.
MEA Venture Capital Market Market Size (In Billion)
However, the MEA venture capital market also faces challenges. While significant progress has been made, regulatory hurdles and a relative lack of deep-tech startups compared to other regions require attention. Access to funding beyond seed and Series A rounds remains a constraint for some companies, highlighting the need for a more mature investment ecosystem supporting growth at later stages. Despite these challenges, the overall outlook remains positive, driven by substantial economic growth in several key MEA countries and a growing pool of talented entrepreneurs. The strong CAGR projection indicates a continued influx of capital into the region, particularly as international investors increasingly recognize the MEA's untapped potential and strategic geographical location. The market segmentation by investor type (local vs. international) and industry reveals promising niches for targeted investments and future growth.
MEA Venture Capital Market Company Market Share
MEA Venture Capital Market Report: 2019-2033
This comprehensive report provides an in-depth analysis of the Middle East and Africa (MEA) Venture Capital market, covering the historical period (2019-2024), base year (2025), and forecast period (2025-2033). It offers actionable insights for investors, entrepreneurs, and industry stakeholders seeking to navigate this dynamic market. The report examines market size, growth drivers, key players, investment trends, and emerging opportunities within the MEA region, incorporating data on prominent firms like Nuwa Capital, Wamda Capital, Beyond Capital, and Phoenician Funds, among many others. With a focus on both local and international investors, and across diverse industry segments, this report is an essential resource for understanding and capitalizing on the MEA venture capital landscape. The report's detailed analysis includes crucial metrics and projections, enabling informed decision-making in this rapidly evolving sector. The market is expected to reach xx Million by 2033, presenting substantial growth opportunities.
MEA Venture Capital Market Market Concentration & Dynamics
The MEA venture capital market exhibits a moderately concentrated landscape, with a few dominant players alongside a growing number of emerging firms. Market share is significantly influenced by the availability of funding, government initiatives, and the overall economic climate in specific countries. Innovation ecosystems vary considerably across the region, with some countries showing greater maturity and concentration of startups and venture capital activity than others. Regulatory frameworks also play a crucial role, impacting ease of investment and overall market accessibility. Substitute products, such as angel investors and private equity, exist but often lack the scalability and resources offered by established venture capital firms. End-user trends are heavily influenced by technological advancements and the emergence of new industries.
Key Aspects:
- Market Share: Dominant players hold approximately xx% of the market share, while the remaining xx% is distributed among smaller firms and emerging players.
- M&A Activity: The number of M&A deals in the MEA venture capital market averaged xx deals annually during the historical period, indicating a growing level of consolidation.
- Innovation Ecosystems: Clusters of startups and venture capital firms are concentrated in certain regions, notably [mention specific regions/countries].
- Regulatory Framework: Significant regulatory variations exist across the MEA region, with some countries offering more favorable environments for venture capital investment than others.
MEA Venture Capital Market Industry Insights & Trends
The MEA venture capital market is experiencing a dynamic and accelerated growth trajectory, fueled by a confluence of favorable factors. Governments across the region are actively championing innovation through supportive policies and funding initiatives, fostering a vibrant entrepreneurial ecosystem. This, coupled with the widespread adoption of cutting-edge technologies, is fundamentally reshaping the investment landscape. The market, currently estimated at approximately $XX Million in 2025, is projected to surge to an impressive $XX Million by 2033, demonstrating a robust Compound Annual Growth Rate (CAGR) of XX%. Key technological disruptions, particularly within the Fintech, e-commerce, and healthcare sectors, are attracting significant capital inflows. Furthermore, evolving consumer behaviors, characterized by escalating digital adoption and a consistent demand for novel products and services, are acting as powerful catalysts for sustained market expansion. While challenges persist, including infrastructure limitations in specific sub-regions and a relative scarcity of seasoned venture capitalists, the overall outlook remains exceptionally positive.
Key Markets & Segments Leading MEA Venture Capital Market
The IT and ITeS sector currently dominates the MEA venture capital market, driven by rapid technological adoption and a growing demand for digital solutions. Other significant segments include Financial Services, Healthcare, and Food & Beverage, all experiencing robust growth and attracting substantial investment. Among investor types, International Investors are currently more active compared to Local Investors due to their significant capital and expertise. However, the participation of Local Investors is rapidly increasing. Geographic dominance varies by sector, with certain countries demonstrating leadership in specific industries.
Key Market Drivers:
- IT and ITeS: High growth potential in software, digital solutions and tech startups.
- Financial Services: Growing Fintech innovation and increased financial inclusion.
- Healthcare: Expansion of telemedicine, digital health solutions, and medical technology.
- Economic Growth: Overall economic growth in certain MEA regions fuels venture capital activity.
- Government Support: Increasing government initiatives supporting startups and entrepreneurship.
MEA Venture Capital Market Product Developments
Recent advancements in the MEA venture capital market have been marked by a strategic emphasis on developing highly tailored investment solutions that cater to the unique needs of specific industry verticals and emerging technological frontiers. This includes the introduction of specialized funds designed to target high-growth sectors and promising geographies within the MEA region. Moreover, there's a discernible trend towards the enhanced integration of technology across the entire investment lifecycle. This encompasses sophisticated tools for deal sourcing, rigorous due diligence processes, and advanced portfolio management systems, all contributing to increased operational efficiency, a sharper competitive edge, and ultimately, the accelerated maturation of the venture capital ecosystem.
Challenges in the MEA Venture Capital Market Market
Navigating the MEA venture capital market presents several inherent challenges that demand strategic foresight and adaptability. These include the complex and often disparate regulatory environments that vary significantly across different countries, the potential for unforeseen supply chain disruptions impacting portfolio companies, and the ever-present intensity of competition from both established local and agile international players. These factors can significantly influence the pace and efficacy of investment deployment, necessitating meticulous risk management strategies and robust contingency planning. Additionally, a notable constraint remains the availability of sufficient skilled human capital capable of supporting the rapid growth of innovative enterprises.
Forces Driving MEA Venture Capital Market Growth
The MEA venture capital market is propelled by several key growth drivers. Firstly, technological advancements across various sectors create numerous investment opportunities. Secondly, robust economic growth in several MEA countries provides a fertile ground for startup development. Thirdly, supportive government policies and initiatives aimed at fostering entrepreneurship further stimulate market expansion. The influx of international investment further fuels growth.
Long-Term Growth Catalysts in MEA Venture Capital Market
Long-term growth in the MEA venture capital market hinges on continued technological innovation, fostering strategic partnerships among investors, startups, and government entities, and successful expansion into new, promising markets. These synergistic efforts are crucial for maintaining the momentum of this rapidly evolving sector and unlocking its vast potential.
Emerging Opportunities in MEA Venture Capital Market
The MEA venture capital market is ripe with emerging opportunities, particularly in leveraging the transformative potential of technologies like Artificial Intelligence (AI), blockchain, and the metaverse to identify and nurture groundbreaking startups. Significant untapped potential also lies in expanding investment focus into underserved markets across the diverse MEA region. Furthermore, the increasing prominence and success of female-led startups present a compelling area for strategic investment and impact.
Leading Players in the MEA Venture Capital Market Sector
- Nuwa Capital
- Wamda Capital
- Beyond Capital
- Phoenician Funds
- Saudi Venture Capital (SVC)
- Falt6Labs Bahrain
- Global ventures
- Vision Ventures
- Algebra Ventures
- 500 Startups
Key Milestones in MEA Venture Capital Market Industry
- February 2023: Saudi Venture Capital Investment Company launches a USD 1 Million income growth fund (SVC Sukuk Fund). This demonstrates increased focus on income-generating investments within the Saudi Arabian VC market.
- February 2023: Flat6Labs completes the first close of its USD 20 Million 'Startup Seed Fund' in Saudi Arabia, with participation from the Saudi Venture Capital Company (SVC) and the 'Jada' Fund of Funds (PIF). This signifies increased collaboration between public and private sector investors in fostering the Saudi startup ecosystem.
Strategic Outlook for MEA Venture Capital Market Market
The future trajectory of the MEA venture capital market is exceptionally bright, poised for substantial expansion driven by continuous technological innovation, proactive and supportive government policies, and a growing influx of capital from both domestic and international investors. Strategic opportunities abound for discerning investors who can adeptly identify and capitalize on nascent trends, cultivate strategic alliances, and skillfully navigate the distinctive intricacies of this dynamic market. The sector is exceptionally well-positioned for significant growth in the coming years, offering the potential for substantial returns for well-prepared and strategically aligned participants.
MEA Venture Capital Market Segmentation
-
1. Type
- 1.1. Local Investors
- 1.2. International Investors
-
2. Industry
- 2.1. Real Estate
- 2.2. Financial Services
- 2.3. Food & Beverage
- 2.4. Healthcare
- 2.5. Transport and Logistics
- 2.6. IT and ITeS
- 2.7. Education
- 2.8. Other Industries (Energy, etc.)
MEA Venture Capital Market Segmentation By Geography
-
1. North America
- 1.1. United States
- 1.2. Canada
- 1.3. Mexico
-
2. South America
- 2.1. Brazil
- 2.2. Argentina
- 2.3. Rest of South America
-
3. Europe
- 3.1. United Kingdom
- 3.2. Germany
- 3.3. France
- 3.4. Italy
- 3.5. Spain
- 3.6. Russia
- 3.7. Benelux
- 3.8. Nordics
- 3.9. Rest of Europe
-
4. Middle East & Africa
- 4.1. Turkey
- 4.2. Israel
- 4.3. GCC
- 4.4. North Africa
- 4.5. South Africa
- 4.6. Rest of Middle East & Africa
-
5. Asia Pacific
- 5.1. China
- 5.2. India
- 5.3. Japan
- 5.4. South Korea
- 5.5. ASEAN
- 5.6. Oceania
- 5.7. Rest of Asia Pacific
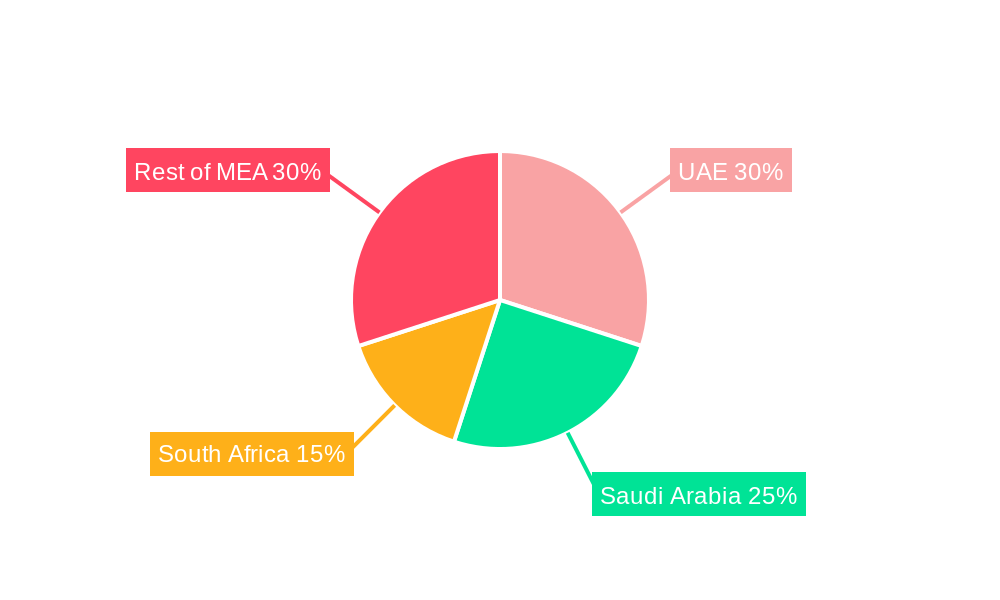
MEA Venture Capital Market Regional Market Share
Geographic Coverage of MEA Venture Capital Market
MEA Venture Capital Market REPORT HIGHLIGHTS
| Aspects | Details |
|---|---|
| Study Period | 2020-2034 |
| Base Year | 2025 |
| Estimated Year | 2026 |
| Forecast Period | 2026-2034 |
| Historical Period | 2020-2025 |
| Growth Rate | CAGR of 10.20% from 2020-2034 |
| Segmentation |
|
Table of Contents
- 1. Introduction
- 1.1. Research Scope
- 1.2. Market Segmentation
- 1.3. Research Objective
- 1.4. Definitions and Assumptions
- 2. Executive Summary
- 2.1. Market Snapshot
- 3. Market Dynamics
- 3.1. Market Drivers
- 3.2. Market Restrains
- 3.3. Market Trends
- 3.4. Market Opportunities
- 4. Market Factor Analysis
- 4.1. Porters Five Forces
- 4.1.1. Bargaining Power of Suppliers
- 4.1.2. Bargaining Power of Buyers
- 4.1.3. Threat of New Entrants
- 4.1.4. Threat of Substitutes
- 4.1.5. Competitive Rivalry
- 4.2. PESTEL analysis
- 4.3. BCG Analysis
- 4.3.1. Stars (High Growth, High Market Share)
- 4.3.2. Cash Cows (Low Growth, High Market Share)
- 4.3.3. Question Mark (High Growth, Low Market Share)
- 4.3.4. Dogs (Low Growth, Low Market Share)
- 4.4. Ansoff Matrix Analysis
- 4.5. Supply Chain Analysis
- 4.6. Regulatory Landscape
- 4.7. Current Market Potential and Opportunity Assessment (TAM–SAM–SOM Framework)
- 4.8. MSR Analyst Note
- 4.1. Porters Five Forces
- 5. Market Analysis, Insights and Forecast 2021-2033
- 5.1. Market Analysis, Insights and Forecast - by Type
- 5.1.1. Local Investors
- 5.1.2. International Investors
- 5.2. Market Analysis, Insights and Forecast - by Industry
- 5.2.1. Real Estate
- 5.2.2. Financial Services
- 5.2.3. Food & Beverage
- 5.2.4. Healthcare
- 5.2.5. Transport and Logistics
- 5.2.6. IT and ITeS
- 5.2.7. Education
- 5.2.8. Other Industries (Energy, etc.)
- 5.3. Market Analysis, Insights and Forecast - by Region
- 5.3.1. North America
- 5.3.2. South America
- 5.3.3. Europe
- 5.3.4. Middle East & Africa
- 5.3.5. Asia Pacific
- 5.1. Market Analysis, Insights and Forecast - by Type
- 6. Global MEA Venture Capital Market Analysis, Insights and Forecast, 2021-2033
- 6.1. Market Analysis, Insights and Forecast - by Type
- 6.1.1. Local Investors
- 6.1.2. International Investors
- 6.2. Market Analysis, Insights and Forecast - by Industry
- 6.2.1. Real Estate
- 6.2.2. Financial Services
- 6.2.3. Food & Beverage
- 6.2.4. Healthcare
- 6.2.5. Transport and Logistics
- 6.2.6. IT and ITeS
- 6.2.7. Education
- 6.2.8. Other Industries (Energy, etc.)
- 6.1. Market Analysis, Insights and Forecast - by Type
- 7. North America MEA Venture Capital Market Analysis, Insights and Forecast, 2020-2032
- 7.1. Market Analysis, Insights and Forecast - by Type
- 7.1.1. Local Investors
- 7.1.2. International Investors
- 7.2. Market Analysis, Insights and Forecast - by Industry
- 7.2.1. Real Estate
- 7.2.2. Financial Services
- 7.2.3. Food & Beverage
- 7.2.4. Healthcare
- 7.2.5. Transport and Logistics
- 7.2.6. IT and ITeS
- 7.2.7. Education
- 7.2.8. Other Industries (Energy, etc.)
- 7.1. Market Analysis, Insights and Forecast - by Type
- 8. South America MEA Venture Capital Market Analysis, Insights and Forecast, 2020-2032
- 8.1. Market Analysis, Insights and Forecast - by Type
- 8.1.1. Local Investors
- 8.1.2. International Investors
- 8.2. Market Analysis, Insights and Forecast - by Industry
- 8.2.1. Real Estate
- 8.2.2. Financial Services
- 8.2.3. Food & Beverage
- 8.2.4. Healthcare
- 8.2.5. Transport and Logistics
- 8.2.6. IT and ITeS
- 8.2.7. Education
- 8.2.8. Other Industries (Energy, etc.)
- 8.1. Market Analysis, Insights and Forecast - by Type
- 9. Europe MEA Venture Capital Market Analysis, Insights and Forecast, 2020-2032
- 9.1. Market Analysis, Insights and Forecast - by Type
- 9.1.1. Local Investors
- 9.1.2. International Investors
- 9.2. Market Analysis, Insights and Forecast - by Industry
- 9.2.1. Real Estate
- 9.2.2. Financial Services
- 9.2.3. Food & Beverage
- 9.2.4. Healthcare
- 9.2.5. Transport and Logistics
- 9.2.6. IT and ITeS
- 9.2.7. Education
- 9.2.8. Other Industries (Energy, etc.)
- 9.1. Market Analysis, Insights and Forecast - by Type
- 10. Middle East & Africa MEA Venture Capital Market Analysis, Insights and Forecast, 2020-2032
- 10.1. Market Analysis, Insights and Forecast - by Type
- 10.1.1. Local Investors
- 10.1.2. International Investors
- 10.2. Market Analysis, Insights and Forecast - by Industry
- 10.2.1. Real Estate
- 10.2.2. Financial Services
- 10.2.3. Food & Beverage
- 10.2.4. Healthcare
- 10.2.5. Transport and Logistics
- 10.2.6. IT and ITeS
- 10.2.7. Education
- 10.2.8. Other Industries (Energy, etc.)
- 10.1. Market Analysis, Insights and Forecast - by Type
- 11. Asia Pacific MEA Venture Capital Market Analysis, Insights and Forecast, 2020-2032
- 11.1. Market Analysis, Insights and Forecast - by Type
- 11.1.1. Local Investors
- 11.1.2. International Investors
- 11.2. Market Analysis, Insights and Forecast - by Industry
- 11.2.1. Real Estate
- 11.2.2. Financial Services
- 11.2.3. Food & Beverage
- 11.2.4. Healthcare
- 11.2.5. Transport and Logistics
- 11.2.6. IT and ITeS
- 11.2.7. Education
- 11.2.8. Other Industries (Energy, etc.)
- 11.1. Market Analysis, Insights and Forecast - by Type
- 12. Competitive Analysis
- 12.1. Company Profiles
- 12.1.1 Nuwa Capital
- 12.1.1.1. Company Overview
- 12.1.1.2. Products
- 12.1.1.3. Company Financials
- 12.1.1.4. SWOT Analysis
- 12.1.2 Wamda Capital
- 12.1.2.1. Company Overview
- 12.1.2.2. Products
- 12.1.2.3. Company Financials
- 12.1.2.4. SWOT Analysis
- 12.1.3 Beyond Capital
- 12.1.3.1. Company Overview
- 12.1.3.2. Products
- 12.1.3.3. Company Financials
- 12.1.3.4. SWOT Analysis
- 12.1.4 Phoenician Funds**List Not Exhaustive
- 12.1.4.1. Company Overview
- 12.1.4.2. Products
- 12.1.4.3. Company Financials
- 12.1.4.4. SWOT Analysis
- 12.1.5 Saudi Venture Capital (SVC)
- 12.1.5.1. Company Overview
- 12.1.5.2. Products
- 12.1.5.3. Company Financials
- 12.1.5.4. SWOT Analysis
- 12.1.6 Falt6Labs Bahrain
- 12.1.6.1. Company Overview
- 12.1.6.2. Products
- 12.1.6.3. Company Financials
- 12.1.6.4. SWOT Analysis
- 12.1.7 Global ventures
- 12.1.7.1. Company Overview
- 12.1.7.2. Products
- 12.1.7.3. Company Financials
- 12.1.7.4. SWOT Analysis
- 12.1.8 Vision Ventures
- 12.1.8.1. Company Overview
- 12.1.8.2. Products
- 12.1.8.3. Company Financials
- 12.1.8.4. SWOT Analysis
- 12.1.9 Algebra Ventures
- 12.1.9.1. Company Overview
- 12.1.9.2. Products
- 12.1.9.3. Company Financials
- 12.1.9.4. SWOT Analysis
- 12.1.10 500 Startups
- 12.1.10.1. Company Overview
- 12.1.10.2. Products
- 12.1.10.3. Company Financials
- 12.1.10.4. SWOT Analysis
- 12.1.1 Nuwa Capital
- 12.2. Market Entropy
- 12.2.1 Company's Key Areas Served
- 12.2.2 Recent Developments
- 12.3. Company Market Share Analysis 2025
- 12.3.1 Top 5 Companies Market Share Analysis
- 12.3.2 Top 3 Companies Market Share Analysis
- 12.4. List of Potential Customers
- 13. Research Methodology
List of Figures
- Figure 1: Global MEA Venture Capital Market Revenue Breakdown (Million, %) by Region 2025 & 2033
- Figure 2: North America MEA Venture Capital Market Revenue (Million), by Type 2025 & 2033
- Figure 3: North America MEA Venture Capital Market Revenue Share (%), by Type 2025 & 2033
- Figure 4: North America MEA Venture Capital Market Revenue (Million), by Industry 2025 & 2033
- Figure 5: North America MEA Venture Capital Market Revenue Share (%), by Industry 2025 & 2033
- Figure 6: North America MEA Venture Capital Market Revenue (Million), by Country 2025 & 2033
- Figure 7: North America MEA Venture Capital Market Revenue Share (%), by Country 2025 & 2033
- Figure 8: South America MEA Venture Capital Market Revenue (Million), by Type 2025 & 2033
- Figure 9: South America MEA Venture Capital Market Revenue Share (%), by Type 2025 & 2033
- Figure 10: South America MEA Venture Capital Market Revenue (Million), by Industry 2025 & 2033
- Figure 11: South America MEA Venture Capital Market Revenue Share (%), by Industry 2025 & 2033
- Figure 12: South America MEA Venture Capital Market Revenue (Million), by Country 2025 & 2033
- Figure 13: South America MEA Venture Capital Market Revenue Share (%), by Country 2025 & 2033
- Figure 14: Europe MEA Venture Capital Market Revenue (Million), by Type 2025 & 2033
- Figure 15: Europe MEA Venture Capital Market Revenue Share (%), by Type 2025 & 2033
- Figure 16: Europe MEA Venture Capital Market Revenue (Million), by Industry 2025 & 2033
- Figure 17: Europe MEA Venture Capital Market Revenue Share (%), by Industry 2025 & 2033
- Figure 18: Europe MEA Venture Capital Market Revenue (Million), by Country 2025 & 2033
- Figure 19: Europe MEA Venture Capital Market Revenue Share (%), by Country 2025 & 2033
- Figure 20: Middle East & Africa MEA Venture Capital Market Revenue (Million), by Type 2025 & 2033
- Figure 21: Middle East & Africa MEA Venture Capital Market Revenue Share (%), by Type 2025 & 2033
- Figure 22: Middle East & Africa MEA Venture Capital Market Revenue (Million), by Industry 2025 & 2033
- Figure 23: Middle East & Africa MEA Venture Capital Market Revenue Share (%), by Industry 2025 & 2033
- Figure 24: Middle East & Africa MEA Venture Capital Market Revenue (Million), by Country 2025 & 2033
- Figure 25: Middle East & Africa MEA Venture Capital Market Revenue Share (%), by Country 2025 & 2033
- Figure 26: Asia Pacific MEA Venture Capital Market Revenue (Million), by Type 2025 & 2033
- Figure 27: Asia Pacific MEA Venture Capital Market Revenue Share (%), by Type 2025 & 2033
- Figure 28: Asia Pacific MEA Venture Capital Market Revenue (Million), by Industry 2025 & 2033
- Figure 29: Asia Pacific MEA Venture Capital Market Revenue Share (%), by Industry 2025 & 2033
- Figure 30: Asia Pacific MEA Venture Capital Market Revenue (Million), by Country 2025 & 2033
- Figure 31: Asia Pacific MEA Venture Capital Market Revenue Share (%), by Country 2025 & 2033
List of Tables
- Table 1: Global MEA Venture Capital Market Revenue Million Forecast, by Type 2020 & 2033
- Table 2: Global MEA Venture Capital Market Revenue Million Forecast, by Industry 2020 & 2033
- Table 3: Global MEA Venture Capital Market Revenue Million Forecast, by Region 2020 & 2033
- Table 4: Global MEA Venture Capital Market Revenue Million Forecast, by Type 2020 & 2033
- Table 5: Global MEA Venture Capital Market Revenue Million Forecast, by Industry 2020 & 2033
- Table 6: Global MEA Venture Capital Market Revenue Million Forecast, by Country 2020 & 2033
- Table 7: United States MEA Venture Capital Market Revenue (Million) Forecast, by Application 2020 & 2033
- Table 8: Canada MEA Venture Capital Market Revenue (Million) Forecast, by Application 2020 & 2033
- Table 9: Mexico MEA Venture Capital Market Revenue (Million) Forecast, by Application 2020 & 2033
- Table 10: Global MEA Venture Capital Market Revenue Million Forecast, by Type 2020 & 2033
- Table 11: Global MEA Venture Capital Market Revenue Million Forecast, by Industry 2020 & 2033
- Table 12: Global MEA Venture Capital Market Revenue Million Forecast, by Country 2020 & 2033
- Table 13: Brazil MEA Venture Capital Market Revenue (Million) Forecast, by Application 2020 & 2033
- Table 14: Argentina MEA Venture Capital Market Revenue (Million) Forecast, by Application 2020 & 2033
- Table 15: Rest of South America MEA Venture Capital Market Revenue (Million) Forecast, by Application 2020 & 2033
- Table 16: Global MEA Venture Capital Market Revenue Million Forecast, by Type 2020 & 2033
- Table 17: Global MEA Venture Capital Market Revenue Million Forecast, by Industry 2020 & 2033
- Table 18: Global MEA Venture Capital Market Revenue Million Forecast, by Country 2020 & 2033
- Table 19: United Kingdom MEA Venture Capital Market Revenue (Million) Forecast, by Application 2020 & 2033
- Table 20: Germany MEA Venture Capital Market Revenue (Million) Forecast, by Application 2020 & 2033
- Table 21: France MEA Venture Capital Market Revenue (Million) Forecast, by Application 2020 & 2033
- Table 22: Italy MEA Venture Capital Market Revenue (Million) Forecast, by Application 2020 & 2033
- Table 23: Spain MEA Venture Capital Market Revenue (Million) Forecast, by Application 2020 & 2033
- Table 24: Russia MEA Venture Capital Market Revenue (Million) Forecast, by Application 2020 & 2033
- Table 25: Benelux MEA Venture Capital Market Revenue (Million) Forecast, by Application 2020 & 2033
- Table 26: Nordics MEA Venture Capital Market Revenue (Million) Forecast, by Application 2020 & 2033
- Table 27: Rest of Europe MEA Venture Capital Market Revenue (Million) Forecast, by Application 2020 & 2033
- Table 28: Global MEA Venture Capital Market Revenue Million Forecast, by Type 2020 & 2033
- Table 29: Global MEA Venture Capital Market Revenue Million Forecast, by Industry 2020 & 2033
- Table 30: Global MEA Venture Capital Market Revenue Million Forecast, by Country 2020 & 2033
- Table 31: Turkey MEA Venture Capital Market Revenue (Million) Forecast, by Application 2020 & 2033
- Table 32: Israel MEA Venture Capital Market Revenue (Million) Forecast, by Application 2020 & 2033
- Table 33: GCC MEA Venture Capital Market Revenue (Million) Forecast, by Application 2020 & 2033
- Table 34: North Africa MEA Venture Capital Market Revenue (Million) Forecast, by Application 2020 & 2033
- Table 35: South Africa MEA Venture Capital Market Revenue (Million) Forecast, by Application 2020 & 2033
- Table 36: Rest of Middle East & Africa MEA Venture Capital Market Revenue (Million) Forecast, by Application 2020 & 2033
- Table 37: Global MEA Venture Capital Market Revenue Million Forecast, by Type 2020 & 2033
- Table 38: Global MEA Venture Capital Market Revenue Million Forecast, by Industry 2020 & 2033
- Table 39: Global MEA Venture Capital Market Revenue Million Forecast, by Country 2020 & 2033
- Table 40: China MEA Venture Capital Market Revenue (Million) Forecast, by Application 2020 & 2033
- Table 41: India MEA Venture Capital Market Revenue (Million) Forecast, by Application 2020 & 2033
- Table 42: Japan MEA Venture Capital Market Revenue (Million) Forecast, by Application 2020 & 2033
- Table 43: South Korea MEA Venture Capital Market Revenue (Million) Forecast, by Application 2020 & 2033
- Table 44: ASEAN MEA Venture Capital Market Revenue (Million) Forecast, by Application 2020 & 2033
- Table 45: Oceania MEA Venture Capital Market Revenue (Million) Forecast, by Application 2020 & 2033
- Table 46: Rest of Asia Pacific MEA Venture Capital Market Revenue (Million) Forecast, by Application 2020 & 2033
Frequently Asked Questions
1. What is the projected Compound Annual Growth Rate (CAGR) of the MEA Venture Capital Market?
The projected CAGR is approximately 10.20%.
2. Which companies are prominent players in the MEA Venture Capital Market?
Key companies in the market include Nuwa Capital, Wamda Capital, Beyond Capital, Phoenician Funds**List Not Exhaustive, Saudi Venture Capital (SVC), Falt6Labs Bahrain, Global ventures, Vision Ventures, Algebra Ventures, 500 Startups.
3. What are the main segments of the MEA Venture Capital Market?
The market segments include Type, Industry.
4. Can you provide details about the market size?
The market size is estimated to be USD 3.53 Million as of 2022.
5. What are some drivers contributing to market growth?
Leading Share of Passenger Vehicles in Car Sales; Quick Processing of Loan through Digital Banking.
6. What are the notable trends driving market growth?
The United Arab Emirates Attracts Higher Investments in the region.
7. Are there any restraints impacting market growth?
Rising Interest Rates Affecting New Auto Buyers Demand for Loan.
8. Can you provide examples of recent developments in the market?
February 2023: Saudi Venture Capital Investment Company launches a USD 1 million income growth fund. The Company launched a close-ended income and capital growth fund - SVC Sukuk Fund.
9. What pricing options are available for accessing the report?
Pricing options include single-user, multi-user, and enterprise licenses priced at USD 4750, USD 4950, and USD 6800 respectively.
10. Is the market size provided in terms of value or volume?
The market size is provided in terms of value, measured in Million.
11. Are there any specific market keywords associated with the report?
Yes, the market keyword associated with the report is "MEA Venture Capital Market," which aids in identifying and referencing the specific market segment covered.
12. How do I determine which pricing option suits my needs best?
The pricing options vary based on user requirements and access needs. Individual users may opt for single-user licenses, while businesses requiring broader access may choose multi-user or enterprise licenses for cost-effective access to the report.
13. Are there any additional resources or data provided in the MEA Venture Capital Market report?
While the report offers comprehensive insights, it's advisable to review the specific contents or supplementary materials provided to ascertain if additional resources or data are available.
14. How can I stay updated on further developments or reports in the MEA Venture Capital Market?
To stay informed about further developments, trends, and reports in the MEA Venture Capital Market, consider subscribing to industry newsletters, following relevant companies and organizations, or regularly checking reputable industry news sources and publications.
Methodology
Step 1 - Identification of Relevant Samples Size from Population Database


Step 2 - Approaches for Defining Global Market Size (Value, Volume* & Price*)

Note*: In applicable scenarios
Step 3 - Data Sources
Primary Research
- Web Analytics
- Survey Reports
- Research Institute
- Latest Research Reports
- Opinion Leaders
Secondary Research
- Annual Reports
- White Paper
- Latest Press Release
- Industry Association
- Paid Database
- Investor Presentations

Step 4 - Data Triangulation
Involves using different sources of information in order to increase the validity of a study
These sources are likely to be stakeholders in a program - participants, other researchers, program staff, other community members, and so on.
Then we put all data in single framework & apply various statistical tools to find out the dynamic on the market.
During the analysis stage, feedback from the stakeholder groups would be compared to determine areas of agreement as well as areas of divergence