

Key Insights
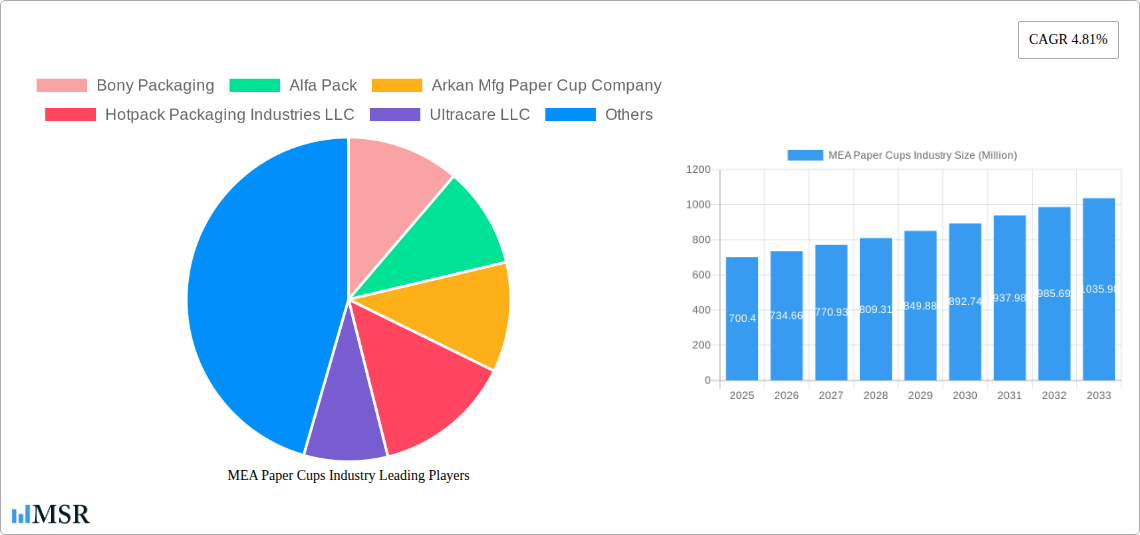
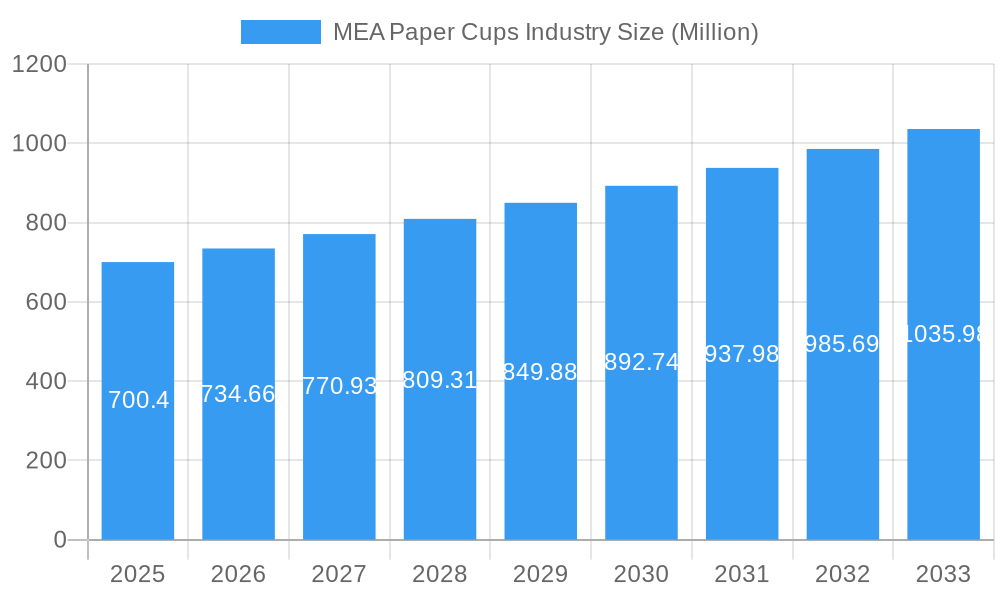
The Middle East and Africa (MEA) paper cups market, valued at $700.40 million in 2025, is projected to experience steady growth, driven by a Compound Annual Growth Rate (CAGR) of 4.81% from 2025 to 2033. This expansion is fueled by several key factors. The burgeoning quick-service restaurant (QSR) sector across the region is a significant driver, with increased demand for disposable tableware. Rising urbanization and changing lifestyles are further contributing to higher consumption of paper cups, particularly in urban centers of countries like the UAE, Saudi Arabia, and Nigeria. The convenience and hygiene associated with paper cups, especially compared to reusable alternatives, make them attractive to both consumers and businesses. Furthermore, product innovation, such as the introduction of biodegradable and eco-friendly paper cups, is catering to growing environmental concerns and creating new market opportunities. However, fluctuating raw material prices (primarily pulp) and potential increases in plastic taxes could pose challenges to market growth. Segmentation reveals strong demand across various applications, including QSRs, institutional settings (schools, hospitals), and other sectors. The market is also segmented by cup type, with hot and cold paper cups catering to specific needs. Competitive landscape analysis shows numerous regional and international players vying for market share, resulting in both price competition and innovation in product offerings. Future growth is expected to be influenced by the expansion of the food and beverage industry, evolving consumer preferences, and the adoption of sustainable packaging solutions within the MEA region.
MEA Paper Cups Industry Market Size (In Million)
The MEA paper cups market exhibits a diverse geographical distribution. While the UAE and Saudi Arabia represent substantial market shares due to their advanced economies and large populations, countries like South Africa and Nigeria also contribute significantly, reflecting increasing disposable incomes and a growing preference for convenience products. Future market projections suggest continued growth in all key segments, with the QSR segment expected to remain the dominant application. The projected CAGR of 4.81% points towards a substantial market expansion over the forecast period, although sustained growth will rely on navigating challenges related to raw material costs and evolving environmental regulations. A focus on sustainable alternatives and efficient supply chain management will be crucial for manufacturers to capitalize on the anticipated market expansion.
MEA Paper Cups Industry Company Market Share
MEA Paper Cups Industry: A Comprehensive Market Report (2019-2033)
This comprehensive report provides an in-depth analysis of the Middle East and Africa (MEA) paper cups industry, covering market size, growth drivers, key players, and future trends. With a study period spanning 2019-2033, a base year of 2025, and a forecast period of 2025-2033, this report offers actionable insights for industry stakeholders, investors, and businesses operating within this dynamic sector. The report's detailed segmentation analyzes the market by cup type (hot and cold), application (quick service restaurants, institutional, and other), and country (UAE, Saudi Arabia, South Africa, Nigeria, and the rest of MEA). The estimated market value for 2025 is XX Million, with a projected CAGR of XX% during the forecast period.
MEA Paper Cups Industry Market Concentration & Dynamics
The MEA paper cups market exhibits a moderately concentrated landscape, with several key players commanding significant market share. While precise market share figures for individual companies remain proprietary, leading players like Huhtamaki Group and Hotpack Packaging Industries LLC likely hold substantial portions. The industry's innovation ecosystem is evolving, driven by a focus on sustainable materials, improved designs, and enhanced recyclability. Regulatory frameworks, particularly concerning environmental regulations and food safety standards, play a crucial role in shaping market dynamics. Substitute products, such as reusable cups and alternative beverage containers, present some competitive pressure, although the convenience and affordability of paper cups remain key strengths. End-user trends indicate a growing demand fueled by the expanding food service sector and increasing disposable income. M&A activity within the MEA paper cups market has been moderate in recent years, with XX mergers and acquisitions recorded between 2019 and 2024. Future M&A activity is anticipated to be driven by consolidation efforts and expansion into new markets.
- Market Concentration: Moderately concentrated.
- M&A Activity (2019-2024): XX deals.
- Key Drivers: Expanding food service sector, rising disposable incomes, increasing consumer preference for convenience.
- Challenges: Competition from substitute products, environmental regulations.
MEA Paper Cups Industry Industry Insights & Trends
The MEA paper cups market is experiencing robust growth, propelled by several key factors. The region's expanding population, rapid urbanization, and a burgeoning food service industry are major drivers. The market size in 2024 is estimated at XX Million, demonstrating substantial growth since 2019. Technological advancements in paper cup manufacturing, such as improved coating technologies and the use of recycled materials, are influencing market dynamics. Evolving consumer preferences, including a heightened focus on sustainability and eco-friendly products, are shaping demand. The CAGR of the MEA paper cups market from 2019 to 2024 is estimated at XX%, indicating strong and consistent growth. The forecast period of 2025-2033 anticipates a similar rate of growth, although precise predictions will rely on future economic conditions and consumer trends. Increased awareness of environmental concerns has opened opportunities for companies that offer biodegradable or recycled paper cups, while the demand for customized cups with branding options continues to create niches in the market. This combination of factors ensures that the market remains dynamic and attractive for new investments.
Key Markets & Segments Leading MEA Paper Cups Industry
The Middle East and Africa (MEA) paper cups industry is experiencing robust growth, with the United Arab Emirates (UAE) and Saudi Arabia spearheading this expansion. These nations lead due to their dynamic economies, advanced infrastructure, and a consistently high demand for beverages, particularly within the thriving food service sector. Beyond these economic powerhouses, South Africa plays a pivotal role in the Sub-Saharan African landscape, demonstrating strong market presence and consumer engagement.
- By Cup Type: The market is significantly influenced by the demand for hot paper cups, driven by the pervasive culture of tea and coffee consumption across the region. Trailing closely are cold paper cups, whose demand is escalating with the increasing popularity of chilled beverages and convenience.
- By Application: Quick Service Restaurants (QSRs) represent the largest and most dominant application segment, benefiting from busy lifestyles and the convenience they offer. Institutional settings, encompassing hospitals, educational institutions, and corporate offices, also constitute a substantial segment. Furthermore, emerging applications within events and the retail sector are contributing increasingly to the overall market dynamics.
-
By Country:
- UAE: A high per capita income, coupled with a substantial expatriate population, fuels a constant demand for convenient and disposable beverage packaging solutions.
- Saudi Arabia: A rapidly growing population and aggressive expansion within the food service and hospitality industries are key drivers of market growth.
- South Africa: As a significant player in Sub-Saharan Africa, South Africa boasts a well-established food service industry and a growing consumer base for ready-to-drink beverages.
- Nigeria: This market presents immense potential due to its vast and expanding population. However, infrastructural limitations and logistical challenges are factors that companies need to navigate carefully.
- Rest of MEA: A diverse array of smaller, yet developing, markets across the MEA region are exhibiting considerable growth potential as economies mature and consumer spending power increases.
MEA Paper Cups Industry Product Developments
Recent innovations focus on enhancing sustainability, including the use of recycled paper and biodegradable coatings. Manufacturers are also developing improved designs for better functionality and reduced leakage. The introduction of innovative designs and materials in paper cups has led to increased market competitiveness and offers consumers more choices. Advanced printing techniques allow for better customization options, catering to both branding and functionality. These developments cater to growing consumer demand for eco-friendly and convenient products.
Challenges in the MEA Paper Cups Industry Market
The MEA paper cups industry navigates several significant challenges that can impact its growth trajectory. Fluctuations in the prices of raw materials, particularly virgin paper pulp, directly affect manufacturing costs and overall profitability. Disruptions within global and regional supply chains can lead to production delays and impact the timely distribution of finished products. The market is characterized by intense competition from both established domestic manufacturers and international players, necessitating a constant focus on innovation, product differentiation, and cost-effective operational strategies. Furthermore, the industry is under increasing scrutiny to adopt more environmentally responsible practices and adhere to evolving and often stricter environmental regulations, demanding investment in sustainable materials and processes.
Forces Driving MEA Paper Cups Industry Growth
Several factors propel the MEA paper cups industry's growth. The expanding food service sector, driven by urbanization and changing lifestyles, is a major driver. Economic growth in several MEA countries increases disposable incomes and consumer spending. Favorable government policies and investments in infrastructure facilitate industry expansion. Rising demand for takeaway food and beverages further contributes to growth.
Long-Term Growth Catalysts in the MEA Paper Cups Industry
Long-term growth will be driven by sustainable innovations, strategic partnerships, and market expansion into untapped regions within MEA. The development of fully biodegradable and compostable paper cups will be crucial in addressing environmental concerns. Collaboration among manufacturers, suppliers, and recycling companies will enhance sustainable practices. Expansion into smaller and emerging markets in the region will unlock significant potential for growth.
Emerging Opportunities in MEA Paper Cups Industry
The MEA paper cups industry is ripe with emerging opportunities, driven by changing consumer preferences and technological advancements. The burgeoning demand for sustainable and eco-friendly paper cups, crafted from recycled or biodegradable materials, presents a significant avenue for growth and market differentiation. Personalization and customization options are becoming increasingly vital, allowing brands to connect with consumers through unique designs, logos, and branding. Expansion into new and specialized applications, such as dedicated cups for the healthcare sector (e.g., for medication distribution) and premium options for the rapidly growing catering and event management industries, offers substantial untapped potential. The ability to offer bespoke designs and branding is a powerful opportunity for companies to stand out in a competitive market. Additionally, forging strategic partnerships with recycling facilities to establish robust collection and reprocessing systems can not only bolster sustainability credentials but also create valuable, mutually beneficial business relationships.
Leading Players in the MEA Paper Cups Industry Sector
- Bony Packaging
- Alfa Pack
- Arkan Mfg Paper Cup Company
- Hotpack Packaging Industries LLC
- Ultracare LLC
- Golden Paper Cups Manufacturing LLC
- Falcon Pack
- Detpak South Africa (Pty) Ltd
- Huhtamaki Group
- Pack-Zone
- MAIMOON Papers Industry LLC
- Saqr Pack
- Enpi Group
- Gulf East Paper & Plastic Group
- Graphic Packaging International
- Saham Group
Key Milestones in MEA Paper Cups Industry Industry
- September 2022: Huhtamaki and Stora Enso's collaborative launch of the "Cup Collective" recycling initiative marked a significant step forward in promoting circular economy principles and enhancing the sustainability of paper cup usage across the region.
- November 2022: Hotpack Global's strategic expansion with the inauguration of a new, state-of-the-art manufacturing plant in Qatar significantly boosted its production capacity and reinforced its market reach within the GCC and beyond.
Strategic Outlook for MEA Paper Cups Industry Market
The MEA paper cups market is poised for substantial future growth, presenting strategic opportunities for forward-thinking companies. A paramount focus on enhancing sustainability through innovative materials and responsible sourcing will be crucial for long-term success and consumer acceptance. Expanding product portfolios to cater to diverse applications, from everyday use to specialized needs, will allow companies to capture a broader market share. Capitalizing on the region's continuously expanding food service sector by offering reliable and high-quality packaging solutions is essential. Companies that prioritize continuous innovation, embed sustainability into their core operations, and establish resilient and efficient supply chains will be best positioned to thrive in this dynamic industry. Furthermore, a keen focus on delivering customized solutions and adapting to the evolving preferences of a diverse and discerning consumer base will be instrumental in driving sustained growth and profitability in the MEA paper cups market.
MEA Paper Cups Industry Segmentation
-
1. Cup Type
- 1.1. Hot Paper Cup
- 1.2. Cold Paper Cup
-
2. Application
- 2.1. Quick Service Restaurants
- 2.2. Institutional
- 2.3. Other Applications
MEA Paper Cups Industry Segmentation By Geography
-
1. North America
- 1.1. United States
- 1.2. Canada
- 1.3. Mexico
-
2. South America
- 2.1. Brazil
- 2.2. Argentina
- 2.3. Rest of South America
-
3. Europe
- 3.1. United Kingdom
- 3.2. Germany
- 3.3. France
- 3.4. Italy
- 3.5. Spain
- 3.6. Russia
- 3.7. Benelux
- 3.8. Nordics
- 3.9. Rest of Europe
-
4. Middle East & Africa
- 4.1. Turkey
- 4.2. Israel
- 4.3. GCC
- 4.4. North Africa
- 4.5. South Africa
- 4.6. Rest of Middle East & Africa
-
5. Asia Pacific
- 5.1. China
- 5.2. India
- 5.3. Japan
- 5.4. South Korea
- 5.5. ASEAN
- 5.6. Oceania
- 5.7. Rest of Asia Pacific
MEA Paper Cups Industry Regional Market Share
Geographic Coverage of MEA Paper Cups Industry
MEA Paper Cups Industry REPORT HIGHLIGHTS
| Aspects | Details |
|---|---|
| Study Period | 2020-2034 |
| Base Year | 2025 |
| Estimated Year | 2026 |
| Forecast Period | 2026-2034 |
| Historical Period | 2020-2025 |
| Growth Rate | CAGR of 4.81% from 2020-2034 |
| Segmentation |
|
Table of Contents
- 1. Introduction
- 1.1. Research Scope
- 1.2. Market Segmentation
- 1.3. Research Objective
- 1.4. Definitions and Assumptions
- 2. Executive Summary
- 2.1. Market Snapshot
- 3. Market Dynamics
- 3.1. Market Drivers
- 3.2. Market Restrains
- 3.3. Market Trends
- 3.4. Market Opportunities
- 4. Market Factor Analysis
- 4.1. Porters Five Forces
- 4.1.1. Bargaining Power of Suppliers
- 4.1.2. Bargaining Power of Buyers
- 4.1.3. Threat of New Entrants
- 4.1.4. Threat of Substitutes
- 4.1.5. Competitive Rivalry
- 4.2. PESTEL analysis
- 4.3. BCG Analysis
- 4.3.1. Stars (High Growth, High Market Share)
- 4.3.2. Cash Cows (Low Growth, High Market Share)
- 4.3.3. Question Mark (High Growth, Low Market Share)
- 4.3.4. Dogs (Low Growth, Low Market Share)
- 4.4. Ansoff Matrix Analysis
- 4.5. Supply Chain Analysis
- 4.6. Regulatory Landscape
- 4.7. Current Market Potential and Opportunity Assessment (TAM–SAM–SOM Framework)
- 4.8. MSR Analyst Note
- 4.1. Porters Five Forces
- 5. Market Analysis, Insights and Forecast 2021-2033
- 5.1. Market Analysis, Insights and Forecast - by Cup Type
- 5.1.1. Hot Paper Cup
- 5.1.2. Cold Paper Cup
- 5.2. Market Analysis, Insights and Forecast - by Application
- 5.2.1. Quick Service Restaurants
- 5.2.2. Institutional
- 5.2.3. Other Applications
- 5.3. Market Analysis, Insights and Forecast - by Region
- 5.3.1. North America
- 5.3.2. South America
- 5.3.3. Europe
- 5.3.4. Middle East & Africa
- 5.3.5. Asia Pacific
- 5.1. Market Analysis, Insights and Forecast - by Cup Type
- 6. Global MEA Paper Cups Industry Analysis, Insights and Forecast, 2021-2033
- 6.1. Market Analysis, Insights and Forecast - by Cup Type
- 6.1.1. Hot Paper Cup
- 6.1.2. Cold Paper Cup
- 6.2. Market Analysis, Insights and Forecast - by Application
- 6.2.1. Quick Service Restaurants
- 6.2.2. Institutional
- 6.2.3. Other Applications
- 6.1. Market Analysis, Insights and Forecast - by Cup Type
- 7. North America MEA Paper Cups Industry Analysis, Insights and Forecast, 2020-2032
- 7.1. Market Analysis, Insights and Forecast - by Cup Type
- 7.1.1. Hot Paper Cup
- 7.1.2. Cold Paper Cup
- 7.2. Market Analysis, Insights and Forecast - by Application
- 7.2.1. Quick Service Restaurants
- 7.2.2. Institutional
- 7.2.3. Other Applications
- 7.1. Market Analysis, Insights and Forecast - by Cup Type
- 8. South America MEA Paper Cups Industry Analysis, Insights and Forecast, 2020-2032
- 8.1. Market Analysis, Insights and Forecast - by Cup Type
- 8.1.1. Hot Paper Cup
- 8.1.2. Cold Paper Cup
- 8.2. Market Analysis, Insights and Forecast - by Application
- 8.2.1. Quick Service Restaurants
- 8.2.2. Institutional
- 8.2.3. Other Applications
- 8.1. Market Analysis, Insights and Forecast - by Cup Type
- 9. Europe MEA Paper Cups Industry Analysis, Insights and Forecast, 2020-2032
- 9.1. Market Analysis, Insights and Forecast - by Cup Type
- 9.1.1. Hot Paper Cup
- 9.1.2. Cold Paper Cup
- 9.2. Market Analysis, Insights and Forecast - by Application
- 9.2.1. Quick Service Restaurants
- 9.2.2. Institutional
- 9.2.3. Other Applications
- 9.1. Market Analysis, Insights and Forecast - by Cup Type
- 10. Middle East & Africa MEA Paper Cups Industry Analysis, Insights and Forecast, 2020-2032
- 10.1. Market Analysis, Insights and Forecast - by Cup Type
- 10.1.1. Hot Paper Cup
- 10.1.2. Cold Paper Cup
- 10.2. Market Analysis, Insights and Forecast - by Application
- 10.2.1. Quick Service Restaurants
- 10.2.2. Institutional
- 10.2.3. Other Applications
- 10.1. Market Analysis, Insights and Forecast - by Cup Type
- 11. Asia Pacific MEA Paper Cups Industry Analysis, Insights and Forecast, 2020-2032
- 11.1. Market Analysis, Insights and Forecast - by Cup Type
- 11.1.1. Hot Paper Cup
- 11.1.2. Cold Paper Cup
- 11.2. Market Analysis, Insights and Forecast - by Application
- 11.2.1. Quick Service Restaurants
- 11.2.2. Institutional
- 11.2.3. Other Applications
- 11.1. Market Analysis, Insights and Forecast - by Cup Type
- 12. Competitive Analysis
- 12.1. Company Profiles
- 12.1.1 Bony Packaging
- 12.1.1.1. Company Overview
- 12.1.1.2. Products
- 12.1.1.3. Company Financials
- 12.1.1.4. SWOT Analysis
- 12.1.2 Alfa Pack
- 12.1.2.1. Company Overview
- 12.1.2.2. Products
- 12.1.2.3. Company Financials
- 12.1.2.4. SWOT Analysis
- 12.1.3 Arkan Mfg Paper Cup Company
- 12.1.3.1. Company Overview
- 12.1.3.2. Products
- 12.1.3.3. Company Financials
- 12.1.3.4. SWOT Analysis
- 12.1.4 Hotpack Packaging Industries LLC
- 12.1.4.1. Company Overview
- 12.1.4.2. Products
- 12.1.4.3. Company Financials
- 12.1.4.4. SWOT Analysis
- 12.1.5 Ultracare LLC
- 12.1.5.1. Company Overview
- 12.1.5.2. Products
- 12.1.5.3. Company Financials
- 12.1.5.4. SWOT Analysis
- 12.1.6 Golden Paper Cups Manufacturing LLC
- 12.1.6.1. Company Overview
- 12.1.6.2. Products
- 12.1.6.3. Company Financials
- 12.1.6.4. SWOT Analysis
- 12.1.7 Falcon Pack*List Not Exhaustive
- 12.1.7.1. Company Overview
- 12.1.7.2. Products
- 12.1.7.3. Company Financials
- 12.1.7.4. SWOT Analysis
- 12.1.8 Detpak South Africa (Pty) Ltd
- 12.1.8.1. Company Overview
- 12.1.8.2. Products
- 12.1.8.3. Company Financials
- 12.1.8.4. SWOT Analysis
- 12.1.9 Huhtamaki Group
- 12.1.9.1. Company Overview
- 12.1.9.2. Products
- 12.1.9.3. Company Financials
- 12.1.9.4. SWOT Analysis
- 12.1.10 Pack- Zone
- 12.1.10.1. Company Overview
- 12.1.10.2. Products
- 12.1.10.3. Company Financials
- 12.1.10.4. SWOT Analysis
- 12.1.11 MAIMOON Papers Industry LLC
- 12.1.11.1. Company Overview
- 12.1.11.2. Products
- 12.1.11.3. Company Financials
- 12.1.11.4. SWOT Analysis
- 12.1.12 Saqr Pack
- 12.1.12.1. Company Overview
- 12.1.12.2. Products
- 12.1.12.3. Company Financials
- 12.1.12.4. SWOT Analysis
- 12.1.13 Enpi Group
- 12.1.13.1. Company Overview
- 12.1.13.2. Products
- 12.1.13.3. Company Financials
- 12.1.13.4. SWOT Analysis
- 12.1.14 Gulf East Paper & Plastic Group
- 12.1.14.1. Company Overview
- 12.1.14.2. Products
- 12.1.14.3. Company Financials
- 12.1.14.4. SWOT Analysis
- 12.1.15 Graphic Packaging International
- 12.1.15.1. Company Overview
- 12.1.15.2. Products
- 12.1.15.3. Company Financials
- 12.1.15.4. SWOT Analysis
- 12.1.16 Saham Group
- 12.1.16.1. Company Overview
- 12.1.16.2. Products
- 12.1.16.3. Company Financials
- 12.1.16.4. SWOT Analysis
- 12.1.1 Bony Packaging
- 12.2. Market Entropy
- 12.2.1 Company's Key Areas Served
- 12.2.2 Recent Developments
- 12.3. Company Market Share Analysis 2025
- 12.3.1 Top 5 Companies Market Share Analysis
- 12.3.2 Top 3 Companies Market Share Analysis
- 12.4. List of Potential Customers
- 13. Research Methodology
List of Figures
- Figure 1: Global MEA Paper Cups Industry Revenue Breakdown (Million, %) by Region 2025 & 2033
- Figure 2: North America MEA Paper Cups Industry Revenue (Million), by Cup Type 2025 & 2033
- Figure 3: North America MEA Paper Cups Industry Revenue Share (%), by Cup Type 2025 & 2033
- Figure 4: North America MEA Paper Cups Industry Revenue (Million), by Application 2025 & 2033
- Figure 5: North America MEA Paper Cups Industry Revenue Share (%), by Application 2025 & 2033
- Figure 6: North America MEA Paper Cups Industry Revenue (Million), by Country 2025 & 2033
- Figure 7: North America MEA Paper Cups Industry Revenue Share (%), by Country 2025 & 2033
- Figure 8: South America MEA Paper Cups Industry Revenue (Million), by Cup Type 2025 & 2033
- Figure 9: South America MEA Paper Cups Industry Revenue Share (%), by Cup Type 2025 & 2033
- Figure 10: South America MEA Paper Cups Industry Revenue (Million), by Application 2025 & 2033
- Figure 11: South America MEA Paper Cups Industry Revenue Share (%), by Application 2025 & 2033
- Figure 12: South America MEA Paper Cups Industry Revenue (Million), by Country 2025 & 2033
- Figure 13: South America MEA Paper Cups Industry Revenue Share (%), by Country 2025 & 2033
- Figure 14: Europe MEA Paper Cups Industry Revenue (Million), by Cup Type 2025 & 2033
- Figure 15: Europe MEA Paper Cups Industry Revenue Share (%), by Cup Type 2025 & 2033
- Figure 16: Europe MEA Paper Cups Industry Revenue (Million), by Application 2025 & 2033
- Figure 17: Europe MEA Paper Cups Industry Revenue Share (%), by Application 2025 & 2033
- Figure 18: Europe MEA Paper Cups Industry Revenue (Million), by Country 2025 & 2033
- Figure 19: Europe MEA Paper Cups Industry Revenue Share (%), by Country 2025 & 2033
- Figure 20: Middle East & Africa MEA Paper Cups Industry Revenue (Million), by Cup Type 2025 & 2033
- Figure 21: Middle East & Africa MEA Paper Cups Industry Revenue Share (%), by Cup Type 2025 & 2033
- Figure 22: Middle East & Africa MEA Paper Cups Industry Revenue (Million), by Application 2025 & 2033
- Figure 23: Middle East & Africa MEA Paper Cups Industry Revenue Share (%), by Application 2025 & 2033
- Figure 24: Middle East & Africa MEA Paper Cups Industry Revenue (Million), by Country 2025 & 2033
- Figure 25: Middle East & Africa MEA Paper Cups Industry Revenue Share (%), by Country 2025 & 2033
- Figure 26: Asia Pacific MEA Paper Cups Industry Revenue (Million), by Cup Type 2025 & 2033
- Figure 27: Asia Pacific MEA Paper Cups Industry Revenue Share (%), by Cup Type 2025 & 2033
- Figure 28: Asia Pacific MEA Paper Cups Industry Revenue (Million), by Application 2025 & 2033
- Figure 29: Asia Pacific MEA Paper Cups Industry Revenue Share (%), by Application 2025 & 2033
- Figure 30: Asia Pacific MEA Paper Cups Industry Revenue (Million), by Country 2025 & 2033
- Figure 31: Asia Pacific MEA Paper Cups Industry Revenue Share (%), by Country 2025 & 2033
List of Tables
- Table 1: Global MEA Paper Cups Industry Revenue Million Forecast, by Cup Type 2020 & 2033
- Table 2: Global MEA Paper Cups Industry Revenue Million Forecast, by Application 2020 & 2033
- Table 3: Global MEA Paper Cups Industry Revenue Million Forecast, by Region 2020 & 2033
- Table 4: Global MEA Paper Cups Industry Revenue Million Forecast, by Cup Type 2020 & 2033
- Table 5: Global MEA Paper Cups Industry Revenue Million Forecast, by Application 2020 & 2033
- Table 6: Global MEA Paper Cups Industry Revenue Million Forecast, by Country 2020 & 2033
- Table 7: United States MEA Paper Cups Industry Revenue (Million) Forecast, by Application 2020 & 2033
- Table 8: Canada MEA Paper Cups Industry Revenue (Million) Forecast, by Application 2020 & 2033
- Table 9: Mexico MEA Paper Cups Industry Revenue (Million) Forecast, by Application 2020 & 2033
- Table 10: Global MEA Paper Cups Industry Revenue Million Forecast, by Cup Type 2020 & 2033
- Table 11: Global MEA Paper Cups Industry Revenue Million Forecast, by Application 2020 & 2033
- Table 12: Global MEA Paper Cups Industry Revenue Million Forecast, by Country 2020 & 2033
- Table 13: Brazil MEA Paper Cups Industry Revenue (Million) Forecast, by Application 2020 & 2033
- Table 14: Argentina MEA Paper Cups Industry Revenue (Million) Forecast, by Application 2020 & 2033
- Table 15: Rest of South America MEA Paper Cups Industry Revenue (Million) Forecast, by Application 2020 & 2033
- Table 16: Global MEA Paper Cups Industry Revenue Million Forecast, by Cup Type 2020 & 2033
- Table 17: Global MEA Paper Cups Industry Revenue Million Forecast, by Application 2020 & 2033
- Table 18: Global MEA Paper Cups Industry Revenue Million Forecast, by Country 2020 & 2033
- Table 19: United Kingdom MEA Paper Cups Industry Revenue (Million) Forecast, by Application 2020 & 2033
- Table 20: Germany MEA Paper Cups Industry Revenue (Million) Forecast, by Application 2020 & 2033
- Table 21: France MEA Paper Cups Industry Revenue (Million) Forecast, by Application 2020 & 2033
- Table 22: Italy MEA Paper Cups Industry Revenue (Million) Forecast, by Application 2020 & 2033
- Table 23: Spain MEA Paper Cups Industry Revenue (Million) Forecast, by Application 2020 & 2033
- Table 24: Russia MEA Paper Cups Industry Revenue (Million) Forecast, by Application 2020 & 2033
- Table 25: Benelux MEA Paper Cups Industry Revenue (Million) Forecast, by Application 2020 & 2033
- Table 26: Nordics MEA Paper Cups Industry Revenue (Million) Forecast, by Application 2020 & 2033
- Table 27: Rest of Europe MEA Paper Cups Industry Revenue (Million) Forecast, by Application 2020 & 2033
- Table 28: Global MEA Paper Cups Industry Revenue Million Forecast, by Cup Type 2020 & 2033
- Table 29: Global MEA Paper Cups Industry Revenue Million Forecast, by Application 2020 & 2033
- Table 30: Global MEA Paper Cups Industry Revenue Million Forecast, by Country 2020 & 2033
- Table 31: Turkey MEA Paper Cups Industry Revenue (Million) Forecast, by Application 2020 & 2033
- Table 32: Israel MEA Paper Cups Industry Revenue (Million) Forecast, by Application 2020 & 2033
- Table 33: GCC MEA Paper Cups Industry Revenue (Million) Forecast, by Application 2020 & 2033
- Table 34: North Africa MEA Paper Cups Industry Revenue (Million) Forecast, by Application 2020 & 2033
- Table 35: South Africa MEA Paper Cups Industry Revenue (Million) Forecast, by Application 2020 & 2033
- Table 36: Rest of Middle East & Africa MEA Paper Cups Industry Revenue (Million) Forecast, by Application 2020 & 2033
- Table 37: Global MEA Paper Cups Industry Revenue Million Forecast, by Cup Type 2020 & 2033
- Table 38: Global MEA Paper Cups Industry Revenue Million Forecast, by Application 2020 & 2033
- Table 39: Global MEA Paper Cups Industry Revenue Million Forecast, by Country 2020 & 2033
- Table 40: China MEA Paper Cups Industry Revenue (Million) Forecast, by Application 2020 & 2033
- Table 41: India MEA Paper Cups Industry Revenue (Million) Forecast, by Application 2020 & 2033
- Table 42: Japan MEA Paper Cups Industry Revenue (Million) Forecast, by Application 2020 & 2033
- Table 43: South Korea MEA Paper Cups Industry Revenue (Million) Forecast, by Application 2020 & 2033
- Table 44: ASEAN MEA Paper Cups Industry Revenue (Million) Forecast, by Application 2020 & 2033
- Table 45: Oceania MEA Paper Cups Industry Revenue (Million) Forecast, by Application 2020 & 2033
- Table 46: Rest of Asia Pacific MEA Paper Cups Industry Revenue (Million) Forecast, by Application 2020 & 2033
Frequently Asked Questions
1. What is the projected Compound Annual Growth Rate (CAGR) of the MEA Paper Cups Industry?
The projected CAGR is approximately 4.81%.
2. Which companies are prominent players in the MEA Paper Cups Industry?
Key companies in the market include Bony Packaging, Alfa Pack, Arkan Mfg Paper Cup Company, Hotpack Packaging Industries LLC, Ultracare LLC, Golden Paper Cups Manufacturing LLC, Falcon Pack*List Not Exhaustive, Detpak South Africa (Pty) Ltd, Huhtamaki Group, Pack- Zone, MAIMOON Papers Industry LLC, Saqr Pack, Enpi Group, Gulf East Paper & Plastic Group, Graphic Packaging International, Saham Group.
3. What are the main segments of the MEA Paper Cups Industry?
The market segments include Cup Type, Application.
4. Can you provide details about the market size?
The market size is estimated to be USD 700.40 Million as of 2022.
5. What are some drivers contributing to market growth?
Rising Demand For on-the-go Consumption of Beverages; Sustainability Measures Coupled with Recent Innovations have Played a Role in Shelf Life of Products.
6. What are the notable trends driving market growth?
Quick Service Restaurants to Witness the Growth.
7. Are there any restraints impacting market growth?
Ongoing Market Fragmentation and the Dependence on Materials Expected to Affect Margins.
8. Can you provide examples of recent developments in the market?
November 2022: HotpackGlobal, the UAE-based global leader in disposable food packaging products, launched its manufacturing plant in Qatar. The plant is the 15th Hotpack-owned and operated factory worldwide, reflecting the company's global vision to become a global food packaging brand leader by 2030. The manufacturing plant is located in Doha's new industrial area, specializing in various Hotpackpaper products ranging from folding and corrugated cartons to paper bags and cups.
9. What pricing options are available for accessing the report?
Pricing options include single-user, multi-user, and enterprise licenses priced at USD 4750, USD 5250, and USD 8750 respectively.
10. Is the market size provided in terms of value or volume?
The market size is provided in terms of value, measured in Million.
11. Are there any specific market keywords associated with the report?
Yes, the market keyword associated with the report is "MEA Paper Cups Industry," which aids in identifying and referencing the specific market segment covered.
12. How do I determine which pricing option suits my needs best?
The pricing options vary based on user requirements and access needs. Individual users may opt for single-user licenses, while businesses requiring broader access may choose multi-user or enterprise licenses for cost-effective access to the report.
13. Are there any additional resources or data provided in the MEA Paper Cups Industry report?
While the report offers comprehensive insights, it's advisable to review the specific contents or supplementary materials provided to ascertain if additional resources or data are available.
14. How can I stay updated on further developments or reports in the MEA Paper Cups Industry?
To stay informed about further developments, trends, and reports in the MEA Paper Cups Industry, consider subscribing to industry newsletters, following relevant companies and organizations, or regularly checking reputable industry news sources and publications.
Methodology
Step 1 - Identification of Relevant Samples Size from Population Database


Step 2 - Approaches for Defining Global Market Size (Value, Volume* & Price*)

Note*: In applicable scenarios
Step 3 - Data Sources
Primary Research
- Web Analytics
- Survey Reports
- Research Institute
- Latest Research Reports
- Opinion Leaders
Secondary Research
- Annual Reports
- White Paper
- Latest Press Release
- Industry Association
- Paid Database
- Investor Presentations

Step 4 - Data Triangulation
Involves using different sources of information in order to increase the validity of a study
These sources are likely to be stakeholders in a program - participants, other researchers, program staff, other community members, and so on.
Then we put all data in single framework & apply various statistical tools to find out the dynamic on the market.
During the analysis stage, feedback from the stakeholder groups would be compared to determine areas of agreement as well as areas of divergence