

Key Insights
The Middle East and Africa (MEA) pharmaceutical packaging market is poised for significant expansion, driven by the increasing prevalence of chronic diseases, burgeoning pharmaceutical production, and a heightened demand for advanced drug delivery systems. The market is projected to grow at a Compound Annual Growth Rate (CAGR) of 9%, with a current market size of $3330.2 million in the base year 2024. Key growth catalysts include the rising adoption of sustainable packaging solutions, such as biodegradable plastics and recycled materials, and the transition to sophisticated packaging technologies, including blister and unit-dose packaging, to ensure drug stability and improve patient compliance. Stringent regulatory frameworks promoting product safety and traceability further influence market dynamics.
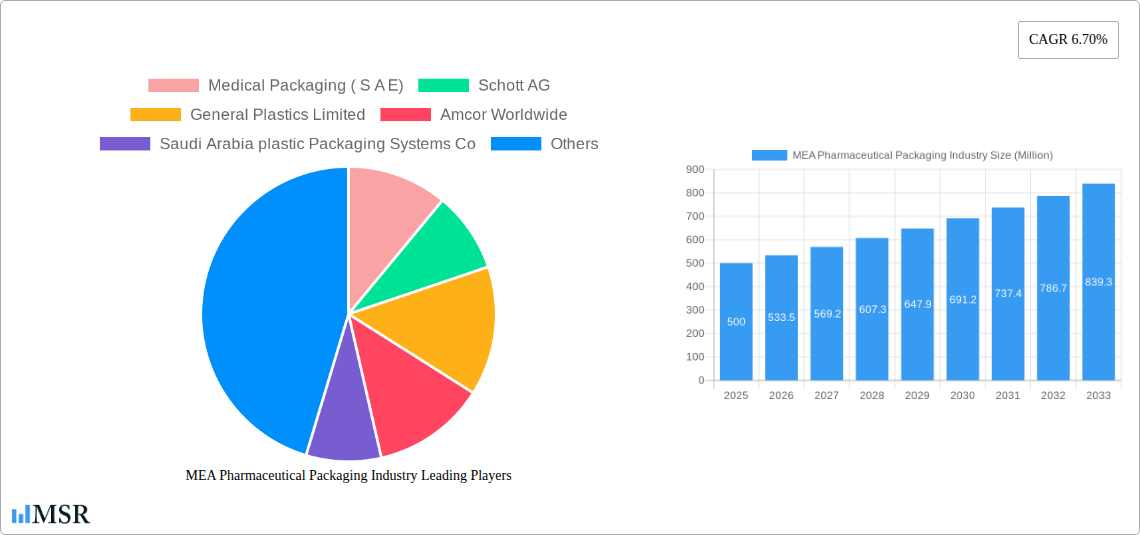
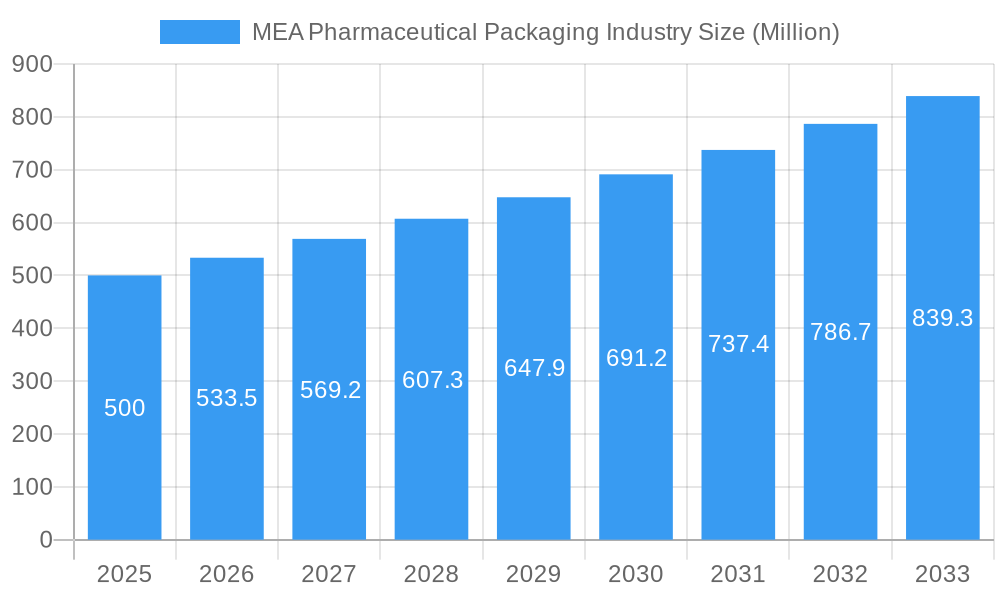
MEA Pharmaceutical Packaging Industry Market Size (In Billion)
Segmentation analysis indicates a strong preference for plastic packaging due to its cost-effectiveness and versatility, followed by glass, essential for pharmaceuticals requiring high barrier properties. Bottles, vials, and ampoules lead the product type segment, reflecting the widespread use of liquid medications. Growth is also anticipated in specialized packaging for injectables and advanced therapies, such as syringes. Major market participants are actively investing in new technologies and expanding their product portfolios to address the evolving needs of pharmaceutical manufacturers and healthcare providers. Competitive pressures and a strong emphasis on cost optimization are key influencing factors.
MEA Pharmaceutical Packaging Industry Company Market Share
Further market expansion is attributed to increasing healthcare expenditure, government initiatives to enhance healthcare infrastructure, and the growing presence of multinational pharmaceutical companies within the MEA region. The market is experiencing a gradual shift from conventional packaging materials towards advanced and sustainable alternatives, fostering innovation in areas like tamper-evident and smart packaging solutions. Despite challenges such as fluctuating raw material costs and regional economic uncertainties, the long-term outlook remains robust, presenting considerable opportunities for both established and emerging players. Strategic focus on supply chain efficiency, optimized logistics, and adherence to evolving regulatory compliance will be paramount for sustained market growth. Regional variations in market dynamics are expected, influenced by diverse regulatory environments, healthcare infrastructure, and economic development across MEA countries.
MEA Pharmaceutical Packaging Industry: A Comprehensive Market Report (2019-2033)
This comprehensive report provides an in-depth analysis of the Middle East and Africa (MEA) pharmaceutical packaging industry, offering invaluable insights for stakeholders, investors, and industry professionals. With a study period spanning 2019-2033, a base year of 2025, and a forecast period of 2025-2033, this report meticulously examines market dynamics, key segments, leading players, and future growth opportunities. The report’s detailed analysis covers market size, CAGR, market share, and M&A activity, providing actionable intelligence for strategic decision-making. The total market value in 2025 is estimated at $XX Million.
MEA Pharmaceutical Packaging Industry Market Concentration & Dynamics
The MEA pharmaceutical packaging market exhibits a moderately consolidated structure, with several key players holding significant market share. The market concentration ratio (CR4 or CR8) is estimated at XX%, indicating a presence of both large multinational corporations and regional players. Innovation in sustainable packaging solutions is driving industry dynamics, alongside evolving regulatory frameworks that prioritize safety and environmental sustainability. Substitute products, such as biodegradable packaging materials, are gaining traction, impacting the market share of traditional materials. End-user trends towards enhanced product safety and convenience fuel demand for innovative packaging solutions. The M&A landscape has witnessed XX deals in the past five years, reflecting consolidation and expansion strategies among industry players.
- Market Share: Top 5 players hold approximately XX% of the market share.
- M&A Activity: An average of XX M&A deals per year were recorded between 2019 and 2024.
- Regulatory Landscape: Stringent regulations regarding material safety and traceability are shaping industry practices.
- Innovation Ecosystem: Active collaborations between packaging manufacturers, pharmaceutical companies, and research institutions drive innovation.
MEA Pharmaceutical Packaging Industry Industry Insights & Trends
The MEA pharmaceutical packaging market is witnessing robust growth, driven by factors such as increasing pharmaceutical production, rising healthcare expenditure, and growing demand for advanced drug delivery systems. The market size reached $XX Million in 2024 and is projected to reach $XX Million by 2033, exhibiting a CAGR of XX% during the forecast period. Technological disruptions, particularly in automation and smart packaging, are transforming industry practices, enhancing efficiency and traceability. Evolving consumer behaviors, including a preference for convenient and user-friendly packaging, are shaping product development strategies. Growth is further fueled by rising disposable incomes and improved healthcare infrastructure in several MEA countries. Sustainability concerns are also driving adoption of eco-friendly packaging materials.
Key Markets & Segments Leading MEA Pharmaceutical Packaging Industry
The plastic segment dominates the MEA pharmaceutical packaging market by material type, accounting for approximately XX% of the total market value in 2025. This is driven by its versatility, cost-effectiveness, and ease of processing. Bottles, vials, and ampoules represent the largest product segment, fueled by strong demand from the injectable drug market. The region of the MEA showing the highest growth is the GCC countries due to increased pharmaceutical manufacturing and rising investments in healthcare infrastructure.
Dominant Segments:
- Material Type: Plastic (XX%), Glass (XX%), Others (XX%)
- Product Type: Bottles, Vials, and Ampoules (XX%); Syringes (XX%); Tubes (XX%); Caps and Closures (XX%); Pouches (XX%); Labels (XX%); Other Product Types (XX%)
Growth Drivers:
- Economic Growth: Rising disposable incomes and expanding healthcare budgets.
- Infrastructure Development: Investments in pharmaceutical manufacturing facilities and healthcare infrastructure.
- Technological Advancements: Adoption of innovative packaging technologies such as smart packaging and automated filling systems.
- Regulatory Support: Government initiatives promoting pharmaceutical manufacturing and healthcare investment.
MEA Pharmaceutical Packaging Industry Product Developments
Significant advancements are witnessed in material science, leading to the development of sustainable and high-barrier packaging materials. Innovative closures and dispensing systems enhance product safety and convenience. Integration of smart packaging technologies, including RFID and track-and-trace solutions, is gaining momentum, improving supply chain visibility and combating counterfeiting. These developments provide manufacturers with a competitive edge in the market.
Challenges in the MEA Pharmaceutical Packaging Industry Market
The MEA pharmaceutical packaging industry faces several challenges, including stringent regulatory compliance requirements, increasing raw material costs, and intense competition from both domestic and international players. Supply chain disruptions can also affect production and delivery timelines. These factors can lead to increased production costs and reduced profitability. Meeting the demands of diverse regulatory standards across the MEA region is an added complexity for manufacturers.
Forces Driving MEA Pharmaceutical Packaging Industry Growth
Key growth drivers include increasing demand for pharmaceutical products, technological advancements in packaging materials and processes, and supportive government regulations promoting the pharmaceutical sector. Economic growth in several MEA countries fuels demand for healthcare products and their packaging. Investments in research and development are continuously improving product quality and safety standards, further enhancing market growth.
Challenges in the MEA Pharmaceutical Packaging Industry Market
Long-term growth hinges on sustained investment in R&D, strategic partnerships with pharmaceutical companies, and expansion into new markets. Innovation in sustainable packaging solutions will be pivotal, as will the ability to meet evolving regulatory standards. The ability to adapt to changing consumer demands and preferences is key to maintaining market competitiveness.
Emerging Opportunities in MEA Pharmaceutical Packaging Industry
Emerging opportunities exist in the development and adoption of sustainable and eco-friendly packaging materials, the integration of smart packaging technologies for enhanced traceability and security, and expansion into niche segments such as personalized medicine packaging. The growing demand for customized packaging solutions also offers growth potential. Focus on personalized healthcare packaging will unlock new revenue streams.
Leading Players in the MEA Pharmaceutical Packaging Industry Sector
- Medical Packaging (S A E)
- Schott AG (Schott AG)
- General Plastics Limited
- Amcor Worldwide (Amcor Worldwide)
- Saudi Arabia plastic Packaging Systems Co
- Rexam PLC (Rexam PLC)
- Sealed Air Corporation (Sealed Air Corporation)
- Rose Plastics Medical Packaging
- Frank NOE Limited
- Indevco Group (Indevco Group)
Key Milestones in MEA Pharmaceutical Packaging Industry Industry
- February 2021: Indevco Plastics launched a print-grade shrink bundling film made with 50% post-consumer recycled resin, promoting circular economy solutions.
- June 2021: Amcor launched ACT2100, an enhanced heat seal coating for healthcare packaging, improving supply chain efficiency and business continuity.
Strategic Outlook for MEA Pharmaceutical Packaging Industry Market
The MEA pharmaceutical packaging market presents significant growth potential, driven by a confluence of factors including rising healthcare expenditure, technological advancements, and supportive regulatory policies. Companies that prioritize innovation, sustainability, and strategic partnerships will be best positioned to capitalize on future growth opportunities. A focus on providing customized solutions and meeting the ever-evolving needs of the pharmaceutical industry is crucial for long-term success.
MEA Pharmaceutical Packaging Industry Segmentation
-
1. Material Type
- 1.1. Plastic
- 1.2. Glass
- 1.3. Others (Paper and Paperboard, Metal)
-
2. Product Type
- 2.1. Bottles
- 2.2. Vials and Ampoules
- 2.3. Syringes
- 2.4. Tubes
- 2.5. Caps and Closures
- 2.6. Pouches
- 2.7. Labels
- 2.8. Other Product Types
MEA Pharmaceutical Packaging Industry Segmentation By Geography
-
1. North America
- 1.1. United States
- 1.2. Canada
- 1.3. Mexico
-
2. South America
- 2.1. Brazil
- 2.2. Argentina
- 2.3. Rest of South America
-
3. Europe
- 3.1. United Kingdom
- 3.2. Germany
- 3.3. France
- 3.4. Italy
- 3.5. Spain
- 3.6. Russia
- 3.7. Benelux
- 3.8. Nordics
- 3.9. Rest of Europe
-
4. Middle East & Africa
- 4.1. Turkey
- 4.2. Israel
- 4.3. GCC
- 4.4. North Africa
- 4.5. South Africa
- 4.6. Rest of Middle East & Africa
-
5. Asia Pacific
- 5.1. China
- 5.2. India
- 5.3. Japan
- 5.4. South Korea
- 5.5. ASEAN
- 5.6. Oceania
- 5.7. Rest of Asia Pacific
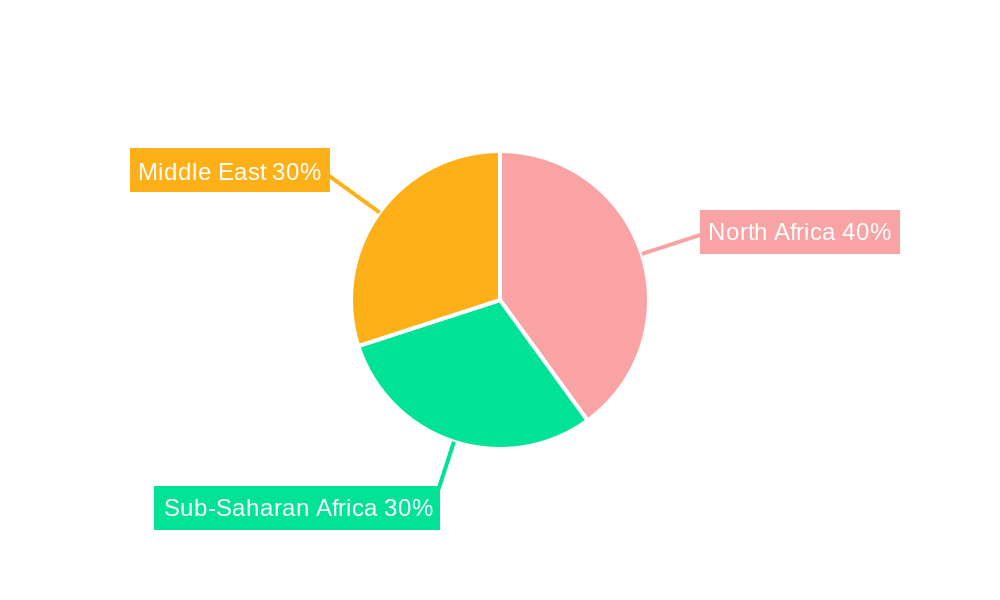
MEA Pharmaceutical Packaging Industry Regional Market Share
Geographic Coverage of MEA Pharmaceutical Packaging Industry
MEA Pharmaceutical Packaging Industry REPORT HIGHLIGHTS
| Aspects | Details |
|---|---|
| Study Period | 2020-2034 |
| Base Year | 2025 |
| Estimated Year | 2026 |
| Forecast Period | 2026-2034 |
| Historical Period | 2020-2025 |
| Growth Rate | CAGR of 9% from 2020-2034 |
| Segmentation |
|
Table of Contents
- 1. Introduction
- 1.1. Research Scope
- 1.2. Market Segmentation
- 1.3. Research Objective
- 1.4. Definitions and Assumptions
- 2. Executive Summary
- 2.1. Market Snapshot
- 3. Market Dynamics
- 3.1. Market Drivers
- 3.2. Market Restrains
- 3.3. Market Trends
- 3.4. Market Opportunities
- 4. Market Factor Analysis
- 4.1. Porters Five Forces
- 4.1.1. Bargaining Power of Suppliers
- 4.1.2. Bargaining Power of Buyers
- 4.1.3. Threat of New Entrants
- 4.1.4. Threat of Substitutes
- 4.1.5. Competitive Rivalry
- 4.2. PESTEL analysis
- 4.3. BCG Analysis
- 4.3.1. Stars (High Growth, High Market Share)
- 4.3.2. Cash Cows (Low Growth, High Market Share)
- 4.3.3. Question Mark (High Growth, Low Market Share)
- 4.3.4. Dogs (Low Growth, Low Market Share)
- 4.4. Ansoff Matrix Analysis
- 4.5. Supply Chain Analysis
- 4.6. Regulatory Landscape
- 4.7. Current Market Potential and Opportunity Assessment (TAM–SAM–SOM Framework)
- 4.8. MSR Analyst Note
- 4.1. Porters Five Forces
- 5. Market Analysis, Insights and Forecast 2021-2033
- 5.1. Market Analysis, Insights and Forecast - by Material Type
- 5.1.1. Plastic
- 5.1.2. Glass
- 5.1.3. Others (Paper and Paperboard, Metal)
- 5.2. Market Analysis, Insights and Forecast - by Product Type
- 5.2.1. Bottles
- 5.2.2. Vials and Ampoules
- 5.2.3. Syringes
- 5.2.4. Tubes
- 5.2.5. Caps and Closures
- 5.2.6. Pouches
- 5.2.7. Labels
- 5.2.8. Other Product Types
- 5.3. Market Analysis, Insights and Forecast - by Region
- 5.3.1. North America
- 5.3.2. South America
- 5.3.3. Europe
- 5.3.4. Middle East & Africa
- 5.3.5. Asia Pacific
- 5.1. Market Analysis, Insights and Forecast - by Material Type
- 6. Global MEA Pharmaceutical Packaging Industry Analysis, Insights and Forecast, 2021-2033
- 6.1. Market Analysis, Insights and Forecast - by Material Type
- 6.1.1. Plastic
- 6.1.2. Glass
- 6.1.3. Others (Paper and Paperboard, Metal)
- 6.2. Market Analysis, Insights and Forecast - by Product Type
- 6.2.1. Bottles
- 6.2.2. Vials and Ampoules
- 6.2.3. Syringes
- 6.2.4. Tubes
- 6.2.5. Caps and Closures
- 6.2.6. Pouches
- 6.2.7. Labels
- 6.2.8. Other Product Types
- 6.1. Market Analysis, Insights and Forecast - by Material Type
- 7. North America MEA Pharmaceutical Packaging Industry Analysis, Insights and Forecast, 2020-2032
- 7.1. Market Analysis, Insights and Forecast - by Material Type
- 7.1.1. Plastic
- 7.1.2. Glass
- 7.1.3. Others (Paper and Paperboard, Metal)
- 7.2. Market Analysis, Insights and Forecast - by Product Type
- 7.2.1. Bottles
- 7.2.2. Vials and Ampoules
- 7.2.3. Syringes
- 7.2.4. Tubes
- 7.2.5. Caps and Closures
- 7.2.6. Pouches
- 7.2.7. Labels
- 7.2.8. Other Product Types
- 7.1. Market Analysis, Insights and Forecast - by Material Type
- 8. South America MEA Pharmaceutical Packaging Industry Analysis, Insights and Forecast, 2020-2032
- 8.1. Market Analysis, Insights and Forecast - by Material Type
- 8.1.1. Plastic
- 8.1.2. Glass
- 8.1.3. Others (Paper and Paperboard, Metal)
- 8.2. Market Analysis, Insights and Forecast - by Product Type
- 8.2.1. Bottles
- 8.2.2. Vials and Ampoules
- 8.2.3. Syringes
- 8.2.4. Tubes
- 8.2.5. Caps and Closures
- 8.2.6. Pouches
- 8.2.7. Labels
- 8.2.8. Other Product Types
- 8.1. Market Analysis, Insights and Forecast - by Material Type
- 9. Europe MEA Pharmaceutical Packaging Industry Analysis, Insights and Forecast, 2020-2032
- 9.1. Market Analysis, Insights and Forecast - by Material Type
- 9.1.1. Plastic
- 9.1.2. Glass
- 9.1.3. Others (Paper and Paperboard, Metal)
- 9.2. Market Analysis, Insights and Forecast - by Product Type
- 9.2.1. Bottles
- 9.2.2. Vials and Ampoules
- 9.2.3. Syringes
- 9.2.4. Tubes
- 9.2.5. Caps and Closures
- 9.2.6. Pouches
- 9.2.7. Labels
- 9.2.8. Other Product Types
- 9.1. Market Analysis, Insights and Forecast - by Material Type
- 10. Middle East & Africa MEA Pharmaceutical Packaging Industry Analysis, Insights and Forecast, 2020-2032
- 10.1. Market Analysis, Insights and Forecast - by Material Type
- 10.1.1. Plastic
- 10.1.2. Glass
- 10.1.3. Others (Paper and Paperboard, Metal)
- 10.2. Market Analysis, Insights and Forecast - by Product Type
- 10.2.1. Bottles
- 10.2.2. Vials and Ampoules
- 10.2.3. Syringes
- 10.2.4. Tubes
- 10.2.5. Caps and Closures
- 10.2.6. Pouches
- 10.2.7. Labels
- 10.2.8. Other Product Types
- 10.1. Market Analysis, Insights and Forecast - by Material Type
- 11. Asia Pacific MEA Pharmaceutical Packaging Industry Analysis, Insights and Forecast, 2020-2032
- 11.1. Market Analysis, Insights and Forecast - by Material Type
- 11.1.1. Plastic
- 11.1.2. Glass
- 11.1.3. Others (Paper and Paperboard, Metal)
- 11.2. Market Analysis, Insights and Forecast - by Product Type
- 11.2.1. Bottles
- 11.2.2. Vials and Ampoules
- 11.2.3. Syringes
- 11.2.4. Tubes
- 11.2.5. Caps and Closures
- 11.2.6. Pouches
- 11.2.7. Labels
- 11.2.8. Other Product Types
- 11.1. Market Analysis, Insights and Forecast - by Material Type
- 12. Competitive Analysis
- 12.1. Company Profiles
- 12.1.1 Medical Packaging ( S A E)
- 12.1.1.1. Company Overview
- 12.1.1.2. Products
- 12.1.1.3. Company Financials
- 12.1.1.4. SWOT Analysis
- 12.1.2 Schott AG
- 12.1.2.1. Company Overview
- 12.1.2.2. Products
- 12.1.2.3. Company Financials
- 12.1.2.4. SWOT Analysis
- 12.1.3 General Plastics Limited
- 12.1.3.1. Company Overview
- 12.1.3.2. Products
- 12.1.3.3. Company Financials
- 12.1.3.4. SWOT Analysis
- 12.1.4 Amcor Worldwide
- 12.1.4.1. Company Overview
- 12.1.4.2. Products
- 12.1.4.3. Company Financials
- 12.1.4.4. SWOT Analysis
- 12.1.5 Saudi Arabia plastic Packaging Systems Co
- 12.1.5.1. Company Overview
- 12.1.5.2. Products
- 12.1.5.3. Company Financials
- 12.1.5.4. SWOT Analysis
- 12.1.6 Rexam PLC
- 12.1.6.1. Company Overview
- 12.1.6.2. Products
- 12.1.6.3. Company Financials
- 12.1.6.4. SWOT Analysis
- 12.1.7 Sealed Air Corporation
- 12.1.7.1. Company Overview
- 12.1.7.2. Products
- 12.1.7.3. Company Financials
- 12.1.7.4. SWOT Analysis
- 12.1.8 Rose Plastics Medical Packagin
- 12.1.8.1. Company Overview
- 12.1.8.2. Products
- 12.1.8.3. Company Financials
- 12.1.8.4. SWOT Analysis
- 12.1.9 Frank NOE Limited
- 12.1.9.1. Company Overview
- 12.1.9.2. Products
- 12.1.9.3. Company Financials
- 12.1.9.4. SWOT Analysis
- 12.1.10 Indevco Group
- 12.1.10.1. Company Overview
- 12.1.10.2. Products
- 12.1.10.3. Company Financials
- 12.1.10.4. SWOT Analysis
- 12.1.1 Medical Packaging ( S A E)
- 12.2. Market Entropy
- 12.2.1 Company's Key Areas Served
- 12.2.2 Recent Developments
- 12.3. Company Market Share Analysis 2025
- 12.3.1 Top 5 Companies Market Share Analysis
- 12.3.2 Top 3 Companies Market Share Analysis
- 12.4. List of Potential Customers
- 13. Research Methodology
List of Figures
- Figure 1: Global MEA Pharmaceutical Packaging Industry Revenue Breakdown (million, %) by Region 2025 & 2033
- Figure 2: North America MEA Pharmaceutical Packaging Industry Revenue (million), by Material Type 2025 & 2033
- Figure 3: North America MEA Pharmaceutical Packaging Industry Revenue Share (%), by Material Type 2025 & 2033
- Figure 4: North America MEA Pharmaceutical Packaging Industry Revenue (million), by Product Type 2025 & 2033
- Figure 5: North America MEA Pharmaceutical Packaging Industry Revenue Share (%), by Product Type 2025 & 2033
- Figure 6: North America MEA Pharmaceutical Packaging Industry Revenue (million), by Country 2025 & 2033
- Figure 7: North America MEA Pharmaceutical Packaging Industry Revenue Share (%), by Country 2025 & 2033
- Figure 8: South America MEA Pharmaceutical Packaging Industry Revenue (million), by Material Type 2025 & 2033
- Figure 9: South America MEA Pharmaceutical Packaging Industry Revenue Share (%), by Material Type 2025 & 2033
- Figure 10: South America MEA Pharmaceutical Packaging Industry Revenue (million), by Product Type 2025 & 2033
- Figure 11: South America MEA Pharmaceutical Packaging Industry Revenue Share (%), by Product Type 2025 & 2033
- Figure 12: South America MEA Pharmaceutical Packaging Industry Revenue (million), by Country 2025 & 2033
- Figure 13: South America MEA Pharmaceutical Packaging Industry Revenue Share (%), by Country 2025 & 2033
- Figure 14: Europe MEA Pharmaceutical Packaging Industry Revenue (million), by Material Type 2025 & 2033
- Figure 15: Europe MEA Pharmaceutical Packaging Industry Revenue Share (%), by Material Type 2025 & 2033
- Figure 16: Europe MEA Pharmaceutical Packaging Industry Revenue (million), by Product Type 2025 & 2033
- Figure 17: Europe MEA Pharmaceutical Packaging Industry Revenue Share (%), by Product Type 2025 & 2033
- Figure 18: Europe MEA Pharmaceutical Packaging Industry Revenue (million), by Country 2025 & 2033
- Figure 19: Europe MEA Pharmaceutical Packaging Industry Revenue Share (%), by Country 2025 & 2033
- Figure 20: Middle East & Africa MEA Pharmaceutical Packaging Industry Revenue (million), by Material Type 2025 & 2033
- Figure 21: Middle East & Africa MEA Pharmaceutical Packaging Industry Revenue Share (%), by Material Type 2025 & 2033
- Figure 22: Middle East & Africa MEA Pharmaceutical Packaging Industry Revenue (million), by Product Type 2025 & 2033
- Figure 23: Middle East & Africa MEA Pharmaceutical Packaging Industry Revenue Share (%), by Product Type 2025 & 2033
- Figure 24: Middle East & Africa MEA Pharmaceutical Packaging Industry Revenue (million), by Country 2025 & 2033
- Figure 25: Middle East & Africa MEA Pharmaceutical Packaging Industry Revenue Share (%), by Country 2025 & 2033
- Figure 26: Asia Pacific MEA Pharmaceutical Packaging Industry Revenue (million), by Material Type 2025 & 2033
- Figure 27: Asia Pacific MEA Pharmaceutical Packaging Industry Revenue Share (%), by Material Type 2025 & 2033
- Figure 28: Asia Pacific MEA Pharmaceutical Packaging Industry Revenue (million), by Product Type 2025 & 2033
- Figure 29: Asia Pacific MEA Pharmaceutical Packaging Industry Revenue Share (%), by Product Type 2025 & 2033
- Figure 30: Asia Pacific MEA Pharmaceutical Packaging Industry Revenue (million), by Country 2025 & 2033
- Figure 31: Asia Pacific MEA Pharmaceutical Packaging Industry Revenue Share (%), by Country 2025 & 2033
List of Tables
- Table 1: Global MEA Pharmaceutical Packaging Industry Revenue million Forecast, by Material Type 2020 & 2033
- Table 2: Global MEA Pharmaceutical Packaging Industry Revenue million Forecast, by Product Type 2020 & 2033
- Table 3: Global MEA Pharmaceutical Packaging Industry Revenue million Forecast, by Region 2020 & 2033
- Table 4: Global MEA Pharmaceutical Packaging Industry Revenue million Forecast, by Material Type 2020 & 2033
- Table 5: Global MEA Pharmaceutical Packaging Industry Revenue million Forecast, by Product Type 2020 & 2033
- Table 6: Global MEA Pharmaceutical Packaging Industry Revenue million Forecast, by Country 2020 & 2033
- Table 7: United States MEA Pharmaceutical Packaging Industry Revenue (million) Forecast, by Application 2020 & 2033
- Table 8: Canada MEA Pharmaceutical Packaging Industry Revenue (million) Forecast, by Application 2020 & 2033
- Table 9: Mexico MEA Pharmaceutical Packaging Industry Revenue (million) Forecast, by Application 2020 & 2033
- Table 10: Global MEA Pharmaceutical Packaging Industry Revenue million Forecast, by Material Type 2020 & 2033
- Table 11: Global MEA Pharmaceutical Packaging Industry Revenue million Forecast, by Product Type 2020 & 2033
- Table 12: Global MEA Pharmaceutical Packaging Industry Revenue million Forecast, by Country 2020 & 2033
- Table 13: Brazil MEA Pharmaceutical Packaging Industry Revenue (million) Forecast, by Application 2020 & 2033
- Table 14: Argentina MEA Pharmaceutical Packaging Industry Revenue (million) Forecast, by Application 2020 & 2033
- Table 15: Rest of South America MEA Pharmaceutical Packaging Industry Revenue (million) Forecast, by Application 2020 & 2033
- Table 16: Global MEA Pharmaceutical Packaging Industry Revenue million Forecast, by Material Type 2020 & 2033
- Table 17: Global MEA Pharmaceutical Packaging Industry Revenue million Forecast, by Product Type 2020 & 2033
- Table 18: Global MEA Pharmaceutical Packaging Industry Revenue million Forecast, by Country 2020 & 2033
- Table 19: United Kingdom MEA Pharmaceutical Packaging Industry Revenue (million) Forecast, by Application 2020 & 2033
- Table 20: Germany MEA Pharmaceutical Packaging Industry Revenue (million) Forecast, by Application 2020 & 2033
- Table 21: France MEA Pharmaceutical Packaging Industry Revenue (million) Forecast, by Application 2020 & 2033
- Table 22: Italy MEA Pharmaceutical Packaging Industry Revenue (million) Forecast, by Application 2020 & 2033
- Table 23: Spain MEA Pharmaceutical Packaging Industry Revenue (million) Forecast, by Application 2020 & 2033
- Table 24: Russia MEA Pharmaceutical Packaging Industry Revenue (million) Forecast, by Application 2020 & 2033
- Table 25: Benelux MEA Pharmaceutical Packaging Industry Revenue (million) Forecast, by Application 2020 & 2033
- Table 26: Nordics MEA Pharmaceutical Packaging Industry Revenue (million) Forecast, by Application 2020 & 2033
- Table 27: Rest of Europe MEA Pharmaceutical Packaging Industry Revenue (million) Forecast, by Application 2020 & 2033
- Table 28: Global MEA Pharmaceutical Packaging Industry Revenue million Forecast, by Material Type 2020 & 2033
- Table 29: Global MEA Pharmaceutical Packaging Industry Revenue million Forecast, by Product Type 2020 & 2033
- Table 30: Global MEA Pharmaceutical Packaging Industry Revenue million Forecast, by Country 2020 & 2033
- Table 31: Turkey MEA Pharmaceutical Packaging Industry Revenue (million) Forecast, by Application 2020 & 2033
- Table 32: Israel MEA Pharmaceutical Packaging Industry Revenue (million) Forecast, by Application 2020 & 2033
- Table 33: GCC MEA Pharmaceutical Packaging Industry Revenue (million) Forecast, by Application 2020 & 2033
- Table 34: North Africa MEA Pharmaceutical Packaging Industry Revenue (million) Forecast, by Application 2020 & 2033
- Table 35: South Africa MEA Pharmaceutical Packaging Industry Revenue (million) Forecast, by Application 2020 & 2033
- Table 36: Rest of Middle East & Africa MEA Pharmaceutical Packaging Industry Revenue (million) Forecast, by Application 2020 & 2033
- Table 37: Global MEA Pharmaceutical Packaging Industry Revenue million Forecast, by Material Type 2020 & 2033
- Table 38: Global MEA Pharmaceutical Packaging Industry Revenue million Forecast, by Product Type 2020 & 2033
- Table 39: Global MEA Pharmaceutical Packaging Industry Revenue million Forecast, by Country 2020 & 2033
- Table 40: China MEA Pharmaceutical Packaging Industry Revenue (million) Forecast, by Application 2020 & 2033
- Table 41: India MEA Pharmaceutical Packaging Industry Revenue (million) Forecast, by Application 2020 & 2033
- Table 42: Japan MEA Pharmaceutical Packaging Industry Revenue (million) Forecast, by Application 2020 & 2033
- Table 43: South Korea MEA Pharmaceutical Packaging Industry Revenue (million) Forecast, by Application 2020 & 2033
- Table 44: ASEAN MEA Pharmaceutical Packaging Industry Revenue (million) Forecast, by Application 2020 & 2033
- Table 45: Oceania MEA Pharmaceutical Packaging Industry Revenue (million) Forecast, by Application 2020 & 2033
- Table 46: Rest of Asia Pacific MEA Pharmaceutical Packaging Industry Revenue (million) Forecast, by Application 2020 & 2033
Frequently Asked Questions
1. What is the projected Compound Annual Growth Rate (CAGR) of the MEA Pharmaceutical Packaging Industry?
The projected CAGR is approximately 9%.
2. Which companies are prominent players in the MEA Pharmaceutical Packaging Industry?
Key companies in the market include Medical Packaging ( S A E), Schott AG, General Plastics Limited, Amcor Worldwide, Saudi Arabia plastic Packaging Systems Co, Rexam PLC, Sealed Air Corporation, Rose Plastics Medical Packagin, Frank NOE Limited, Indevco Group.
3. What are the main segments of the MEA Pharmaceutical Packaging Industry?
The market segments include Material Type, Product Type.
4. Can you provide details about the market size?
The market size is estimated to be USD 3330.2 million as of 2022.
5. What are some drivers contributing to market growth?
Rising Awareness of Environmental Issues and Adoption of New Regulatory Standards; Surging Number of Chronic Disease Cases.
6. What are the notable trends driving market growth?
Bottle Packaging segment to hold biggest operating expense.
7. Are there any restraints impacting market growth?
Fluctuations in Raw Material Cost Due to Suppliers Bargaining Power.
8. Can you provide examples of recent developments in the market?
Feb 2021 - Indevco Plastics has innovated print-grade shrink bundling film for multi-packs that delivers a circular plastics solution. Using 50% post-consumer recycled resin, the collation shrink is fully recyclable. INDEVCO Plastics co-developed the film with Dow, a fellow member of the Alliance to End plastic Waste, for food and beverage manufacturers who bundle products in multi-unit packages.
9. What pricing options are available for accessing the report?
Pricing options include single-user, multi-user, and enterprise licenses priced at USD 4750, USD 5250, and USD 8750 respectively.
10. Is the market size provided in terms of value or volume?
The market size is provided in terms of value, measured in million.
11. Are there any specific market keywords associated with the report?
Yes, the market keyword associated with the report is "MEA Pharmaceutical Packaging Industry," which aids in identifying and referencing the specific market segment covered.
12. How do I determine which pricing option suits my needs best?
The pricing options vary based on user requirements and access needs. Individual users may opt for single-user licenses, while businesses requiring broader access may choose multi-user or enterprise licenses for cost-effective access to the report.
13. Are there any additional resources or data provided in the MEA Pharmaceutical Packaging Industry report?
While the report offers comprehensive insights, it's advisable to review the specific contents or supplementary materials provided to ascertain if additional resources or data are available.
14. How can I stay updated on further developments or reports in the MEA Pharmaceutical Packaging Industry?
To stay informed about further developments, trends, and reports in the MEA Pharmaceutical Packaging Industry, consider subscribing to industry newsletters, following relevant companies and organizations, or regularly checking reputable industry news sources and publications.
Methodology
Step 1 - Identification of Relevant Samples Size from Population Database


Step 2 - Approaches for Defining Global Market Size (Value, Volume* & Price*)

Note*: In applicable scenarios
Step 3 - Data Sources
Primary Research
- Web Analytics
- Survey Reports
- Research Institute
- Latest Research Reports
- Opinion Leaders
Secondary Research
- Annual Reports
- White Paper
- Latest Press Release
- Industry Association
- Paid Database
- Investor Presentations

Step 4 - Data Triangulation
Involves using different sources of information in order to increase the validity of a study
These sources are likely to be stakeholders in a program - participants, other researchers, program staff, other community members, and so on.
Then we put all data in single framework & apply various statistical tools to find out the dynamic on the market.
During the analysis stage, feedback from the stakeholder groups would be compared to determine areas of agreement as well as areas of divergence