

Key Insights
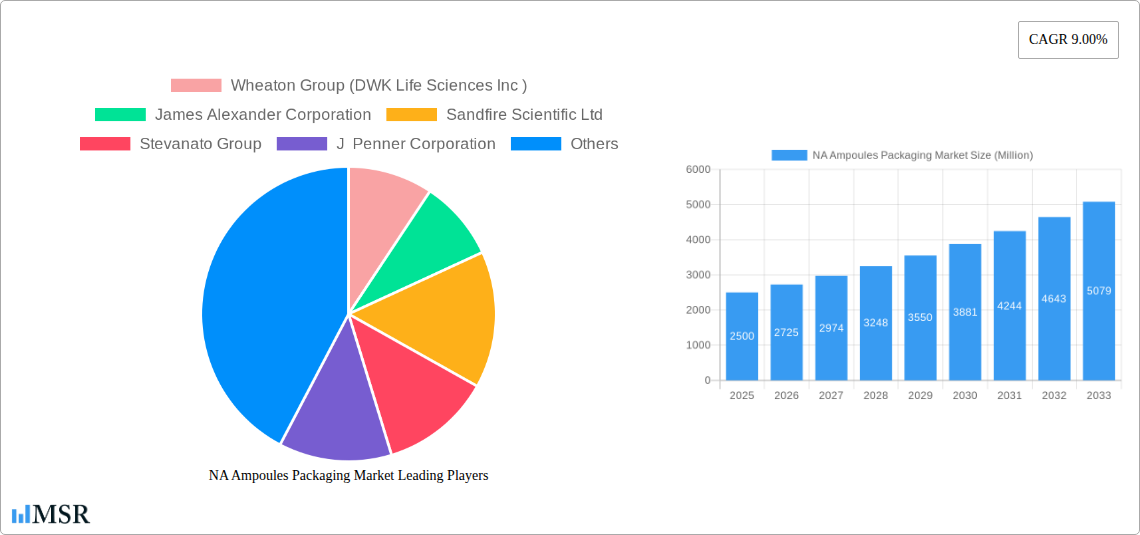
The North American ampoules packaging market, encompassing glass and plastic packaging solutions, is experiencing robust growth, projected to maintain a Compound Annual Growth Rate (CAGR) of 9% from 2025 to 2033. This expansion is driven by several factors. The pharmaceutical industry's increasing reliance on injectable drugs fuels demand for sterile and secure ampoule packaging. Furthermore, technological advancements in materials science are leading to the development of lighter, more durable, and environmentally friendly packaging options. The growing adoption of pre-fillable syringes and the rising prevalence of chronic diseases are also contributing to market growth. Competition within the market is characterized by a mix of established players like Wheaton Group and Schott AG, along with smaller, specialized companies. The United States represents the dominant market segment within North America, owing to its larger pharmaceutical industry and higher healthcare spending. Canada, while a smaller contributor, exhibits steady growth mirroring the overall regional trend. While supply chain disruptions and fluctuating raw material prices pose some challenges, the long-term outlook remains positive, driven by consistent pharmaceutical innovation and expanding healthcare infrastructure.
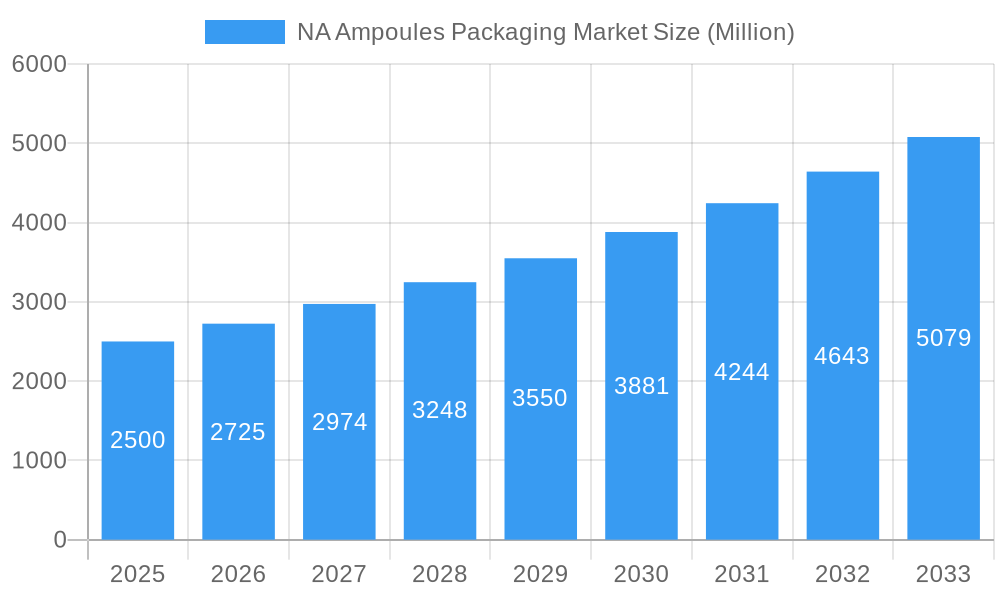
NA Ampoules Packaging Market Market Size (In Billion)
The market segmentation reflects distinct material preferences (glass maintaining a larger share due to its inherent barrier properties for sensitive pharmaceuticals, with plastic gaining traction due to its cost-effectiveness in certain applications) and geographical variations (the US market dominance owing to its robust healthcare system and pharmaceutical manufacturing capabilities). Future growth hinges on continuous innovation in packaging materials and design to improve sterility, reduce waste, and enhance patient safety. The strategic investments in research and development by major players, and a focus on sustainable packaging alternatives, are likely to further shape market dynamics. Regulatory compliance and stringent quality control measures will continue to be critical success factors for companies operating within this segment. The rising demand for convenient and safe drug delivery systems will support continued expansion, reinforcing the positive growth trajectory projected for the coming decade.
NA Ampoules Packaging Market Company Market Share
Unlocking Growth in the North American Ampoules Packaging Market: A Comprehensive Report (2019-2033)
This in-depth report provides a comprehensive analysis of the North American (NA) Ampoules Packaging Market, offering invaluable insights for industry stakeholders, investors, and strategic decision-makers. Covering the period 2019-2033, with a base year of 2025 and a forecast period of 2025-2033, this report delves into market dynamics, trends, leading players, and future growth opportunities. The market is segmented by material (Glass, Plastic) and country (United States, Canada), providing granular data for informed strategic planning. The total market size is predicted to reach xx Million by 2033.
NA Ampoules Packaging Market Market Concentration & Dynamics
The NA Ampoules Packaging Market exhibits a moderately concentrated landscape, with key players holding significant market share. The market share of the top five players is estimated at xx%, indicating a competitive yet consolidated environment. Innovation is driven by ongoing research into sustainable materials, improved sterilization techniques, and enhanced packaging designs to extend shelf life and improve drug delivery. Stringent regulatory frameworks, particularly those related to pharmaceutical packaging and sterility, significantly impact market operations. Substitute products, primarily focusing on alternative packaging materials, pose a moderate threat. End-user trends are shifting towards customized packaging solutions and increased demand for pre-filled syringes and other advanced delivery systems. M&A activities have been relatively moderate in recent years, with approximately xx deals recorded between 2019 and 2024.
- Market Concentration: Moderately concentrated, with top 5 players holding xx% market share.
- Innovation Ecosystem: Focus on sustainable materials, advanced sterilization, and customized packaging.
- Regulatory Framework: Stringent regulations concerning pharmaceutical packaging and sterility.
- Substitute Products: Alternative packaging materials present a moderate threat.
- End-User Trends: Demand for customized solutions and advanced drug delivery systems.
- M&A Activity: Approximately xx deals recorded between 2019 and 2024.
NA Ampoules Packaging Market Industry Insights & Trends
The NA Ampoules Packaging Market is experiencing robust growth, driven by the expanding pharmaceutical and biotechnology sectors. The market size was valued at xx Million in 2025 and is projected to reach xx Million by 2033, exhibiting a Compound Annual Growth Rate (CAGR) of xx% during the forecast period. Technological disruptions, including the adoption of automation and advanced manufacturing technologies, are streamlining production and improving efficiency. Evolving consumer behaviors, including a greater emphasis on convenience and safety, are shaping demand for innovative packaging solutions. Increased demand for injectable medications and biologics, coupled with strict regulatory compliance, drives the market's expansion. Growing prevalence of chronic diseases and increased healthcare spending further contribute to market growth.
Key Markets & Segments Leading NA Ampoules Packaging Market
The United States dominates the NA Ampoules Packaging Market, accounting for approximately xx% of the total market value in 2025. This dominance is attributed to factors including a large pharmaceutical industry, robust healthcare infrastructure, and high levels of research and development investment. Canada represents a significant secondary market, contributing approximately xx%.
United States:
- Growth Drivers: Large pharmaceutical industry, extensive healthcare infrastructure, high R&D investment.
- Market Dominance: High volume of pharmaceutical production and consumption.
Canada:
- Growth Drivers: Growing pharmaceutical sector, rising healthcare expenditure.
- Market Dominance: Smaller but steadily growing market due to increasing healthcare needs.
Material Segmentation:
- Glass: Glass ampoules maintain a significant market share due to their inert properties, ensuring drug stability.
- Plastic: Plastic ampoules are gaining traction due to their cost-effectiveness and lightweight nature, but face challenges related to potential chemical interactions and barrier properties.
NA Ampoules Packaging Market Product Developments
Significant advancements in ampoule packaging include the introduction of barrier coatings to enhance drug stability and prevent degradation. Innovative designs, such as pre-filled ampoules, are simplifying administration and reducing the risk of contamination. The use of sustainable and recyclable materials is gaining momentum, addressing growing environmental concerns. These developments offer competitive advantages, particularly in terms of enhanced drug protection, ease of use, and environmental sustainability.
Challenges in the NA Ampoules Packaging Market Market
The NA Ampoules Packaging Market faces challenges such as stringent regulatory compliance requirements, leading to increased production costs and delays. Supply chain disruptions caused by geopolitical instability and raw material shortages can impact production capacity and delivery timelines. Intense competition among established players and the emergence of new entrants further intensifies the market dynamics. These factors can collectively impact profit margins and market growth.
Forces Driving NA Ampoules Packaging Market Growth
Technological advancements in manufacturing processes and materials are key drivers, enhancing efficiency and product quality. Economic growth, particularly in the healthcare sector, supports increased investment in pharmaceutical production and packaging. Favorable government regulations promoting pharmaceutical innovation and accessibility further stimulate market expansion. Specific examples include the increased adoption of automation and the growing demand for pre-filled syringes.
Challenges in the NA Ampoules Packaging Market Market (Long-Term Growth Catalysts)
Long-term growth is fueled by continuous innovation in packaging materials and designs. Strategic partnerships between packaging companies and pharmaceutical manufacturers drive collaboration and technological advancements. Expansion into emerging markets and diversification of product offerings further contribute to the market's long-term growth potential.
Emerging Opportunities in NA Ampoules Packaging Market
Opportunities exist in developing sustainable and eco-friendly packaging solutions, catering to the growing environmental consciousness. The integration of advanced technologies, such as smart packaging and track-and-trace systems, enhances supply chain security and product authenticity. Expansion into personalized medicine and targeted drug delivery systems presents further opportunities for specialized ampoule packaging solutions.
Leading Players in the NA Ampoules Packaging Market Sector
- Wheaton Group (DWK Life Sciences Inc)
- James Alexander Corporation
- Sandfire Scientific Ltd
- Stevanato Group
- J Penner Corporation
- Syntegon Technology GmbH
- Amposan S
- SCHOTT AG
Key Milestones in NA Ampoules Packaging Market Industry
- 2021 Q3: Schott AG launched a new line of sustainable glass ampoules.
- 2022 Q1: Stevanato Group announced a significant investment in automated ampoule production.
- 2023 Q2: Wheaton Group introduced a new barrier coating technology for enhanced drug stability.
- (Add further milestones as available)
Strategic Outlook for NA Ampoules Packaging Market Market
The NA Ampoules Packaging Market is poised for continued growth, driven by technological innovations, expanding pharmaceutical production, and the increasing demand for injectable drugs. Strategic opportunities exist in developing sustainable solutions, integrating advanced technologies, and expanding into new market segments. Companies focused on innovation, efficiency, and regulatory compliance are well-positioned to capture significant market share in the years to come.
NA Ampoules Packaging Market Segmentation
-
1. Material
- 1.1. Glass
- 1.2. Plastic
NA Ampoules Packaging Market Segmentation By Geography
-
1. North America
- 1.1. United States
- 1.2. Canada
- 1.3. Mexico
-
2. South America
- 2.1. Brazil
- 2.2. Argentina
- 2.3. Rest of South America
-
3. Europe
- 3.1. United Kingdom
- 3.2. Germany
- 3.3. France
- 3.4. Italy
- 3.5. Spain
- 3.6. Russia
- 3.7. Benelux
- 3.8. Nordics
- 3.9. Rest of Europe
-
4. Middle East & Africa
- 4.1. Turkey
- 4.2. Israel
- 4.3. GCC
- 4.4. North Africa
- 4.5. South Africa
- 4.6. Rest of Middle East & Africa
-
5. Asia Pacific
- 5.1. China
- 5.2. India
- 5.3. Japan
- 5.4. South Korea
- 5.5. ASEAN
- 5.6. Oceania
- 5.7. Rest of Asia Pacific
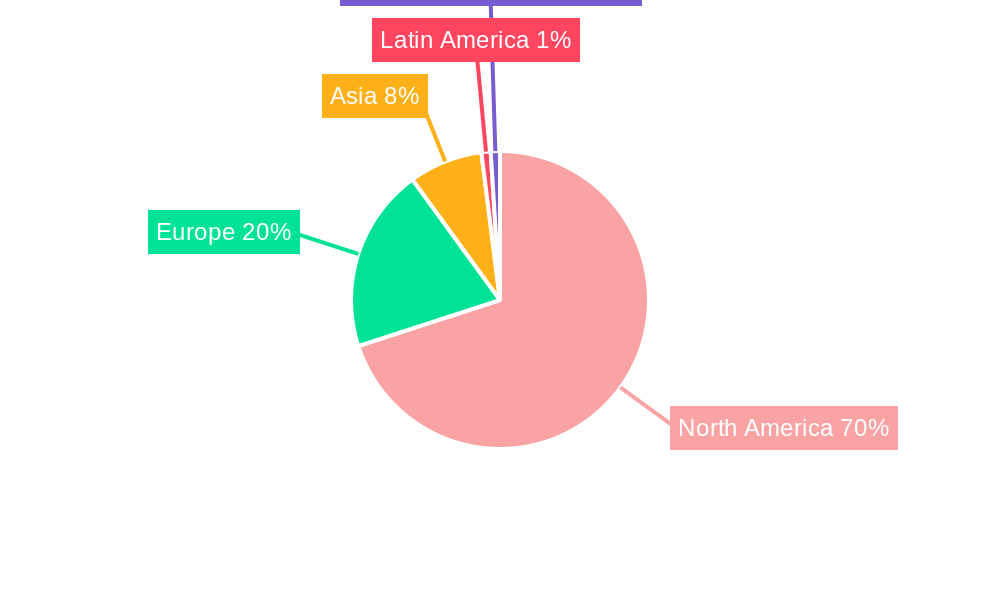
NA Ampoules Packaging Market Regional Market Share
Geographic Coverage of NA Ampoules Packaging Market
NA Ampoules Packaging Market REPORT HIGHLIGHTS
| Aspects | Details |
|---|---|
| Study Period | 2020-2034 |
| Base Year | 2025 |
| Estimated Year | 2026 |
| Forecast Period | 2026-2034 |
| Historical Period | 2020-2025 |
| Growth Rate | CAGR of 9.00% from 2020-2034 |
| Segmentation |
|
Table of Contents
- 1. Introduction
- 1.1. Research Scope
- 1.2. Market Segmentation
- 1.3. Research Objective
- 1.4. Definitions and Assumptions
- 2. Executive Summary
- 2.1. Market Snapshot
- 3. Market Dynamics
- 3.1. Market Drivers
- 3.2. Market Restrains
- 3.3. Market Trends
- 3.4. Market Opportunities
- 4. Market Factor Analysis
- 4.1. Porters Five Forces
- 4.1.1. Bargaining Power of Suppliers
- 4.1.2. Bargaining Power of Buyers
- 4.1.3. Threat of New Entrants
- 4.1.4. Threat of Substitutes
- 4.1.5. Competitive Rivalry
- 4.2. PESTEL analysis
- 4.3. BCG Analysis
- 4.3.1. Stars (High Growth, High Market Share)
- 4.3.2. Cash Cows (Low Growth, High Market Share)
- 4.3.3. Question Mark (High Growth, Low Market Share)
- 4.3.4. Dogs (Low Growth, Low Market Share)
- 4.4. Ansoff Matrix Analysis
- 4.5. Supply Chain Analysis
- 4.6. Regulatory Landscape
- 4.7. Current Market Potential and Opportunity Assessment (TAM–SAM–SOM Framework)
- 4.8. MSR Analyst Note
- 4.1. Porters Five Forces
- 5. Market Analysis, Insights and Forecast 2021-2033
- 5.1. Market Analysis, Insights and Forecast - by Material
- 5.1.1. Glass
- 5.1.2. Plastic
- 5.2. Market Analysis, Insights and Forecast - by Region
- 5.2.1. North America
- 5.2.2. South America
- 5.2.3. Europe
- 5.2.4. Middle East & Africa
- 5.2.5. Asia Pacific
- 5.1. Market Analysis, Insights and Forecast - by Material
- 6. Global NA Ampoules Packaging Market Analysis, Insights and Forecast, 2021-2033
- 6.1. Market Analysis, Insights and Forecast - by Material
- 6.1.1. Glass
- 6.1.2. Plastic
- 6.1. Market Analysis, Insights and Forecast - by Material
- 7. North America NA Ampoules Packaging Market Analysis, Insights and Forecast, 2020-2032
- 7.1. Market Analysis, Insights and Forecast - by Material
- 7.1.1. Glass
- 7.1.2. Plastic
- 7.1. Market Analysis, Insights and Forecast - by Material
- 8. South America NA Ampoules Packaging Market Analysis, Insights and Forecast, 2020-2032
- 8.1. Market Analysis, Insights and Forecast - by Material
- 8.1.1. Glass
- 8.1.2. Plastic
- 8.1. Market Analysis, Insights and Forecast - by Material
- 9. Europe NA Ampoules Packaging Market Analysis, Insights and Forecast, 2020-2032
- 9.1. Market Analysis, Insights and Forecast - by Material
- 9.1.1. Glass
- 9.1.2. Plastic
- 9.1. Market Analysis, Insights and Forecast - by Material
- 10. Middle East & Africa NA Ampoules Packaging Market Analysis, Insights and Forecast, 2020-2032
- 10.1. Market Analysis, Insights and Forecast - by Material
- 10.1.1. Glass
- 10.1.2. Plastic
- 10.1. Market Analysis, Insights and Forecast - by Material
- 11. Asia Pacific NA Ampoules Packaging Market Analysis, Insights and Forecast, 2020-2032
- 11.1. Market Analysis, Insights and Forecast - by Material
- 11.1.1. Glass
- 11.1.2. Plastic
- 11.1. Market Analysis, Insights and Forecast - by Material
- 12. Competitive Analysis
- 12.1. Company Profiles
- 12.1.1 Wheaton Group (DWK Life Sciences Inc )
- 12.1.1.1. Company Overview
- 12.1.1.2. Products
- 12.1.1.3. Company Financials
- 12.1.1.4. SWOT Analysis
- 12.1.2 James Alexander Corporation
- 12.1.2.1. Company Overview
- 12.1.2.2. Products
- 12.1.2.3. Company Financials
- 12.1.2.4. SWOT Analysis
- 12.1.3 Sandfire Scientific Ltd
- 12.1.3.1. Company Overview
- 12.1.3.2. Products
- 12.1.3.3. Company Financials
- 12.1.3.4. SWOT Analysis
- 12.1.4 Stevanato Group
- 12.1.4.1. Company Overview
- 12.1.4.2. Products
- 12.1.4.3. Company Financials
- 12.1.4.4. SWOT Analysis
- 12.1.5 J Penner Corporation
- 12.1.5.1. Company Overview
- 12.1.5.2. Products
- 12.1.5.3. Company Financials
- 12.1.5.4. SWOT Analysis
- 12.1.6 Syntegon Technology GmbH
- 12.1.6.1. Company Overview
- 12.1.6.2. Products
- 12.1.6.3. Company Financials
- 12.1.6.4. SWOT Analysis
- 12.1.7 Amposan S
- 12.1.7.1. Company Overview
- 12.1.7.2. Products
- 12.1.7.3. Company Financials
- 12.1.7.4. SWOT Analysis
- 12.1.8 SCHOTT AG
- 12.1.8.1. Company Overview
- 12.1.8.2. Products
- 12.1.8.3. Company Financials
- 12.1.8.4. SWOT Analysis
- 12.1.1 Wheaton Group (DWK Life Sciences Inc )
- 12.2. Market Entropy
- 12.2.1 Company's Key Areas Served
- 12.2.2 Recent Developments
- 12.3. Company Market Share Analysis 2025
- 12.3.1 Top 5 Companies Market Share Analysis
- 12.3.2 Top 3 Companies Market Share Analysis
- 12.4. List of Potential Customers
- 13. Research Methodology
List of Figures
- Figure 1: Global NA Ampoules Packaging Market Revenue Breakdown (Million, %) by Region 2025 & 2033
- Figure 2: North America NA Ampoules Packaging Market Revenue (Million), by Material 2025 & 2033
- Figure 3: North America NA Ampoules Packaging Market Revenue Share (%), by Material 2025 & 2033
- Figure 4: North America NA Ampoules Packaging Market Revenue (Million), by Country 2025 & 2033
- Figure 5: North America NA Ampoules Packaging Market Revenue Share (%), by Country 2025 & 2033
- Figure 6: South America NA Ampoules Packaging Market Revenue (Million), by Material 2025 & 2033
- Figure 7: South America NA Ampoules Packaging Market Revenue Share (%), by Material 2025 & 2033
- Figure 8: South America NA Ampoules Packaging Market Revenue (Million), by Country 2025 & 2033
- Figure 9: South America NA Ampoules Packaging Market Revenue Share (%), by Country 2025 & 2033
- Figure 10: Europe NA Ampoules Packaging Market Revenue (Million), by Material 2025 & 2033
- Figure 11: Europe NA Ampoules Packaging Market Revenue Share (%), by Material 2025 & 2033
- Figure 12: Europe NA Ampoules Packaging Market Revenue (Million), by Country 2025 & 2033
- Figure 13: Europe NA Ampoules Packaging Market Revenue Share (%), by Country 2025 & 2033
- Figure 14: Middle East & Africa NA Ampoules Packaging Market Revenue (Million), by Material 2025 & 2033
- Figure 15: Middle East & Africa NA Ampoules Packaging Market Revenue Share (%), by Material 2025 & 2033
- Figure 16: Middle East & Africa NA Ampoules Packaging Market Revenue (Million), by Country 2025 & 2033
- Figure 17: Middle East & Africa NA Ampoules Packaging Market Revenue Share (%), by Country 2025 & 2033
- Figure 18: Asia Pacific NA Ampoules Packaging Market Revenue (Million), by Material 2025 & 2033
- Figure 19: Asia Pacific NA Ampoules Packaging Market Revenue Share (%), by Material 2025 & 2033
- Figure 20: Asia Pacific NA Ampoules Packaging Market Revenue (Million), by Country 2025 & 2033
- Figure 21: Asia Pacific NA Ampoules Packaging Market Revenue Share (%), by Country 2025 & 2033
List of Tables
- Table 1: Global NA Ampoules Packaging Market Revenue Million Forecast, by Material 2020 & 2033
- Table 2: Global NA Ampoules Packaging Market Revenue Million Forecast, by Region 2020 & 2033
- Table 3: Global NA Ampoules Packaging Market Revenue Million Forecast, by Material 2020 & 2033
- Table 4: Global NA Ampoules Packaging Market Revenue Million Forecast, by Country 2020 & 2033
- Table 5: United States NA Ampoules Packaging Market Revenue (Million) Forecast, by Application 2020 & 2033
- Table 6: Canada NA Ampoules Packaging Market Revenue (Million) Forecast, by Application 2020 & 2033
- Table 7: Mexico NA Ampoules Packaging Market Revenue (Million) Forecast, by Application 2020 & 2033
- Table 8: Global NA Ampoules Packaging Market Revenue Million Forecast, by Material 2020 & 2033
- Table 9: Global NA Ampoules Packaging Market Revenue Million Forecast, by Country 2020 & 2033
- Table 10: Brazil NA Ampoules Packaging Market Revenue (Million) Forecast, by Application 2020 & 2033
- Table 11: Argentina NA Ampoules Packaging Market Revenue (Million) Forecast, by Application 2020 & 2033
- Table 12: Rest of South America NA Ampoules Packaging Market Revenue (Million) Forecast, by Application 2020 & 2033
- Table 13: Global NA Ampoules Packaging Market Revenue Million Forecast, by Material 2020 & 2033
- Table 14: Global NA Ampoules Packaging Market Revenue Million Forecast, by Country 2020 & 2033
- Table 15: United Kingdom NA Ampoules Packaging Market Revenue (Million) Forecast, by Application 2020 & 2033
- Table 16: Germany NA Ampoules Packaging Market Revenue (Million) Forecast, by Application 2020 & 2033
- Table 17: France NA Ampoules Packaging Market Revenue (Million) Forecast, by Application 2020 & 2033
- Table 18: Italy NA Ampoules Packaging Market Revenue (Million) Forecast, by Application 2020 & 2033
- Table 19: Spain NA Ampoules Packaging Market Revenue (Million) Forecast, by Application 2020 & 2033
- Table 20: Russia NA Ampoules Packaging Market Revenue (Million) Forecast, by Application 2020 & 2033
- Table 21: Benelux NA Ampoules Packaging Market Revenue (Million) Forecast, by Application 2020 & 2033
- Table 22: Nordics NA Ampoules Packaging Market Revenue (Million) Forecast, by Application 2020 & 2033
- Table 23: Rest of Europe NA Ampoules Packaging Market Revenue (Million) Forecast, by Application 2020 & 2033
- Table 24: Global NA Ampoules Packaging Market Revenue Million Forecast, by Material 2020 & 2033
- Table 25: Global NA Ampoules Packaging Market Revenue Million Forecast, by Country 2020 & 2033
- Table 26: Turkey NA Ampoules Packaging Market Revenue (Million) Forecast, by Application 2020 & 2033
- Table 27: Israel NA Ampoules Packaging Market Revenue (Million) Forecast, by Application 2020 & 2033
- Table 28: GCC NA Ampoules Packaging Market Revenue (Million) Forecast, by Application 2020 & 2033
- Table 29: North Africa NA Ampoules Packaging Market Revenue (Million) Forecast, by Application 2020 & 2033
- Table 30: South Africa NA Ampoules Packaging Market Revenue (Million) Forecast, by Application 2020 & 2033
- Table 31: Rest of Middle East & Africa NA Ampoules Packaging Market Revenue (Million) Forecast, by Application 2020 & 2033
- Table 32: Global NA Ampoules Packaging Market Revenue Million Forecast, by Material 2020 & 2033
- Table 33: Global NA Ampoules Packaging Market Revenue Million Forecast, by Country 2020 & 2033
- Table 34: China NA Ampoules Packaging Market Revenue (Million) Forecast, by Application 2020 & 2033
- Table 35: India NA Ampoules Packaging Market Revenue (Million) Forecast, by Application 2020 & 2033
- Table 36: Japan NA Ampoules Packaging Market Revenue (Million) Forecast, by Application 2020 & 2033
- Table 37: South Korea NA Ampoules Packaging Market Revenue (Million) Forecast, by Application 2020 & 2033
- Table 38: ASEAN NA Ampoules Packaging Market Revenue (Million) Forecast, by Application 2020 & 2033
- Table 39: Oceania NA Ampoules Packaging Market Revenue (Million) Forecast, by Application 2020 & 2033
- Table 40: Rest of Asia Pacific NA Ampoules Packaging Market Revenue (Million) Forecast, by Application 2020 & 2033
Frequently Asked Questions
1. What is the projected Compound Annual Growth Rate (CAGR) of the NA Ampoules Packaging Market?
The projected CAGR is approximately 9.00%.
2. Which companies are prominent players in the NA Ampoules Packaging Market?
Key companies in the market include Wheaton Group (DWK Life Sciences Inc ), James Alexander Corporation, Sandfire Scientific Ltd, Stevanato Group, J Penner Corporation, Syntegon Technology GmbH, Amposan S, SCHOTT AG.
3. What are the main segments of the NA Ampoules Packaging Market?
The market segments include Material.
4. Can you provide details about the market size?
The market size is estimated to be USD XX Million as of 2022.
5. What are some drivers contributing to market growth?
; Increasing Demand for Sterile and Tamper-Proof Packaging Solutions for the Pharmaceutical Industry; Stringent Government Regulations and Standards.
6. What are the notable trends driving market growth?
Pharmaceutical Industry Expected to Exhibit the Maximum Number of Adoption.
7. Are there any restraints impacting market growth?
; Concerns Regarding Dumping of Used Ampoules.
8. Can you provide examples of recent developments in the market?
N/A
9. What pricing options are available for accessing the report?
Pricing options include single-user, multi-user, and enterprise licenses priced at USD 4750, USD 4950, and USD 6800 respectively.
10. Is the market size provided in terms of value or volume?
The market size is provided in terms of value, measured in Million.
11. Are there any specific market keywords associated with the report?
Yes, the market keyword associated with the report is "NA Ampoules Packaging Market," which aids in identifying and referencing the specific market segment covered.
12. How do I determine which pricing option suits my needs best?
The pricing options vary based on user requirements and access needs. Individual users may opt for single-user licenses, while businesses requiring broader access may choose multi-user or enterprise licenses for cost-effective access to the report.
13. Are there any additional resources or data provided in the NA Ampoules Packaging Market report?
While the report offers comprehensive insights, it's advisable to review the specific contents or supplementary materials provided to ascertain if additional resources or data are available.
14. How can I stay updated on further developments or reports in the NA Ampoules Packaging Market?
To stay informed about further developments, trends, and reports in the NA Ampoules Packaging Market, consider subscribing to industry newsletters, following relevant companies and organizations, or regularly checking reputable industry news sources and publications.
Methodology
Step 1 - Identification of Relevant Samples Size from Population Database


Step 2 - Approaches for Defining Global Market Size (Value, Volume* & Price*)

Note*: In applicable scenarios
Step 3 - Data Sources
Primary Research
- Web Analytics
- Survey Reports
- Research Institute
- Latest Research Reports
- Opinion Leaders
Secondary Research
- Annual Reports
- White Paper
- Latest Press Release
- Industry Association
- Paid Database
- Investor Presentations

Step 4 - Data Triangulation
Involves using different sources of information in order to increase the validity of a study
These sources are likely to be stakeholders in a program - participants, other researchers, program staff, other community members, and so on.
Then we put all data in single framework & apply various statistical tools to find out the dynamic on the market.
During the analysis stage, feedback from the stakeholder groups would be compared to determine areas of agreement as well as areas of divergence