

Key Insights
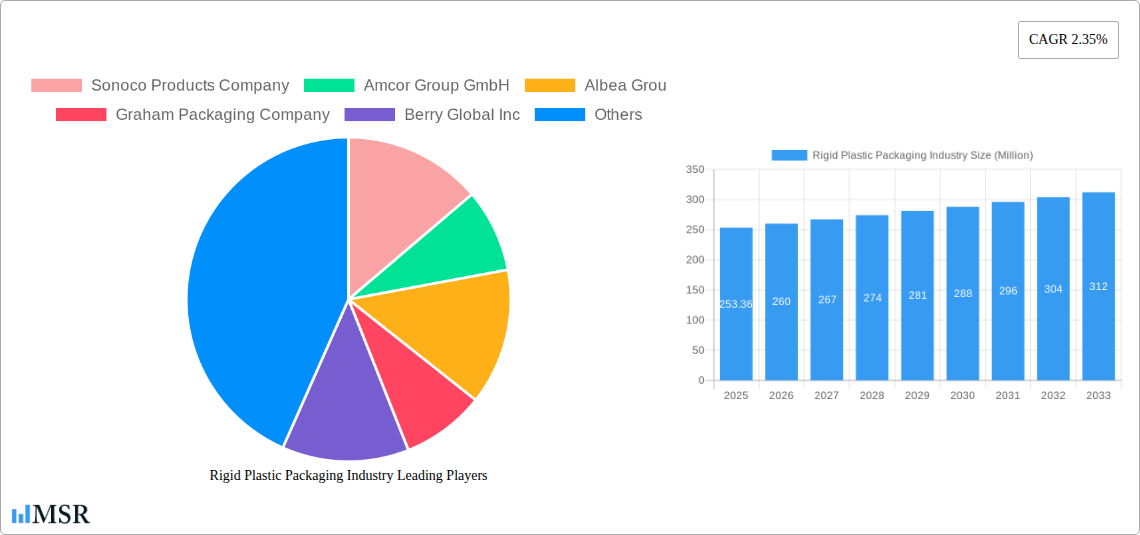
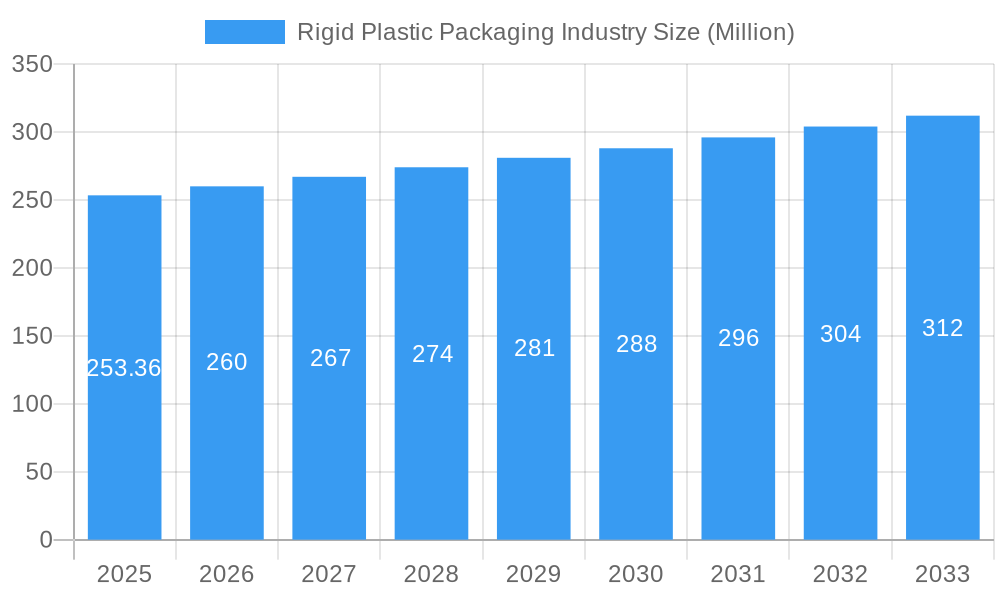
The rigid plastic packaging market, valued at $253.36 million in 2025, is projected to experience steady growth, driven by the increasing demand for convenient and cost-effective packaging solutions across various industries. The compound annual growth rate (CAGR) of 2.35% from 2025 to 2033 indicates a consistent expansion, albeit moderate. Key drivers include the rising consumption of packaged food and beverages, the growth of the e-commerce sector necessitating robust and protective packaging, and advancements in plastic material technology leading to lighter, more sustainable options. The food and beverage sector remains the largest end-user industry, followed by healthcare and cosmetics. Polyethylene (PE) and Polyethylene Terephthalate (PET) dominate the material segment, owing to their versatility, recyclability (to a certain extent), and cost-effectiveness. However, growing environmental concerns regarding plastic waste are a significant restraint, pushing the industry towards sustainable alternatives like bioplastics and improved recycling infrastructure. This trend is further fuelled by stringent government regulations and increasing consumer awareness of environmental issues. The market is segmented by material type (PE, PET, PP, PS, EPS, PVC, and others), end-user industry (food & beverage, healthcare, cosmetics, industrial, building & construction, automotive, and others), and product type (bottles & jars, trays & containers, caps & closures, and others). Competition is intense, with major players like Sonoco Products Company, Amcor, and Berry Global continuously innovating and expanding their product portfolios to cater to evolving market demands. Regional growth will be influenced by factors such as economic development, infrastructure, and regulatory frameworks. Regions like Asia-Pacific are expected to demonstrate faster growth compared to mature markets like North America and Europe due to increasing disposable incomes and rising consumption in developing economies.
Rigid Plastic Packaging Industry Market Size (In Million)
The forecast period (2025-2033) anticipates a gradual yet consistent expansion of the rigid plastic packaging market. While the moderate CAGR reflects the challenges posed by sustainability concerns, the market's fundamental strength lies in its indispensable role in various sectors. Ongoing innovations in material science, focusing on biodegradability and improved recyclability, will play a crucial role in shaping the market's trajectory. Furthermore, strategic partnerships and mergers & acquisitions are expected to reshape the competitive landscape, fostering consolidation and innovation within the industry. The success of individual companies will depend on their ability to adapt to evolving consumer preferences, regulatory changes, and the growing emphasis on eco-friendly packaging solutions. The continued growth in e-commerce and the expansion of developing economies will continue to present significant opportunities for market expansion in the long term.
Rigid Plastic Packaging Industry Company Market Share
Rigid Plastic Packaging Industry Market Report: 2019-2033
This comprehensive report provides an in-depth analysis of the global rigid plastic packaging industry, covering market size, growth drivers, key segments, leading players, and future trends. With a study period spanning 2019-2033, a base year of 2025, and a forecast period of 2025-2033, this report offers invaluable insights for industry stakeholders, investors, and strategic decision-makers. The report's findings are supported by extensive research and data analysis, encompassing key developments and trends shaping the industry's trajectory. Expect detailed breakdowns by material (PE, PET, PP, PS, EPS, PVC, Others), end-user industry (Food & Beverage, Healthcare, Cosmetics, Industrial, Building & Construction, Automotive, Others), and product type (Bottles & Jars, Trays & Containers, Caps & Closures, Others).
Rigid Plastic Packaging Industry Market Concentration & Dynamics
The global rigid plastic packaging market is characterized by a moderately concentrated landscape, with several major players holding significant market share. The top ten companies, including Sonoco Products Company, Amcor Group GmbH, Albea Group, Graham Packaging Company, Berry Global Inc, Silgan Holdings Inc, Plastipak Holding Inc, Sealed Air Corporation, Alpla Werke Alwin Lehner GmbH & Co KG, and Huhtamaki Inc, collectively account for an estimated xx% of the global market in 2025. Market share fluctuates based on M&A activity, product innovation, and regional expansion strategies.
- Market Concentration: The Herfindahl-Hirschman Index (HHI) for the industry is estimated at xx in 2025, indicating a moderately consolidated market.
- Innovation Ecosystems: Significant investments are made in R&D, particularly focusing on sustainable and recyclable materials, lightweighting technologies, and improved barrier properties. Collaboration between packaging companies and raw material suppliers drives innovation.
- Regulatory Frameworks: Increasingly stringent regulations regarding plastic waste management and recyclability are reshaping the industry landscape. Regulations vary across regions, influencing material choices and packaging designs.
- Substitute Products: Growth in alternative packaging materials, such as paperboard and biodegradable plastics, presents a challenge to the dominance of rigid plastic packaging. However, the cost-effectiveness and performance advantages of rigid plastic packaging remain crucial factors.
- End-User Trends: Growing demand for convenience and on-the-go consumption fuels the demand for rigid plastic packaging in various sectors. However, changing consumer preferences toward sustainability are driving a shift towards eco-friendly options.
- M&A Activities: The industry has witnessed a considerable number of mergers and acquisitions (M&As) in recent years, driven by efforts to expand market share, diversify product portfolios, and gain access to new technologies. The estimated number of M&A deals in the period 2019-2024 was xx.
Rigid Plastic Packaging Industry Insights & Trends
The global rigid plastic packaging market is experiencing robust growth, driven by a multitude of factors. The market size reached an estimated USD xx Million in 2024 and is projected to reach USD xx Million by 2033, exhibiting a compound annual growth rate (CAGR) of xx% during the forecast period. This growth is fueled by several key trends:
The increasing demand for packaged goods across various sectors, particularly in developing economies, is a significant growth driver. Technological advancements in plastics manufacturing are leading to the production of lighter, stronger, and more sustainable packaging options. Evolving consumer preferences, with a greater focus on convenience and product safety, continue to favor rigid plastic packaging. However, the industry is experiencing disruptions related to concerns about environmental sustainability and the increasing focus on recycling and waste reduction. These factors are pushing innovation toward more sustainable and eco-friendly materials and production processes. Further challenges arise from fluctuating raw material prices, especially for petroleum-based plastics, impacting manufacturing costs and profitability.
Key Markets & Segments Leading Rigid Plastic Packaging Industry
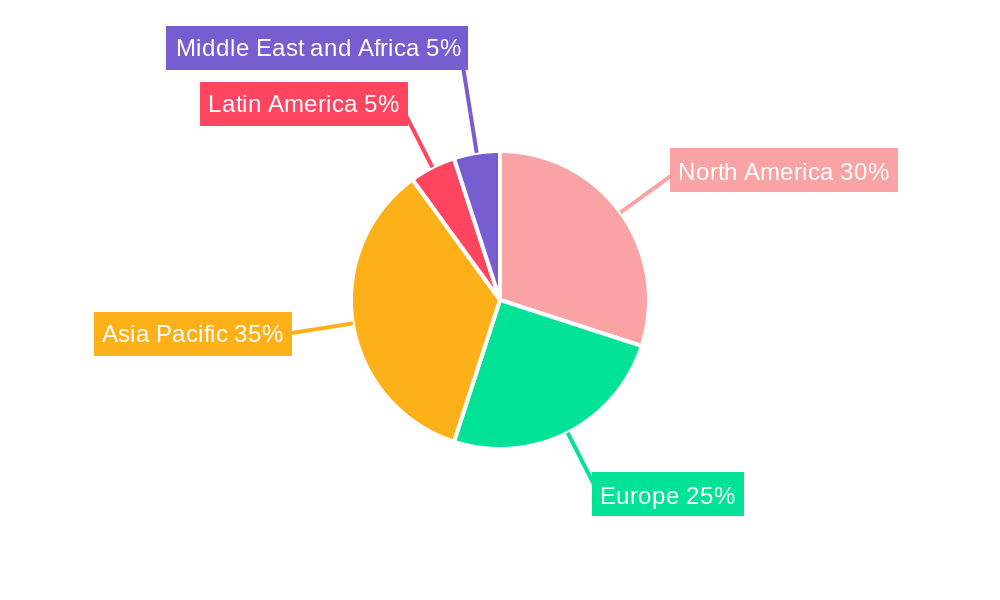
The rigid plastic packaging market displays significant regional variations in growth and segment dominance. While Asia-Pacific dominates in terms of market volume due to its rapidly expanding consumer base and manufacturing activities, North America and Europe maintain higher per capita consumption and a strong presence of major industry players.
- By Material: Polyethylene (PE) and Polyethylene Terephthalate (PET) represent the largest segments by material, owing to their versatility, cost-effectiveness, and recyclability. However, growth in other segments, such as polypropylene (PP) and other sustainable alternatives, is gaining traction.
- By End-user Industry: The food and beverage sector remains the largest consumer of rigid plastic packaging, followed by the healthcare and cosmetics and personal care industries. Growth in the food and beverage industry is closely tied to the rise of packaged food products, convenience, and e-commerce.
- By Product: Bottles and jars constitute the most significant product segment, followed by trays and containers. Caps and closures are an integral part of the packaging ecosystem and maintain steady demand.
Drivers for Key Segments:
- Economic Growth: Rising disposable incomes in developing countries are driving increased consumption of packaged goods.
- Infrastructure Development: Investments in retail infrastructure and supply chain networks facilitate the growth of packaged goods.
- Technological Advancements: Innovations in material science and manufacturing processes continue to enhance the quality and sustainability of rigid plastic packaging.
Rigid Plastic Packaging Industry Product Developments
Recent years have seen a significant push towards more sustainable and innovative rigid plastic packaging solutions. This includes the development of lightweight designs to reduce material usage, the incorporation of recycled content (rPET, PCR), and the exploration of bio-based plastics. Companies are increasingly focusing on improved barrier properties to extend shelf life and reduce food waste. Technological advancements like advanced printing techniques and improved recyclability are integral to the product development strategies of leading players.
Challenges in the Rigid Plastic Packaging Industry Market
The rigid plastic packaging industry faces several significant challenges, including the growing pressure to reduce plastic waste, increasing environmental regulations, and fluctuations in raw material prices, leading to increased manufacturing costs. Supply chain disruptions can also impact production and delivery timelines, resulting in xx Million USD loss in revenue in 2024. Intense competition among established players and the emergence of new entrants add to the complexities.
Forces Driving Rigid Plastic Packaging Industry Growth
Key growth drivers include the increasing demand for packaged goods, the rise of e-commerce, and technological advancements in packaging materials and manufacturing processes. Growing consumer preference for convenience and product safety further bolster industry growth. Favorable regulatory environments in certain regions and continued innovation in sustainable packaging options contribute to market expansion.
Long-Term Growth Catalysts in the Rigid Plastic Packaging Industry
Long-term growth will be fueled by ongoing innovations in sustainable materials, partnerships between packaging manufacturers and brand owners, and the expansion into new and emerging markets. Investment in advanced recycling technologies and the development of closed-loop recycling systems will be critical for long-term sustainability and market growth.
Emerging Opportunities in Rigid Plastic Packaging Industry
Emerging opportunities lie in the development of biodegradable and compostable rigid plastic alternatives, the expansion into high-growth markets, and the growing demand for customized packaging solutions. The increased focus on circular economy principles and the development of innovative recycling technologies present substantial opportunities for growth.
Leading Players in the Rigid Plastic Packaging Industry Sector
- Sonoco Products Company
- Amcor Group GmbH
- Albea Group
- Graham Packaging Company
- Berry Global Inc
- Silgan Holdings Inc
- Plastipak Holding Inc
- Sealed Air Corporation
- Alpla Werke Alwin Lehner GmbH & Co KG
- Huhtamaki Inc
Key Milestones in Rigid Plastic Packaging Industry
- July 2023: PepsiCo India launches India's first 100% recycled (rPET) bottles for Pepsi Black, highlighting a significant step towards sustainable packaging.
- September 2022: Ingreendients partners with Berry Global to create 100% PCR plastic bottles for haircare products, showcasing the growing adoption of recycled materials.
- September 2022: Sonoco acquires Skjern, expanding its European operations and capacity for sustainable paper and packaging products. This acquisition demonstrates a strategic move towards sustainable solutions and market expansion.
Strategic Outlook for Rigid Plastic Packaging Industry Market
The future of the rigid plastic packaging market is bright, driven by continued innovation in sustainable packaging materials, advancements in recycling technologies, and the increasing demand for eco-friendly solutions. Strategic partnerships and collaborations will play a crucial role in driving growth and fostering sustainability within the industry. The market will likely see a shift toward more circular economy models, with increased focus on reuse, recycling, and the development of bio-based alternatives. This will lead to significant growth opportunities for companies that can adapt to these changing market dynamics.
Rigid Plastic Packaging Industry Segmentation
-
1. Product
- 1.1. Bottles and Jars
- 1.2. Trays and Containers
- 1.3. Caps and Closures
- 1.4. Other Pr
-
2. Material
- 2.1. Polyethylene (PE)
- 2.2. Polyethylene Terephthalate (PET)
- 2.3. Polypropylene (PP)
- 2.4. Polystyrene (PS) and Expanded Polystyrene (EPS)
- 2.5. Polyvinyl Chloride (PVC)
- 2.6. Other Rigid Plastic Packaging Materials
-
3. End-user Industry
- 3.1. Food and Beverage
- 3.2. Healthcare
- 3.3. Cosmetics and Personal Care
- 3.4. Industrial
- 3.5. Building and Construction
- 3.6. Automotive
- 3.7. Other En
Rigid Plastic Packaging Industry Segmentation By Geography
-
1. North America
- 1.1. United States
- 1.2. Canada
-
2. Europe
- 2.1. United Kingdom
- 2.2. Germany
- 2.3. France
- 2.4. Italy
- 2.5. Rest of Europe
-
3. Asia Pacific
- 3.1. China
- 3.2. India
- 3.3. Japan
- 3.4. Australia
- 3.5. South Korea
- 3.6. Rest of Asia Pacific
-
4. Latin America
- 4.1. Brazil
- 4.2. Argentina
- 4.3. Mexico
- 4.4. Rest of Latin America
-
5. Middle East and Africa
- 5.1. United Arab Emirates
- 5.2. Saudi Arabia
- 5.3. South Africa
- 5.4. Rest of Middle East and Africa
Rigid Plastic Packaging Industry Regional Market Share
Geographic Coverage of Rigid Plastic Packaging Industry
Rigid Plastic Packaging Industry REPORT HIGHLIGHTS
| Aspects | Details |
|---|---|
| Study Period | 2020-2034 |
| Base Year | 2025 |
| Estimated Year | 2026 |
| Forecast Period | 2026-2034 |
| Historical Period | 2020-2025 |
| Growth Rate | CAGR of 2.35% from 2020-2034 |
| Segmentation |
|
Table of Contents
- 1. Introduction
- 1.1. Research Scope
- 1.2. Market Segmentation
- 1.3. Research Objective
- 1.4. Definitions and Assumptions
- 2. Executive Summary
- 2.1. Market Snapshot
- 3. Market Dynamics
- 3.1. Market Drivers
- 3.2. Market Restrains
- 3.3. Market Trends
- 3.4. Market Opportunities
- 4. Market Factor Analysis
- 4.1. Porters Five Forces
- 4.1.1. Bargaining Power of Suppliers
- 4.1.2. Bargaining Power of Buyers
- 4.1.3. Threat of New Entrants
- 4.1.4. Threat of Substitutes
- 4.1.5. Competitive Rivalry
- 4.2. PESTEL analysis
- 4.3. BCG Analysis
- 4.3.1. Stars (High Growth, High Market Share)
- 4.3.2. Cash Cows (Low Growth, High Market Share)
- 4.3.3. Question Mark (High Growth, Low Market Share)
- 4.3.4. Dogs (Low Growth, Low Market Share)
- 4.4. Ansoff Matrix Analysis
- 4.5. Supply Chain Analysis
- 4.6. Regulatory Landscape
- 4.7. Current Market Potential and Opportunity Assessment (TAM–SAM–SOM Framework)
- 4.8. MSR Analyst Note
- 4.1. Porters Five Forces
- 5. Market Analysis, Insights and Forecast 2021-2033
- 5.1. Market Analysis, Insights and Forecast - by Product
- 5.1.1. Bottles and Jars
- 5.1.2. Trays and Containers
- 5.1.3. Caps and Closures
- 5.1.4. Other Pr
- 5.2. Market Analysis, Insights and Forecast - by Material
- 5.2.1. Polyethylene (PE)
- 5.2.2. Polyethylene Terephthalate (PET)
- 5.2.3. Polypropylene (PP)
- 5.2.4. Polystyrene (PS) and Expanded Polystyrene (EPS)
- 5.2.5. Polyvinyl Chloride (PVC)
- 5.2.6. Other Rigid Plastic Packaging Materials
- 5.3. Market Analysis, Insights and Forecast - by End-user Industry
- 5.3.1. Food and Beverage
- 5.3.2. Healthcare
- 5.3.3. Cosmetics and Personal Care
- 5.3.4. Industrial
- 5.3.5. Building and Construction
- 5.3.6. Automotive
- 5.3.7. Other En
- 5.4. Market Analysis, Insights and Forecast - by Region
- 5.4.1. North America
- 5.4.2. Europe
- 5.4.3. Asia Pacific
- 5.4.4. Latin America
- 5.4.5. Middle East and Africa
- 5.1. Market Analysis, Insights and Forecast - by Product
- 6. Global Rigid Plastic Packaging Industry Analysis, Insights and Forecast, 2021-2033
- 6.1. Market Analysis, Insights and Forecast - by Product
- 6.1.1. Bottles and Jars
- 6.1.2. Trays and Containers
- 6.1.3. Caps and Closures
- 6.1.4. Other Pr
- 6.2. Market Analysis, Insights and Forecast - by Material
- 6.2.1. Polyethylene (PE)
- 6.2.2. Polyethylene Terephthalate (PET)
- 6.2.3. Polypropylene (PP)
- 6.2.4. Polystyrene (PS) and Expanded Polystyrene (EPS)
- 6.2.5. Polyvinyl Chloride (PVC)
- 6.2.6. Other Rigid Plastic Packaging Materials
- 6.3. Market Analysis, Insights and Forecast - by End-user Industry
- 6.3.1. Food and Beverage
- 6.3.2. Healthcare
- 6.3.3. Cosmetics and Personal Care
- 6.3.4. Industrial
- 6.3.5. Building and Construction
- 6.3.6. Automotive
- 6.3.7. Other En
- 6.1. Market Analysis, Insights and Forecast - by Product
- 7. North America Rigid Plastic Packaging Industry Analysis, Insights and Forecast, 2020-2032
- 7.1. Market Analysis, Insights and Forecast - by Product
- 7.1.1. Bottles and Jars
- 7.1.2. Trays and Containers
- 7.1.3. Caps and Closures
- 7.1.4. Other Pr
- 7.2. Market Analysis, Insights and Forecast - by Material
- 7.2.1. Polyethylene (PE)
- 7.2.2. Polyethylene Terephthalate (PET)
- 7.2.3. Polypropylene (PP)
- 7.2.4. Polystyrene (PS) and Expanded Polystyrene (EPS)
- 7.2.5. Polyvinyl Chloride (PVC)
- 7.2.6. Other Rigid Plastic Packaging Materials
- 7.3. Market Analysis, Insights and Forecast - by End-user Industry
- 7.3.1. Food and Beverage
- 7.3.2. Healthcare
- 7.3.3. Cosmetics and Personal Care
- 7.3.4. Industrial
- 7.3.5. Building and Construction
- 7.3.6. Automotive
- 7.3.7. Other En
- 7.1. Market Analysis, Insights and Forecast - by Product
- 8. Europe Rigid Plastic Packaging Industry Analysis, Insights and Forecast, 2020-2032
- 8.1. Market Analysis, Insights and Forecast - by Product
- 8.1.1. Bottles and Jars
- 8.1.2. Trays and Containers
- 8.1.3. Caps and Closures
- 8.1.4. Other Pr
- 8.2. Market Analysis, Insights and Forecast - by Material
- 8.2.1. Polyethylene (PE)
- 8.2.2. Polyethylene Terephthalate (PET)
- 8.2.3. Polypropylene (PP)
- 8.2.4. Polystyrene (PS) and Expanded Polystyrene (EPS)
- 8.2.5. Polyvinyl Chloride (PVC)
- 8.2.6. Other Rigid Plastic Packaging Materials
- 8.3. Market Analysis, Insights and Forecast - by End-user Industry
- 8.3.1. Food and Beverage
- 8.3.2. Healthcare
- 8.3.3. Cosmetics and Personal Care
- 8.3.4. Industrial
- 8.3.5. Building and Construction
- 8.3.6. Automotive
- 8.3.7. Other En
- 8.1. Market Analysis, Insights and Forecast - by Product
- 9. Asia Pacific Rigid Plastic Packaging Industry Analysis, Insights and Forecast, 2020-2032
- 9.1. Market Analysis, Insights and Forecast - by Product
- 9.1.1. Bottles and Jars
- 9.1.2. Trays and Containers
- 9.1.3. Caps and Closures
- 9.1.4. Other Pr
- 9.2. Market Analysis, Insights and Forecast - by Material
- 9.2.1. Polyethylene (PE)
- 9.2.2. Polyethylene Terephthalate (PET)
- 9.2.3. Polypropylene (PP)
- 9.2.4. Polystyrene (PS) and Expanded Polystyrene (EPS)
- 9.2.5. Polyvinyl Chloride (PVC)
- 9.2.6. Other Rigid Plastic Packaging Materials
- 9.3. Market Analysis, Insights and Forecast - by End-user Industry
- 9.3.1. Food and Beverage
- 9.3.2. Healthcare
- 9.3.3. Cosmetics and Personal Care
- 9.3.4. Industrial
- 9.3.5. Building and Construction
- 9.3.6. Automotive
- 9.3.7. Other En
- 9.1. Market Analysis, Insights and Forecast - by Product
- 10. Latin America Rigid Plastic Packaging Industry Analysis, Insights and Forecast, 2020-2032
- 10.1. Market Analysis, Insights and Forecast - by Product
- 10.1.1. Bottles and Jars
- 10.1.2. Trays and Containers
- 10.1.3. Caps and Closures
- 10.1.4. Other Pr
- 10.2. Market Analysis, Insights and Forecast - by Material
- 10.2.1. Polyethylene (PE)
- 10.2.2. Polyethylene Terephthalate (PET)
- 10.2.3. Polypropylene (PP)
- 10.2.4. Polystyrene (PS) and Expanded Polystyrene (EPS)
- 10.2.5. Polyvinyl Chloride (PVC)
- 10.2.6. Other Rigid Plastic Packaging Materials
- 10.3. Market Analysis, Insights and Forecast - by End-user Industry
- 10.3.1. Food and Beverage
- 10.3.2. Healthcare
- 10.3.3. Cosmetics and Personal Care
- 10.3.4. Industrial
- 10.3.5. Building and Construction
- 10.3.6. Automotive
- 10.3.7. Other En
- 10.1. Market Analysis, Insights and Forecast - by Product
- 11. Middle East and Africa Rigid Plastic Packaging Industry Analysis, Insights and Forecast, 2020-2032
- 11.1. Market Analysis, Insights and Forecast - by Product
- 11.1.1. Bottles and Jars
- 11.1.2. Trays and Containers
- 11.1.3. Caps and Closures
- 11.1.4. Other Pr
- 11.2. Market Analysis, Insights and Forecast - by Material
- 11.2.1. Polyethylene (PE)
- 11.2.2. Polyethylene Terephthalate (PET)
- 11.2.3. Polypropylene (PP)
- 11.2.4. Polystyrene (PS) and Expanded Polystyrene (EPS)
- 11.2.5. Polyvinyl Chloride (PVC)
- 11.2.6. Other Rigid Plastic Packaging Materials
- 11.3. Market Analysis, Insights and Forecast - by End-user Industry
- 11.3.1. Food and Beverage
- 11.3.2. Healthcare
- 11.3.3. Cosmetics and Personal Care
- 11.3.4. Industrial
- 11.3.5. Building and Construction
- 11.3.6. Automotive
- 11.3.7. Other En
- 11.1. Market Analysis, Insights and Forecast - by Product
- 12. Competitive Analysis
- 12.1. Company Profiles
- 12.1.1 Sonoco Products Company
- 12.1.1.1. Company Overview
- 12.1.1.2. Products
- 12.1.1.3. Company Financials
- 12.1.1.4. SWOT Analysis
- 12.1.2 Amcor Group GmbH
- 12.1.2.1. Company Overview
- 12.1.2.2. Products
- 12.1.2.3. Company Financials
- 12.1.2.4. SWOT Analysis
- 12.1.3 Albea Grou
- 12.1.3.1. Company Overview
- 12.1.3.2. Products
- 12.1.3.3. Company Financials
- 12.1.3.4. SWOT Analysis
- 12.1.4 Graham Packaging Company
- 12.1.4.1. Company Overview
- 12.1.4.2. Products
- 12.1.4.3. Company Financials
- 12.1.4.4. SWOT Analysis
- 12.1.5 Berry Global Inc
- 12.1.5.1. Company Overview
- 12.1.5.2. Products
- 12.1.5.3. Company Financials
- 12.1.5.4. SWOT Analysis
- 12.1.6 Silgan Holdings Inc
- 12.1.6.1. Company Overview
- 12.1.6.2. Products
- 12.1.6.3. Company Financials
- 12.1.6.4. SWOT Analysis
- 12.1.7 Plastipak Holding Inc
- 12.1.7.1. Company Overview
- 12.1.7.2. Products
- 12.1.7.3. Company Financials
- 12.1.7.4. SWOT Analysis
- 12.1.8 Sealed Air Corporation
- 12.1.8.1. Company Overview
- 12.1.8.2. Products
- 12.1.8.3. Company Financials
- 12.1.8.4. SWOT Analysis
- 12.1.9 Alpla Werke Alwin Lehner GmbH & Co KG
- 12.1.9.1. Company Overview
- 12.1.9.2. Products
- 12.1.9.3. Company Financials
- 12.1.9.4. SWOT Analysis
- 12.1.10 Huhtamaki Inc
- 12.1.10.1. Company Overview
- 12.1.10.2. Products
- 12.1.10.3. Company Financials
- 12.1.10.4. SWOT Analysis
- 12.1.1 Sonoco Products Company
- 12.2. Market Entropy
- 12.2.1 Company's Key Areas Served
- 12.2.2 Recent Developments
- 12.3. Company Market Share Analysis 2025
- 12.3.1 Top 5 Companies Market Share Analysis
- 12.3.2 Top 3 Companies Market Share Analysis
- 12.4. List of Potential Customers
- 13. Research Methodology
List of Figures
- Figure 1: Global Rigid Plastic Packaging Industry Revenue Breakdown (Million, %) by Region 2025 & 2033
- Figure 2: North America Rigid Plastic Packaging Industry Revenue (Million), by Product 2025 & 2033
- Figure 3: North America Rigid Plastic Packaging Industry Revenue Share (%), by Product 2025 & 2033
- Figure 4: North America Rigid Plastic Packaging Industry Revenue (Million), by Material 2025 & 2033
- Figure 5: North America Rigid Plastic Packaging Industry Revenue Share (%), by Material 2025 & 2033
- Figure 6: North America Rigid Plastic Packaging Industry Revenue (Million), by End-user Industry 2025 & 2033
- Figure 7: North America Rigid Plastic Packaging Industry Revenue Share (%), by End-user Industry 2025 & 2033
- Figure 8: North America Rigid Plastic Packaging Industry Revenue (Million), by Country 2025 & 2033
- Figure 9: North America Rigid Plastic Packaging Industry Revenue Share (%), by Country 2025 & 2033
- Figure 10: Europe Rigid Plastic Packaging Industry Revenue (Million), by Product 2025 & 2033
- Figure 11: Europe Rigid Plastic Packaging Industry Revenue Share (%), by Product 2025 & 2033
- Figure 12: Europe Rigid Plastic Packaging Industry Revenue (Million), by Material 2025 & 2033
- Figure 13: Europe Rigid Plastic Packaging Industry Revenue Share (%), by Material 2025 & 2033
- Figure 14: Europe Rigid Plastic Packaging Industry Revenue (Million), by End-user Industry 2025 & 2033
- Figure 15: Europe Rigid Plastic Packaging Industry Revenue Share (%), by End-user Industry 2025 & 2033
- Figure 16: Europe Rigid Plastic Packaging Industry Revenue (Million), by Country 2025 & 2033
- Figure 17: Europe Rigid Plastic Packaging Industry Revenue Share (%), by Country 2025 & 2033
- Figure 18: Asia Pacific Rigid Plastic Packaging Industry Revenue (Million), by Product 2025 & 2033
- Figure 19: Asia Pacific Rigid Plastic Packaging Industry Revenue Share (%), by Product 2025 & 2033
- Figure 20: Asia Pacific Rigid Plastic Packaging Industry Revenue (Million), by Material 2025 & 2033
- Figure 21: Asia Pacific Rigid Plastic Packaging Industry Revenue Share (%), by Material 2025 & 2033
- Figure 22: Asia Pacific Rigid Plastic Packaging Industry Revenue (Million), by End-user Industry 2025 & 2033
- Figure 23: Asia Pacific Rigid Plastic Packaging Industry Revenue Share (%), by End-user Industry 2025 & 2033
- Figure 24: Asia Pacific Rigid Plastic Packaging Industry Revenue (Million), by Country 2025 & 2033
- Figure 25: Asia Pacific Rigid Plastic Packaging Industry Revenue Share (%), by Country 2025 & 2033
- Figure 26: Latin America Rigid Plastic Packaging Industry Revenue (Million), by Product 2025 & 2033
- Figure 27: Latin America Rigid Plastic Packaging Industry Revenue Share (%), by Product 2025 & 2033
- Figure 28: Latin America Rigid Plastic Packaging Industry Revenue (Million), by Material 2025 & 2033
- Figure 29: Latin America Rigid Plastic Packaging Industry Revenue Share (%), by Material 2025 & 2033
- Figure 30: Latin America Rigid Plastic Packaging Industry Revenue (Million), by End-user Industry 2025 & 2033
- Figure 31: Latin America Rigid Plastic Packaging Industry Revenue Share (%), by End-user Industry 2025 & 2033
- Figure 32: Latin America Rigid Plastic Packaging Industry Revenue (Million), by Country 2025 & 2033
- Figure 33: Latin America Rigid Plastic Packaging Industry Revenue Share (%), by Country 2025 & 2033
- Figure 34: Middle East and Africa Rigid Plastic Packaging Industry Revenue (Million), by Product 2025 & 2033
- Figure 35: Middle East and Africa Rigid Plastic Packaging Industry Revenue Share (%), by Product 2025 & 2033
- Figure 36: Middle East and Africa Rigid Plastic Packaging Industry Revenue (Million), by Material 2025 & 2033
- Figure 37: Middle East and Africa Rigid Plastic Packaging Industry Revenue Share (%), by Material 2025 & 2033
- Figure 38: Middle East and Africa Rigid Plastic Packaging Industry Revenue (Million), by End-user Industry 2025 & 2033
- Figure 39: Middle East and Africa Rigid Plastic Packaging Industry Revenue Share (%), by End-user Industry 2025 & 2033
- Figure 40: Middle East and Africa Rigid Plastic Packaging Industry Revenue (Million), by Country 2025 & 2033
- Figure 41: Middle East and Africa Rigid Plastic Packaging Industry Revenue Share (%), by Country 2025 & 2033
List of Tables
- Table 1: Global Rigid Plastic Packaging Industry Revenue Million Forecast, by Product 2020 & 2033
- Table 2: Global Rigid Plastic Packaging Industry Revenue Million Forecast, by Material 2020 & 2033
- Table 3: Global Rigid Plastic Packaging Industry Revenue Million Forecast, by End-user Industry 2020 & 2033
- Table 4: Global Rigid Plastic Packaging Industry Revenue Million Forecast, by Region 2020 & 2033
- Table 5: Global Rigid Plastic Packaging Industry Revenue Million Forecast, by Product 2020 & 2033
- Table 6: Global Rigid Plastic Packaging Industry Revenue Million Forecast, by Material 2020 & 2033
- Table 7: Global Rigid Plastic Packaging Industry Revenue Million Forecast, by End-user Industry 2020 & 2033
- Table 8: Global Rigid Plastic Packaging Industry Revenue Million Forecast, by Country 2020 & 2033
- Table 9: United States Rigid Plastic Packaging Industry Revenue (Million) Forecast, by Application 2020 & 2033
- Table 10: Canada Rigid Plastic Packaging Industry Revenue (Million) Forecast, by Application 2020 & 2033
- Table 11: Global Rigid Plastic Packaging Industry Revenue Million Forecast, by Product 2020 & 2033
- Table 12: Global Rigid Plastic Packaging Industry Revenue Million Forecast, by Material 2020 & 2033
- Table 13: Global Rigid Plastic Packaging Industry Revenue Million Forecast, by End-user Industry 2020 & 2033
- Table 14: Global Rigid Plastic Packaging Industry Revenue Million Forecast, by Country 2020 & 2033
- Table 15: United Kingdom Rigid Plastic Packaging Industry Revenue (Million) Forecast, by Application 2020 & 2033
- Table 16: Germany Rigid Plastic Packaging Industry Revenue (Million) Forecast, by Application 2020 & 2033
- Table 17: France Rigid Plastic Packaging Industry Revenue (Million) Forecast, by Application 2020 & 2033
- Table 18: Italy Rigid Plastic Packaging Industry Revenue (Million) Forecast, by Application 2020 & 2033
- Table 19: Rest of Europe Rigid Plastic Packaging Industry Revenue (Million) Forecast, by Application 2020 & 2033
- Table 20: Global Rigid Plastic Packaging Industry Revenue Million Forecast, by Product 2020 & 2033
- Table 21: Global Rigid Plastic Packaging Industry Revenue Million Forecast, by Material 2020 & 2033
- Table 22: Global Rigid Plastic Packaging Industry Revenue Million Forecast, by End-user Industry 2020 & 2033
- Table 23: Global Rigid Plastic Packaging Industry Revenue Million Forecast, by Country 2020 & 2033
- Table 24: China Rigid Plastic Packaging Industry Revenue (Million) Forecast, by Application 2020 & 2033
- Table 25: India Rigid Plastic Packaging Industry Revenue (Million) Forecast, by Application 2020 & 2033
- Table 26: Japan Rigid Plastic Packaging Industry Revenue (Million) Forecast, by Application 2020 & 2033
- Table 27: Australia Rigid Plastic Packaging Industry Revenue (Million) Forecast, by Application 2020 & 2033
- Table 28: South Korea Rigid Plastic Packaging Industry Revenue (Million) Forecast, by Application 2020 & 2033
- Table 29: Rest of Asia Pacific Rigid Plastic Packaging Industry Revenue (Million) Forecast, by Application 2020 & 2033
- Table 30: Global Rigid Plastic Packaging Industry Revenue Million Forecast, by Product 2020 & 2033
- Table 31: Global Rigid Plastic Packaging Industry Revenue Million Forecast, by Material 2020 & 2033
- Table 32: Global Rigid Plastic Packaging Industry Revenue Million Forecast, by End-user Industry 2020 & 2033
- Table 33: Global Rigid Plastic Packaging Industry Revenue Million Forecast, by Country 2020 & 2033
- Table 34: Brazil Rigid Plastic Packaging Industry Revenue (Million) Forecast, by Application 2020 & 2033
- Table 35: Argentina Rigid Plastic Packaging Industry Revenue (Million) Forecast, by Application 2020 & 2033
- Table 36: Mexico Rigid Plastic Packaging Industry Revenue (Million) Forecast, by Application 2020 & 2033
- Table 37: Rest of Latin America Rigid Plastic Packaging Industry Revenue (Million) Forecast, by Application 2020 & 2033
- Table 38: Global Rigid Plastic Packaging Industry Revenue Million Forecast, by Product 2020 & 2033
- Table 39: Global Rigid Plastic Packaging Industry Revenue Million Forecast, by Material 2020 & 2033
- Table 40: Global Rigid Plastic Packaging Industry Revenue Million Forecast, by End-user Industry 2020 & 2033
- Table 41: Global Rigid Plastic Packaging Industry Revenue Million Forecast, by Country 2020 & 2033
- Table 42: United Arab Emirates Rigid Plastic Packaging Industry Revenue (Million) Forecast, by Application 2020 & 2033
- Table 43: Saudi Arabia Rigid Plastic Packaging Industry Revenue (Million) Forecast, by Application 2020 & 2033
- Table 44: South Africa Rigid Plastic Packaging Industry Revenue (Million) Forecast, by Application 2020 & 2033
- Table 45: Rest of Middle East and Africa Rigid Plastic Packaging Industry Revenue (Million) Forecast, by Application 2020 & 2033
Frequently Asked Questions
1. What is the projected Compound Annual Growth Rate (CAGR) of the Rigid Plastic Packaging Industry?
The projected CAGR is approximately 2.35%.
2. Which companies are prominent players in the Rigid Plastic Packaging Industry?
Key companies in the market include Sonoco Products Company, Amcor Group GmbH, Albea Grou, Graham Packaging Company, Berry Global Inc, Silgan Holdings Inc, Plastipak Holding Inc, Sealed Air Corporation, Alpla Werke Alwin Lehner GmbH & Co KG, Huhtamaki Inc.
3. What are the main segments of the Rigid Plastic Packaging Industry?
The market segments include Product, Material, End-user Industry.
4. Can you provide details about the market size?
The market size is estimated to be USD 253.36 Million as of 2022.
5. What are some drivers contributing to market growth?
Increasing Demand in Major Asian Markets Such as India and China; Strong Demand From the Food and Beverage Packaging Industry.
6. What are the notable trends driving market growth?
Polypropylene (PP) to Account for Significant Market Share in Rigid Plastic Packaging Market.
7. Are there any restraints impacting market growth?
Stringent Laws and Regulations Pertaining to Plastic Packaging Industry; Competition From Flexible Plastic Packaging.
8. Can you provide examples of recent developments in the market?
July 2023: PepsiCo India declared that it will introduce India's first 100% recycled plastic bottles, known as rPET bottles, for its Carbonated Beverage product, known as Pepsi Black. The plastic bottles will be produced in India through a collaboration between the company and its bottling partner, Varun Beverages.
9. What pricing options are available for accessing the report?
Pricing options include single-user, multi-user, and enterprise licenses priced at USD 4750, USD 5250, and USD 8750 respectively.
10. Is the market size provided in terms of value or volume?
The market size is provided in terms of value, measured in Million.
11. Are there any specific market keywords associated with the report?
Yes, the market keyword associated with the report is "Rigid Plastic Packaging Industry," which aids in identifying and referencing the specific market segment covered.
12. How do I determine which pricing option suits my needs best?
The pricing options vary based on user requirements and access needs. Individual users may opt for single-user licenses, while businesses requiring broader access may choose multi-user or enterprise licenses for cost-effective access to the report.
13. Are there any additional resources or data provided in the Rigid Plastic Packaging Industry report?
While the report offers comprehensive insights, it's advisable to review the specific contents or supplementary materials provided to ascertain if additional resources or data are available.
14. How can I stay updated on further developments or reports in the Rigid Plastic Packaging Industry?
To stay informed about further developments, trends, and reports in the Rigid Plastic Packaging Industry, consider subscribing to industry newsletters, following relevant companies and organizations, or regularly checking reputable industry news sources and publications.
Methodology
Step 1 - Identification of Relevant Samples Size from Population Database


Step 2 - Approaches for Defining Global Market Size (Value, Volume* & Price*)

Note*: In applicable scenarios
Step 3 - Data Sources
Primary Research
- Web Analytics
- Survey Reports
- Research Institute
- Latest Research Reports
- Opinion Leaders
Secondary Research
- Annual Reports
- White Paper
- Latest Press Release
- Industry Association
- Paid Database
- Investor Presentations

Step 4 - Data Triangulation
Involves using different sources of information in order to increase the validity of a study
These sources are likely to be stakeholders in a program - participants, other researchers, program staff, other community members, and so on.
Then we put all data in single framework & apply various statistical tools to find out the dynamic on the market.
During the analysis stage, feedback from the stakeholder groups would be compared to determine areas of agreement as well as areas of divergence