

Key Insights
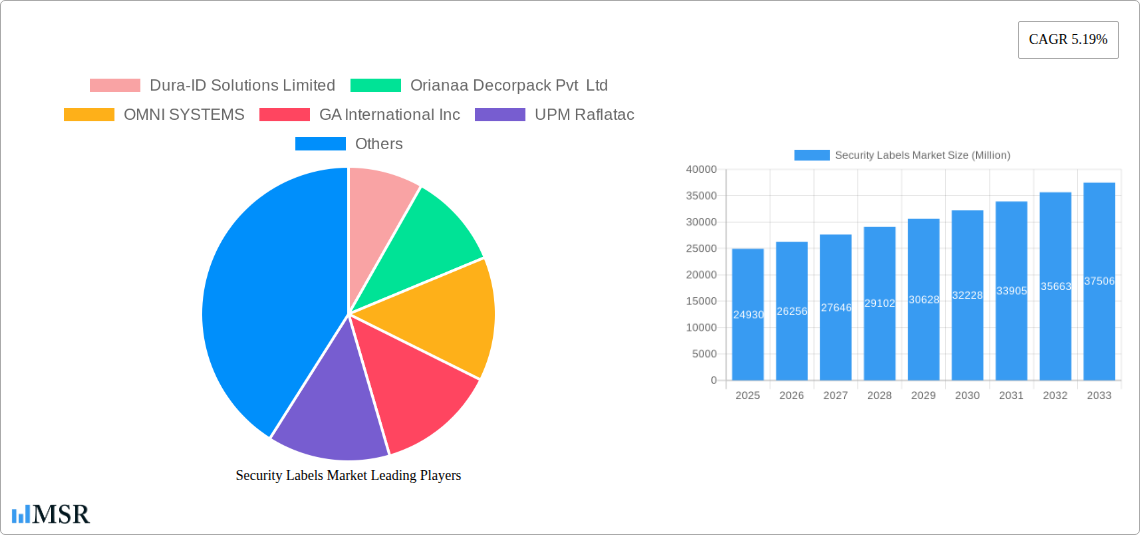
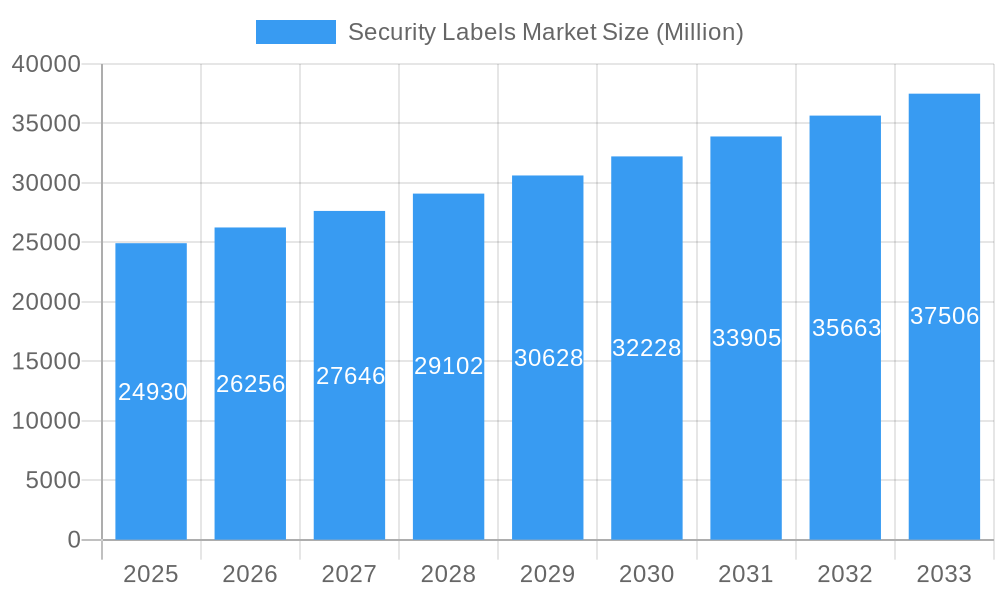
The global security labels market, valued at $24.93 billion in 2025, is projected to experience robust growth, exhibiting a Compound Annual Growth Rate (CAGR) of 5.19% from 2025 to 2033. This expansion is driven by several key factors. Increasing concerns regarding product counterfeiting and brand protection are fueling demand for sophisticated security labels across various industries. The rise of e-commerce and the need for secure package verification further contribute to market growth. Advancements in printing technologies, such as digital printing, allow for personalized and highly secure labels, enhancing their effectiveness against counterfeiting. Furthermore, the growing adoption of tamper-evident seals and labels across diverse sectors, including pharmaceuticals, food and beverages, and electronics, is significantly boosting market demand. The market is segmented by raw material (metal, plastic/polymer), mechanism (pressure-sensitive, shrink sleeve, others), product type (warning/security, branding, weatherproof, asset tags), printing technology (analog, digital), and end-user industry (electronics, food & beverage, automotive, healthcare). The strong presence of established players like 3M, Avery Dennison, and CCL Industries, coupled with the emergence of innovative smaller companies, fosters competition and drives innovation.
Security Labels Market Market Size (In Billion)
Geographic distribution reveals significant market potential across North America, Europe, and Asia. North America, currently holding a substantial market share, benefits from robust industrial sectors and stringent regulatory frameworks. Europe follows closely, driven by strong demand from the automotive and pharmaceutical industries. Asia-Pacific, especially China and India, is experiencing rapid growth due to expanding manufacturing sectors and increasing consumer awareness of product authenticity. While the market faces restraints such as fluctuating raw material prices and the potential for technological disruptions, the overall outlook remains optimistic, with consistent growth expected throughout the forecast period. The market's diverse segmentation allows for targeted growth strategies tailored to specific industry needs, ensuring sustained expansion in the coming years.
Security Labels Market Company Market Share
Security Labels Market: A Comprehensive Report (2019-2033)
This in-depth report provides a comprehensive analysis of the Security Labels Market, offering actionable insights for industry stakeholders. With a study period spanning 2019-2033, a base year of 2025, and a forecast period of 2025-2033, this report unveils the market's dynamics, trends, and future potential. The report covers key segments including raw materials (Metal Labels, Plastic/Polymer Labels), mechanisms (Pressure Sensitive Labelling, Shrink Sleeve Labelling, Other), product types (Warning/Security Labels, Branding Labels, Weatherproof Labels, Equipment Asset Tags, Others), printing technologies (Analog, Digital), and end-user industries (Electronics, Food & Beverage, Automotive, Healthcare, Others). Leading players like 3M Company, Avery Dennison Corporation, CCL Industries Inc, and Brady Corporation are profiled, alongside an analysis of recent M&A activities impacting market share and dynamics. The report values the market at xx Million in 2025, with a projected CAGR of xx% during the forecast period.
Security Labels Market Market Concentration & Dynamics
The Security Labels Market exhibits a moderately concentrated structure, with several major players holding significant market share. The market share of the top 5 players is estimated at xx%, indicating a competitive landscape with opportunities for both established players and new entrants. Innovation is a key driver, with continuous advancements in printing technologies, material science, and functionalities impacting market growth. Stringent regulatory frameworks, particularly concerning product safety and environmental compliance, significantly influence market dynamics. Substitute products, such as digital watermarking or advanced tracking technologies, pose a potential threat but also stimulate innovation. End-user trends toward enhanced product security and brand protection fuel market demand.
The market has witnessed significant M&A activity in recent years, with a total of xx deals recorded between 2019 and 2024. Key examples include:
- ProMach's acquisition of Etiflex (April 2024)
- All4Labels' launch of INTEGRITAG (November 2023)
- CCL Industries' acquisitions of eAgile Inc. and Alert Systems ApS (April 2023)
These mergers and acquisitions highlight the increasing consolidation within the industry and the strategic focus on expanding capabilities in areas like RFID and high-security labeling.
Security Labels Market Industry Insights & Trends
The global Security Labels Market is experiencing robust and dynamic growth, fundamentally driven by the escalating demand for enhanced product security and authenticity across an expansive array of industries. The market was significantly valued in 2024, and it is meticulously projected to achieve substantial growth by 2033, demonstrating a compelling Compound Annual Growth Rate (CAGR). This upward trajectory is propelled by a confluence of critical factors: the pervasive and increasing prevalence of sophisticated counterfeiting operations and product tampering incidents, the widespread adoption of advanced and intricate security features within a diverse range of consumer and industrial products, and the ever-growing imperative for reliable and tamper-evident packaging solutions. Technological breakthroughs, most notably the seamless integration of Radio-Frequency Identification (RFID) technology and sophisticated digital printing capabilities, are further accelerating market expansion. The pronounced shift towards advanced authentication methodologies, encompassing high-security holographic labels and intelligent smart labels, directly reflects evolving consumer expectations and the heightened, undeniable need for robust security measures. Furthermore, increasingly stringent government regulations and mandates concerning product authenticity, origin verification, and end-to-end traceability are creating a powerfully positive influence on overall market development.
Key Markets & Segments Leading Security Labels Market
The North American region currently dominates the Security Labels Market, accounting for approximately xx% of the global market share in 2024. This dominance is attributed to several factors:
- Strong economic growth: driving demand across various sectors.
- Well-established infrastructure: facilitating efficient manufacturing and distribution.
- High adoption of advanced technologies: leading to increased use of sophisticated security labels.
Segment Dominance:
- By Raw Material: Plastic/Polymer Labels currently hold the largest market share due to their cost-effectiveness and versatility.
- By Mechanism: Pressure-sensitive labeling is the dominant mechanism, offering ease of application and cost-efficiency.
- By Product Type: Warning/Security Labels command the highest market share owing to stringent safety and regulatory compliance demands.
- By Printing Technology: Digital printing is rapidly gaining traction due to its flexibility and ability to produce personalized labels.
- By End-user Industry: The Electronics industry is a major end-user due to the high value of electronic goods and the need to protect against counterfeiting.
Security Labels Market Product Developments
Significant advancements in security label technology are driving market innovation. The integration of RFID technology enables real-time tracking and authentication, while advancements in digital printing allow for highly customized and intricate designs. The development of tamper-evident labels and holographic security features enhances product security and brand protection. These advancements are creating new market opportunities and providing competitive advantages to companies that embrace innovation.
Challenges in the Security Labels Market Market
The Security Labels Market faces several challenges. Stringent environmental regulations regarding label materials and disposal pose significant hurdles. Supply chain disruptions and fluctuations in raw material prices can impact production costs and profitability. Intense competition from both established players and new entrants necessitates continuous innovation and cost optimization. The estimated impact of these challenges on market growth in 2024 is approximately xx%.
Forces Driving Security Labels Market Growth
Several factors fuel the growth of the Security Labels Market:
- Increasing demand for counterfeit prevention across industries.
- Stringent government regulations promoting product traceability and authenticity.
- Advancements in digital printing and RFID technology.
- Growing consumer awareness regarding product safety and authenticity.
Challenges in the Security Labels Market Market
Long-term growth is driven by continued innovation in materials and printing technologies, strategic partnerships and acquisitions, and expansion into new, emerging markets. The increasing adoption of smart labels and the development of advanced security features will contribute to sustainable growth in the long term.
Emerging Opportunities in Security Labels Market
The Security Labels Market is rife with emerging opportunities, particularly in response to global trends. The burgeoning demand for sustainable, eco-friendly, and recyclable label solutions presents a significant area for innovation and market differentiation. The expansion of the market into developing economies, where the need for product security is rapidly increasing, offers substantial growth potential. Moreover, the increasing specialization in niche applications, such as the critical labeling requirements for pharmaceuticals and high-value medical devices, unlocks new revenue streams. The pioneering integration of blockchain technology for unparalleled security, transparency, and traceability offers a transformative potential for future market development and enhanced trust.
Leading Players in the Security Labels Market Sector
- Dura-ID Solutions Limited
- Orianaa Decorpack Pvt Ltd
- OMNI SYSTEMS
- GA International Inc
- UPM Raflatac
- DuPont de Nemours Inc
- Brook + Whittle Ltd
- 3M Company
- CCL Industries Inc
- Avery Dennison Corporation
- Asean Pack
- Computer Imprintable Label Systems Ltd (CISL Ltd)
- LabelTac com
- Brady Corporation
Key Milestones in Security Labels Market Industry
- April 2024: ProMach's acquisition of Etiflex expands its labeling expertise and market reach.
- November 2023: All4Labels launches INTEGRITAG, strengthening its position in high-security labeling solutions.
- April 2023: CCL Industries' acquisitions of eAgile Inc. and Alert Systems ApS enhance its capabilities in intelligent label technology.
Strategic Outlook for Security Labels Market Market
The Security Labels Market presents significant growth potential driven by ongoing technological advancements, expanding regulatory requirements, and increasing consumer demand for secure and traceable products. Strategic partnerships, focused innovation in security features, and expansion into new markets will be critical for companies seeking to capitalize on future opportunities.
Security Labels Market Segmentation
-
1. Raw Material
- 1.1. Metal Labels
- 1.2. Plastic/Polymer Labels
-
2. Mechanism
- 2.1. Pressure Sensitive Labelling
- 2.2. Shrink Sleeve Labelling
- 2.3. Other Mechanism
-
3. Product Type
- 3.1. Warning/Security Labels
- 3.2. Branding Labels
- 3.3. Weatherproof Labels
- 3.4. Equipment Asset Tags
- 3.5. Other Product Types
-
4. Printing Technology
- 4.1. Analog Printing
- 4.2. Digital Printing
-
5. End-user Industry
- 5.1. Electronics Industry
- 5.2. Food & Beverage
- 5.3. Automotive
- 5.4. Healthcare
- 5.5. Other End-user Industry
Security Labels Market Segmentation By Geography
-
1. North America
- 1.1. United States
- 1.2. Canada
-
2. Europe
- 2.1. Germany
- 2.2. United Kingdom
- 2.3. France
- 2.4. Spain
-
3. Asia
- 3.1. China
- 3.2. Japan
- 3.3. India
- 3.4. South Korea
- 4. Australia and New Zealand
-
5. Latin America
- 5.1. Brazil
- 5.2. Mexico
- 5.3. Argentina
-
6. Middle East and Africa
- 6.1. United Arab Emirates
- 6.2. Saudi Arabia
- 6.3. South Africa
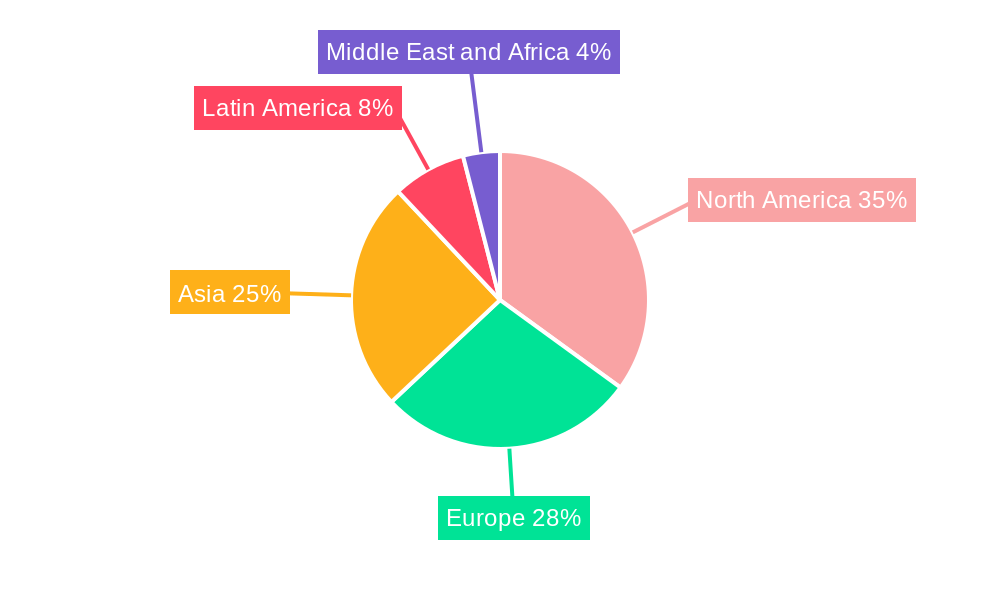
Security Labels Market Regional Market Share
Geographic Coverage of Security Labels Market
Security Labels Market REPORT HIGHLIGHTS
| Aspects | Details |
|---|---|
| Study Period | 2020-2034 |
| Base Year | 2025 |
| Estimated Year | 2026 |
| Forecast Period | 2026-2034 |
| Historical Period | 2020-2025 |
| Growth Rate | CAGR of 5.19% from 2020-2034 |
| Segmentation |
|
Table of Contents
- 1. Introduction
- 1.1. Research Scope
- 1.2. Market Segmentation
- 1.3. Research Objective
- 1.4. Definitions and Assumptions
- 2. Executive Summary
- 2.1. Market Snapshot
- 3. Market Dynamics
- 3.1. Market Drivers
- 3.2. Market Restrains
- 3.3. Market Trends
- 3.4. Market Opportunities
- 4. Market Factor Analysis
- 4.1. Porters Five Forces
- 4.1.1. Bargaining Power of Suppliers
- 4.1.2. Bargaining Power of Buyers
- 4.1.3. Threat of New Entrants
- 4.1.4. Threat of Substitutes
- 4.1.5. Competitive Rivalry
- 4.2. PESTEL analysis
- 4.3. BCG Analysis
- 4.3.1. Stars (High Growth, High Market Share)
- 4.3.2. Cash Cows (Low Growth, High Market Share)
- 4.3.3. Question Mark (High Growth, Low Market Share)
- 4.3.4. Dogs (Low Growth, Low Market Share)
- 4.4. Ansoff Matrix Analysis
- 4.5. Supply Chain Analysis
- 4.6. Regulatory Landscape
- 4.7. Current Market Potential and Opportunity Assessment (TAM–SAM–SOM Framework)
- 4.8. MSR Analyst Note
- 4.1. Porters Five Forces
- 5. Market Analysis, Insights and Forecast 2021-2033
- 5.1. Market Analysis, Insights and Forecast - by Raw Material
- 5.1.1. Metal Labels
- 5.1.2. Plastic/Polymer Labels
- 5.2. Market Analysis, Insights and Forecast - by Mechanism
- 5.2.1. Pressure Sensitive Labelling
- 5.2.2. Shrink Sleeve Labelling
- 5.2.3. Other Mechanism
- 5.3. Market Analysis, Insights and Forecast - by Product Type
- 5.3.1. Warning/Security Labels
- 5.3.2. Branding Labels
- 5.3.3. Weatherproof Labels
- 5.3.4. Equipment Asset Tags
- 5.3.5. Other Product Types
- 5.4. Market Analysis, Insights and Forecast - by Printing Technology
- 5.4.1. Analog Printing
- 5.4.2. Digital Printing
- 5.5. Market Analysis, Insights and Forecast - by End-user Industry
- 5.5.1. Electronics Industry
- 5.5.2. Food & Beverage
- 5.5.3. Automotive
- 5.5.4. Healthcare
- 5.5.5. Other End-user Industry
- 5.6. Market Analysis, Insights and Forecast - by Region
- 5.6.1. North America
- 5.6.2. Europe
- 5.6.3. Asia
- 5.6.4. Australia and New Zealand
- 5.6.5. Latin America
- 5.6.6. Middle East and Africa
- 5.1. Market Analysis, Insights and Forecast - by Raw Material
- 6. Global Security Labels Market Analysis, Insights and Forecast, 2021-2033
- 6.1. Market Analysis, Insights and Forecast - by Raw Material
- 6.1.1. Metal Labels
- 6.1.2. Plastic/Polymer Labels
- 6.2. Market Analysis, Insights and Forecast - by Mechanism
- 6.2.1. Pressure Sensitive Labelling
- 6.2.2. Shrink Sleeve Labelling
- 6.2.3. Other Mechanism
- 6.3. Market Analysis, Insights and Forecast - by Product Type
- 6.3.1. Warning/Security Labels
- 6.3.2. Branding Labels
- 6.3.3. Weatherproof Labels
- 6.3.4. Equipment Asset Tags
- 6.3.5. Other Product Types
- 6.4. Market Analysis, Insights and Forecast - by Printing Technology
- 6.4.1. Analog Printing
- 6.4.2. Digital Printing
- 6.5. Market Analysis, Insights and Forecast - by End-user Industry
- 6.5.1. Electronics Industry
- 6.5.2. Food & Beverage
- 6.5.3. Automotive
- 6.5.4. Healthcare
- 6.5.5. Other End-user Industry
- 6.1. Market Analysis, Insights and Forecast - by Raw Material
- 7. North America Security Labels Market Analysis, Insights and Forecast, 2020-2032
- 7.1. Market Analysis, Insights and Forecast - by Raw Material
- 7.1.1. Metal Labels
- 7.1.2. Plastic/Polymer Labels
- 7.2. Market Analysis, Insights and Forecast - by Mechanism
- 7.2.1. Pressure Sensitive Labelling
- 7.2.2. Shrink Sleeve Labelling
- 7.2.3. Other Mechanism
- 7.3. Market Analysis, Insights and Forecast - by Product Type
- 7.3.1. Warning/Security Labels
- 7.3.2. Branding Labels
- 7.3.3. Weatherproof Labels
- 7.3.4. Equipment Asset Tags
- 7.3.5. Other Product Types
- 7.4. Market Analysis, Insights and Forecast - by Printing Technology
- 7.4.1. Analog Printing
- 7.4.2. Digital Printing
- 7.5. Market Analysis, Insights and Forecast - by End-user Industry
- 7.5.1. Electronics Industry
- 7.5.2. Food & Beverage
- 7.5.3. Automotive
- 7.5.4. Healthcare
- 7.5.5. Other End-user Industry
- 7.1. Market Analysis, Insights and Forecast - by Raw Material
- 8. Europe Security Labels Market Analysis, Insights and Forecast, 2020-2032
- 8.1. Market Analysis, Insights and Forecast - by Raw Material
- 8.1.1. Metal Labels
- 8.1.2. Plastic/Polymer Labels
- 8.2. Market Analysis, Insights and Forecast - by Mechanism
- 8.2.1. Pressure Sensitive Labelling
- 8.2.2. Shrink Sleeve Labelling
- 8.2.3. Other Mechanism
- 8.3. Market Analysis, Insights and Forecast - by Product Type
- 8.3.1. Warning/Security Labels
- 8.3.2. Branding Labels
- 8.3.3. Weatherproof Labels
- 8.3.4. Equipment Asset Tags
- 8.3.5. Other Product Types
- 8.4. Market Analysis, Insights and Forecast - by Printing Technology
- 8.4.1. Analog Printing
- 8.4.2. Digital Printing
- 8.5. Market Analysis, Insights and Forecast - by End-user Industry
- 8.5.1. Electronics Industry
- 8.5.2. Food & Beverage
- 8.5.3. Automotive
- 8.5.4. Healthcare
- 8.5.5. Other End-user Industry
- 8.1. Market Analysis, Insights and Forecast - by Raw Material
- 9. Asia Security Labels Market Analysis, Insights and Forecast, 2020-2032
- 9.1. Market Analysis, Insights and Forecast - by Raw Material
- 9.1.1. Metal Labels
- 9.1.2. Plastic/Polymer Labels
- 9.2. Market Analysis, Insights and Forecast - by Mechanism
- 9.2.1. Pressure Sensitive Labelling
- 9.2.2. Shrink Sleeve Labelling
- 9.2.3. Other Mechanism
- 9.3. Market Analysis, Insights and Forecast - by Product Type
- 9.3.1. Warning/Security Labels
- 9.3.2. Branding Labels
- 9.3.3. Weatherproof Labels
- 9.3.4. Equipment Asset Tags
- 9.3.5. Other Product Types
- 9.4. Market Analysis, Insights and Forecast - by Printing Technology
- 9.4.1. Analog Printing
- 9.4.2. Digital Printing
- 9.5. Market Analysis, Insights and Forecast - by End-user Industry
- 9.5.1. Electronics Industry
- 9.5.2. Food & Beverage
- 9.5.3. Automotive
- 9.5.4. Healthcare
- 9.5.5. Other End-user Industry
- 9.1. Market Analysis, Insights and Forecast - by Raw Material
- 10. Australia and New Zealand Security Labels Market Analysis, Insights and Forecast, 2020-2032
- 10.1. Market Analysis, Insights and Forecast - by Raw Material
- 10.1.1. Metal Labels
- 10.1.2. Plastic/Polymer Labels
- 10.2. Market Analysis, Insights and Forecast - by Mechanism
- 10.2.1. Pressure Sensitive Labelling
- 10.2.2. Shrink Sleeve Labelling
- 10.2.3. Other Mechanism
- 10.3. Market Analysis, Insights and Forecast - by Product Type
- 10.3.1. Warning/Security Labels
- 10.3.2. Branding Labels
- 10.3.3. Weatherproof Labels
- 10.3.4. Equipment Asset Tags
- 10.3.5. Other Product Types
- 10.4. Market Analysis, Insights and Forecast - by Printing Technology
- 10.4.1. Analog Printing
- 10.4.2. Digital Printing
- 10.5. Market Analysis, Insights and Forecast - by End-user Industry
- 10.5.1. Electronics Industry
- 10.5.2. Food & Beverage
- 10.5.3. Automotive
- 10.5.4. Healthcare
- 10.5.5. Other End-user Industry
- 10.1. Market Analysis, Insights and Forecast - by Raw Material
- 11. Latin America Security Labels Market Analysis, Insights and Forecast, 2020-2032
- 11.1. Market Analysis, Insights and Forecast - by Raw Material
- 11.1.1. Metal Labels
- 11.1.2. Plastic/Polymer Labels
- 11.2. Market Analysis, Insights and Forecast - by Mechanism
- 11.2.1. Pressure Sensitive Labelling
- 11.2.2. Shrink Sleeve Labelling
- 11.2.3. Other Mechanism
- 11.3. Market Analysis, Insights and Forecast - by Product Type
- 11.3.1. Warning/Security Labels
- 11.3.2. Branding Labels
- 11.3.3. Weatherproof Labels
- 11.3.4. Equipment Asset Tags
- 11.3.5. Other Product Types
- 11.4. Market Analysis, Insights and Forecast - by Printing Technology
- 11.4.1. Analog Printing
- 11.4.2. Digital Printing
- 11.5. Market Analysis, Insights and Forecast - by End-user Industry
- 11.5.1. Electronics Industry
- 11.5.2. Food & Beverage
- 11.5.3. Automotive
- 11.5.4. Healthcare
- 11.5.5. Other End-user Industry
- 11.1. Market Analysis, Insights and Forecast - by Raw Material
- 12. Middle East and Africa Security Labels Market Analysis, Insights and Forecast, 2020-2032
- 12.1. Market Analysis, Insights and Forecast - by Raw Material
- 12.1.1. Metal Labels
- 12.1.2. Plastic/Polymer Labels
- 12.2. Market Analysis, Insights and Forecast - by Mechanism
- 12.2.1. Pressure Sensitive Labelling
- 12.2.2. Shrink Sleeve Labelling
- 12.2.3. Other Mechanism
- 12.3. Market Analysis, Insights and Forecast - by Product Type
- 12.3.1. Warning/Security Labels
- 12.3.2. Branding Labels
- 12.3.3. Weatherproof Labels
- 12.3.4. Equipment Asset Tags
- 12.3.5. Other Product Types
- 12.4. Market Analysis, Insights and Forecast - by Printing Technology
- 12.4.1. Analog Printing
- 12.4.2. Digital Printing
- 12.5. Market Analysis, Insights and Forecast - by End-user Industry
- 12.5.1. Electronics Industry
- 12.5.2. Food & Beverage
- 12.5.3. Automotive
- 12.5.4. Healthcare
- 12.5.5. Other End-user Industry
- 12.1. Market Analysis, Insights and Forecast - by Raw Material
- 13. Competitive Analysis
- 13.1. Company Profiles
- 13.1.1 Dura-ID Solutions Limited
- 13.1.1.1. Company Overview
- 13.1.1.2. Products
- 13.1.1.3. Company Financials
- 13.1.1.4. SWOT Analysis
- 13.1.2 Orianaa Decorpack Pvt Ltd
- 13.1.2.1. Company Overview
- 13.1.2.2. Products
- 13.1.2.3. Company Financials
- 13.1.2.4. SWOT Analysis
- 13.1.3 OMNI SYSTEMS
- 13.1.3.1. Company Overview
- 13.1.3.2. Products
- 13.1.3.3. Company Financials
- 13.1.3.4. SWOT Analysis
- 13.1.4 GA International Inc
- 13.1.4.1. Company Overview
- 13.1.4.2. Products
- 13.1.4.3. Company Financials
- 13.1.4.4. SWOT Analysis
- 13.1.5 UPM Raflatac
- 13.1.5.1. Company Overview
- 13.1.5.2. Products
- 13.1.5.3. Company Financials
- 13.1.5.4. SWOT Analysis
- 13.1.6 DuPont de Nemours Inc
- 13.1.6.1. Company Overview
- 13.1.6.2. Products
- 13.1.6.3. Company Financials
- 13.1.6.4. SWOT Analysis
- 13.1.7 Brook + Whittle Ltd
- 13.1.7.1. Company Overview
- 13.1.7.2. Products
- 13.1.7.3. Company Financials
- 13.1.7.4. SWOT Analysis
- 13.1.8 3M Company
- 13.1.8.1. Company Overview
- 13.1.8.2. Products
- 13.1.8.3. Company Financials
- 13.1.8.4. SWOT Analysis
- 13.1.9 CCL Industries Inc
- 13.1.9.1. Company Overview
- 13.1.9.2. Products
- 13.1.9.3. Company Financials
- 13.1.9.4. SWOT Analysis
- 13.1.10 Avery Dennison Corporation
- 13.1.10.1. Company Overview
- 13.1.10.2. Products
- 13.1.10.3. Company Financials
- 13.1.10.4. SWOT Analysis
- 13.1.11 Asean Pack
- 13.1.11.1. Company Overview
- 13.1.11.2. Products
- 13.1.11.3. Company Financials
- 13.1.11.4. SWOT Analysis
- 13.1.12 Computer Imprintable Label Systems Ltd (CISL Ltd)
- 13.1.12.1. Company Overview
- 13.1.12.2. Products
- 13.1.12.3. Company Financials
- 13.1.12.4. SWOT Analysis
- 13.1.13 LabelTac com
- 13.1.13.1. Company Overview
- 13.1.13.2. Products
- 13.1.13.3. Company Financials
- 13.1.13.4. SWOT Analysis
- 13.1.14 Brady Corporation
- 13.1.14.1. Company Overview
- 13.1.14.2. Products
- 13.1.14.3. Company Financials
- 13.1.14.4. SWOT Analysis
- 13.1.1 Dura-ID Solutions Limited
- 13.2. Market Entropy
- 13.2.1 Company's Key Areas Served
- 13.2.2 Recent Developments
- 13.3. Company Market Share Analysis 2025
- 13.3.1 Top 5 Companies Market Share Analysis
- 13.3.2 Top 3 Companies Market Share Analysis
- 13.4. List of Potential Customers
- 14. Research Methodology
List of Figures
- Figure 1: Global Security Labels Market Revenue Breakdown (Million, %) by Region 2025 & 2033
- Figure 2: North America Security Labels Market Revenue (Million), by Raw Material 2025 & 2033
- Figure 3: North America Security Labels Market Revenue Share (%), by Raw Material 2025 & 2033
- Figure 4: North America Security Labels Market Revenue (Million), by Mechanism 2025 & 2033
- Figure 5: North America Security Labels Market Revenue Share (%), by Mechanism 2025 & 2033
- Figure 6: North America Security Labels Market Revenue (Million), by Product Type 2025 & 2033
- Figure 7: North America Security Labels Market Revenue Share (%), by Product Type 2025 & 2033
- Figure 8: North America Security Labels Market Revenue (Million), by Printing Technology 2025 & 2033
- Figure 9: North America Security Labels Market Revenue Share (%), by Printing Technology 2025 & 2033
- Figure 10: North America Security Labels Market Revenue (Million), by End-user Industry 2025 & 2033
- Figure 11: North America Security Labels Market Revenue Share (%), by End-user Industry 2025 & 2033
- Figure 12: North America Security Labels Market Revenue (Million), by Country 2025 & 2033
- Figure 13: North America Security Labels Market Revenue Share (%), by Country 2025 & 2033
- Figure 14: Europe Security Labels Market Revenue (Million), by Raw Material 2025 & 2033
- Figure 15: Europe Security Labels Market Revenue Share (%), by Raw Material 2025 & 2033
- Figure 16: Europe Security Labels Market Revenue (Million), by Mechanism 2025 & 2033
- Figure 17: Europe Security Labels Market Revenue Share (%), by Mechanism 2025 & 2033
- Figure 18: Europe Security Labels Market Revenue (Million), by Product Type 2025 & 2033
- Figure 19: Europe Security Labels Market Revenue Share (%), by Product Type 2025 & 2033
- Figure 20: Europe Security Labels Market Revenue (Million), by Printing Technology 2025 & 2033
- Figure 21: Europe Security Labels Market Revenue Share (%), by Printing Technology 2025 & 2033
- Figure 22: Europe Security Labels Market Revenue (Million), by End-user Industry 2025 & 2033
- Figure 23: Europe Security Labels Market Revenue Share (%), by End-user Industry 2025 & 2033
- Figure 24: Europe Security Labels Market Revenue (Million), by Country 2025 & 2033
- Figure 25: Europe Security Labels Market Revenue Share (%), by Country 2025 & 2033
- Figure 26: Asia Security Labels Market Revenue (Million), by Raw Material 2025 & 2033
- Figure 27: Asia Security Labels Market Revenue Share (%), by Raw Material 2025 & 2033
- Figure 28: Asia Security Labels Market Revenue (Million), by Mechanism 2025 & 2033
- Figure 29: Asia Security Labels Market Revenue Share (%), by Mechanism 2025 & 2033
- Figure 30: Asia Security Labels Market Revenue (Million), by Product Type 2025 & 2033
- Figure 31: Asia Security Labels Market Revenue Share (%), by Product Type 2025 & 2033
- Figure 32: Asia Security Labels Market Revenue (Million), by Printing Technology 2025 & 2033
- Figure 33: Asia Security Labels Market Revenue Share (%), by Printing Technology 2025 & 2033
- Figure 34: Asia Security Labels Market Revenue (Million), by End-user Industry 2025 & 2033
- Figure 35: Asia Security Labels Market Revenue Share (%), by End-user Industry 2025 & 2033
- Figure 36: Asia Security Labels Market Revenue (Million), by Country 2025 & 2033
- Figure 37: Asia Security Labels Market Revenue Share (%), by Country 2025 & 2033
- Figure 38: Australia and New Zealand Security Labels Market Revenue (Million), by Raw Material 2025 & 2033
- Figure 39: Australia and New Zealand Security Labels Market Revenue Share (%), by Raw Material 2025 & 2033
- Figure 40: Australia and New Zealand Security Labels Market Revenue (Million), by Mechanism 2025 & 2033
- Figure 41: Australia and New Zealand Security Labels Market Revenue Share (%), by Mechanism 2025 & 2033
- Figure 42: Australia and New Zealand Security Labels Market Revenue (Million), by Product Type 2025 & 2033
- Figure 43: Australia and New Zealand Security Labels Market Revenue Share (%), by Product Type 2025 & 2033
- Figure 44: Australia and New Zealand Security Labels Market Revenue (Million), by Printing Technology 2025 & 2033
- Figure 45: Australia and New Zealand Security Labels Market Revenue Share (%), by Printing Technology 2025 & 2033
- Figure 46: Australia and New Zealand Security Labels Market Revenue (Million), by End-user Industry 2025 & 2033
- Figure 47: Australia and New Zealand Security Labels Market Revenue Share (%), by End-user Industry 2025 & 2033
- Figure 48: Australia and New Zealand Security Labels Market Revenue (Million), by Country 2025 & 2033
- Figure 49: Australia and New Zealand Security Labels Market Revenue Share (%), by Country 2025 & 2033
- Figure 50: Latin America Security Labels Market Revenue (Million), by Raw Material 2025 & 2033
- Figure 51: Latin America Security Labels Market Revenue Share (%), by Raw Material 2025 & 2033
- Figure 52: Latin America Security Labels Market Revenue (Million), by Mechanism 2025 & 2033
- Figure 53: Latin America Security Labels Market Revenue Share (%), by Mechanism 2025 & 2033
- Figure 54: Latin America Security Labels Market Revenue (Million), by Product Type 2025 & 2033
- Figure 55: Latin America Security Labels Market Revenue Share (%), by Product Type 2025 & 2033
- Figure 56: Latin America Security Labels Market Revenue (Million), by Printing Technology 2025 & 2033
- Figure 57: Latin America Security Labels Market Revenue Share (%), by Printing Technology 2025 & 2033
- Figure 58: Latin America Security Labels Market Revenue (Million), by End-user Industry 2025 & 2033
- Figure 59: Latin America Security Labels Market Revenue Share (%), by End-user Industry 2025 & 2033
- Figure 60: Latin America Security Labels Market Revenue (Million), by Country 2025 & 2033
- Figure 61: Latin America Security Labels Market Revenue Share (%), by Country 2025 & 2033
- Figure 62: Middle East and Africa Security Labels Market Revenue (Million), by Raw Material 2025 & 2033
- Figure 63: Middle East and Africa Security Labels Market Revenue Share (%), by Raw Material 2025 & 2033
- Figure 64: Middle East and Africa Security Labels Market Revenue (Million), by Mechanism 2025 & 2033
- Figure 65: Middle East and Africa Security Labels Market Revenue Share (%), by Mechanism 2025 & 2033
- Figure 66: Middle East and Africa Security Labels Market Revenue (Million), by Product Type 2025 & 2033
- Figure 67: Middle East and Africa Security Labels Market Revenue Share (%), by Product Type 2025 & 2033
- Figure 68: Middle East and Africa Security Labels Market Revenue (Million), by Printing Technology 2025 & 2033
- Figure 69: Middle East and Africa Security Labels Market Revenue Share (%), by Printing Technology 2025 & 2033
- Figure 70: Middle East and Africa Security Labels Market Revenue (Million), by End-user Industry 2025 & 2033
- Figure 71: Middle East and Africa Security Labels Market Revenue Share (%), by End-user Industry 2025 & 2033
- Figure 72: Middle East and Africa Security Labels Market Revenue (Million), by Country 2025 & 2033
- Figure 73: Middle East and Africa Security Labels Market Revenue Share (%), by Country 2025 & 2033
List of Tables
- Table 1: Global Security Labels Market Revenue Million Forecast, by Raw Material 2020 & 2033
- Table 2: Global Security Labels Market Revenue Million Forecast, by Mechanism 2020 & 2033
- Table 3: Global Security Labels Market Revenue Million Forecast, by Product Type 2020 & 2033
- Table 4: Global Security Labels Market Revenue Million Forecast, by Printing Technology 2020 & 2033
- Table 5: Global Security Labels Market Revenue Million Forecast, by End-user Industry 2020 & 2033
- Table 6: Global Security Labels Market Revenue Million Forecast, by Region 2020 & 2033
- Table 7: Global Security Labels Market Revenue Million Forecast, by Raw Material 2020 & 2033
- Table 8: Global Security Labels Market Revenue Million Forecast, by Mechanism 2020 & 2033
- Table 9: Global Security Labels Market Revenue Million Forecast, by Product Type 2020 & 2033
- Table 10: Global Security Labels Market Revenue Million Forecast, by Printing Technology 2020 & 2033
- Table 11: Global Security Labels Market Revenue Million Forecast, by End-user Industry 2020 & 2033
- Table 12: Global Security Labels Market Revenue Million Forecast, by Country 2020 & 2033
- Table 13: United States Security Labels Market Revenue (Million) Forecast, by Application 2020 & 2033
- Table 14: Canada Security Labels Market Revenue (Million) Forecast, by Application 2020 & 2033
- Table 15: Global Security Labels Market Revenue Million Forecast, by Raw Material 2020 & 2033
- Table 16: Global Security Labels Market Revenue Million Forecast, by Mechanism 2020 & 2033
- Table 17: Global Security Labels Market Revenue Million Forecast, by Product Type 2020 & 2033
- Table 18: Global Security Labels Market Revenue Million Forecast, by Printing Technology 2020 & 2033
- Table 19: Global Security Labels Market Revenue Million Forecast, by End-user Industry 2020 & 2033
- Table 20: Global Security Labels Market Revenue Million Forecast, by Country 2020 & 2033
- Table 21: Germany Security Labels Market Revenue (Million) Forecast, by Application 2020 & 2033
- Table 22: United Kingdom Security Labels Market Revenue (Million) Forecast, by Application 2020 & 2033
- Table 23: France Security Labels Market Revenue (Million) Forecast, by Application 2020 & 2033
- Table 24: Spain Security Labels Market Revenue (Million) Forecast, by Application 2020 & 2033
- Table 25: Global Security Labels Market Revenue Million Forecast, by Raw Material 2020 & 2033
- Table 26: Global Security Labels Market Revenue Million Forecast, by Mechanism 2020 & 2033
- Table 27: Global Security Labels Market Revenue Million Forecast, by Product Type 2020 & 2033
- Table 28: Global Security Labels Market Revenue Million Forecast, by Printing Technology 2020 & 2033
- Table 29: Global Security Labels Market Revenue Million Forecast, by End-user Industry 2020 & 2033
- Table 30: Global Security Labels Market Revenue Million Forecast, by Country 2020 & 2033
- Table 31: China Security Labels Market Revenue (Million) Forecast, by Application 2020 & 2033
- Table 32: Japan Security Labels Market Revenue (Million) Forecast, by Application 2020 & 2033
- Table 33: India Security Labels Market Revenue (Million) Forecast, by Application 2020 & 2033
- Table 34: South Korea Security Labels Market Revenue (Million) Forecast, by Application 2020 & 2033
- Table 35: Global Security Labels Market Revenue Million Forecast, by Raw Material 2020 & 2033
- Table 36: Global Security Labels Market Revenue Million Forecast, by Mechanism 2020 & 2033
- Table 37: Global Security Labels Market Revenue Million Forecast, by Product Type 2020 & 2033
- Table 38: Global Security Labels Market Revenue Million Forecast, by Printing Technology 2020 & 2033
- Table 39: Global Security Labels Market Revenue Million Forecast, by End-user Industry 2020 & 2033
- Table 40: Global Security Labels Market Revenue Million Forecast, by Country 2020 & 2033
- Table 41: Global Security Labels Market Revenue Million Forecast, by Raw Material 2020 & 2033
- Table 42: Global Security Labels Market Revenue Million Forecast, by Mechanism 2020 & 2033
- Table 43: Global Security Labels Market Revenue Million Forecast, by Product Type 2020 & 2033
- Table 44: Global Security Labels Market Revenue Million Forecast, by Printing Technology 2020 & 2033
- Table 45: Global Security Labels Market Revenue Million Forecast, by End-user Industry 2020 & 2033
- Table 46: Global Security Labels Market Revenue Million Forecast, by Country 2020 & 2033
- Table 47: Brazil Security Labels Market Revenue (Million) Forecast, by Application 2020 & 2033
- Table 48: Mexico Security Labels Market Revenue (Million) Forecast, by Application 2020 & 2033
- Table 49: Argentina Security Labels Market Revenue (Million) Forecast, by Application 2020 & 2033
- Table 50: Global Security Labels Market Revenue Million Forecast, by Raw Material 2020 & 2033
- Table 51: Global Security Labels Market Revenue Million Forecast, by Mechanism 2020 & 2033
- Table 52: Global Security Labels Market Revenue Million Forecast, by Product Type 2020 & 2033
- Table 53: Global Security Labels Market Revenue Million Forecast, by Printing Technology 2020 & 2033
- Table 54: Global Security Labels Market Revenue Million Forecast, by End-user Industry 2020 & 2033
- Table 55: Global Security Labels Market Revenue Million Forecast, by Country 2020 & 2033
- Table 56: United Arab Emirates Security Labels Market Revenue (Million) Forecast, by Application 2020 & 2033
- Table 57: Saudi Arabia Security Labels Market Revenue (Million) Forecast, by Application 2020 & 2033
- Table 58: South Africa Security Labels Market Revenue (Million) Forecast, by Application 2020 & 2033
Frequently Asked Questions
1. What is the projected Compound Annual Growth Rate (CAGR) of the Security Labels Market?
The projected CAGR is approximately 5.19%.
2. Which companies are prominent players in the Security Labels Market?
Key companies in the market include Dura-ID Solutions Limited, Orianaa Decorpack Pvt Ltd, OMNI SYSTEMS, GA International Inc, UPM Raflatac, DuPont de Nemours Inc, Brook + Whittle Ltd, 3M Company, CCL Industries Inc, Avery Dennison Corporation, Asean Pack, Computer Imprintable Label Systems Ltd (CISL Ltd), LabelTac com, Brady Corporation.
3. What are the main segments of the Security Labels Market?
The market segments include Raw Material, Mechanism, Product Type, Printing Technology, End-user Industry.
4. Can you provide details about the market size?
The market size is estimated to be USD 24.93 Million as of 2022.
5. What are some drivers contributing to market growth?
Food and Beverage is Expected to Register Significant Growth; APAC to Witness Significant Growth.
6. What are the notable trends driving market growth?
Warning/Security Labels is Expected to Register a Significant Growth.
7. Are there any restraints impacting market growth?
Increasing Cost of Raw Materials.
8. Can you provide examples of recent developments in the market?
April 2024: ProMach, a prominent global player in the manufacturing and distribution of processing and packaging equipment, announced the acquisition of Etiflex, a well-known producer of pressure-sensitive and RFID labels. This acquisition enhances ProMach's labeling and coding expertise across North America and marks the company's initial foray into the Mexican market.
9. What pricing options are available for accessing the report?
Pricing options include single-user, multi-user, and enterprise licenses priced at USD 4750, USD 5250, and USD 8750 respectively.
10. Is the market size provided in terms of value or volume?
The market size is provided in terms of value, measured in Million.
11. Are there any specific market keywords associated with the report?
Yes, the market keyword associated with the report is "Security Labels Market," which aids in identifying and referencing the specific market segment covered.
12. How do I determine which pricing option suits my needs best?
The pricing options vary based on user requirements and access needs. Individual users may opt for single-user licenses, while businesses requiring broader access may choose multi-user or enterprise licenses for cost-effective access to the report.
13. Are there any additional resources or data provided in the Security Labels Market report?
While the report offers comprehensive insights, it's advisable to review the specific contents or supplementary materials provided to ascertain if additional resources or data are available.
14. How can I stay updated on further developments or reports in the Security Labels Market?
To stay informed about further developments, trends, and reports in the Security Labels Market, consider subscribing to industry newsletters, following relevant companies and organizations, or regularly checking reputable industry news sources and publications.
Methodology
Step 1 - Identification of Relevant Samples Size from Population Database


Step 2 - Approaches for Defining Global Market Size (Value, Volume* & Price*)

Note*: In applicable scenarios
Step 3 - Data Sources
Primary Research
- Web Analytics
- Survey Reports
- Research Institute
- Latest Research Reports
- Opinion Leaders
Secondary Research
- Annual Reports
- White Paper
- Latest Press Release
- Industry Association
- Paid Database
- Investor Presentations

Step 4 - Data Triangulation
Involves using different sources of information in order to increase the validity of a study
These sources are likely to be stakeholders in a program - participants, other researchers, program staff, other community members, and so on.
Then we put all data in single framework & apply various statistical tools to find out the dynamic on the market.
During the analysis stage, feedback from the stakeholder groups would be compared to determine areas of agreement as well as areas of divergence