

Key Insights
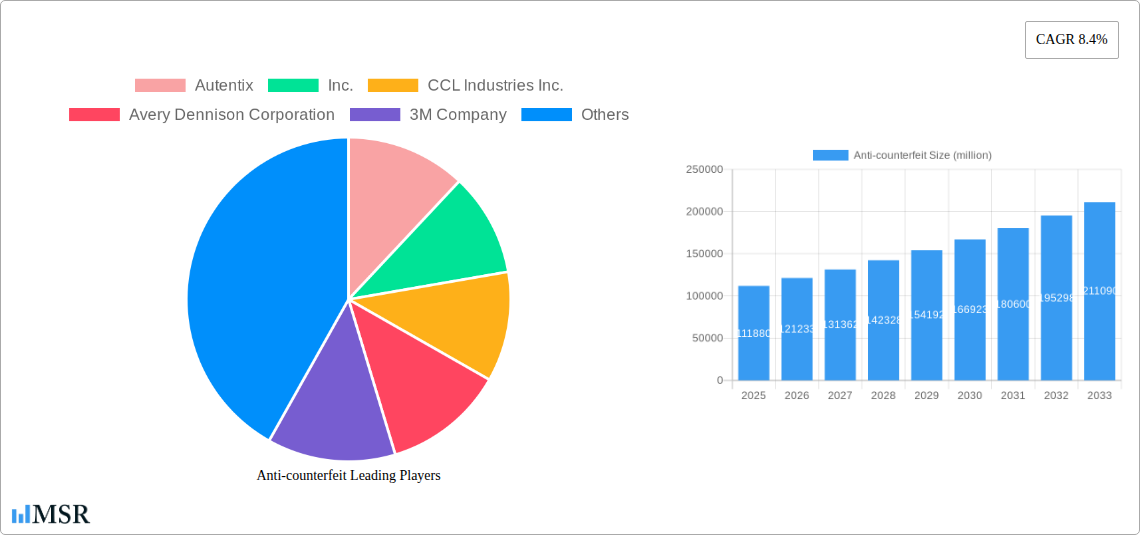
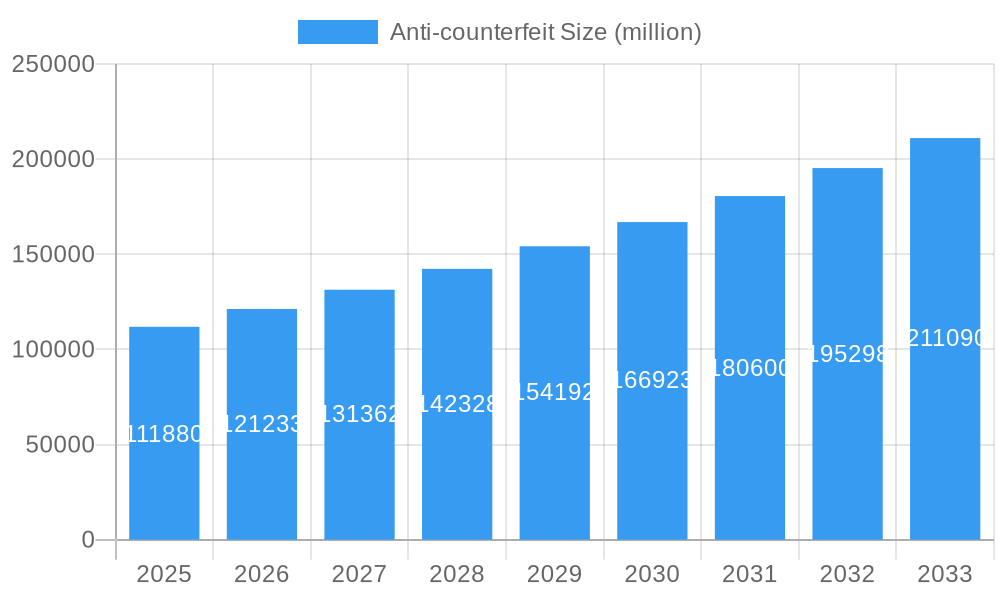
The anti-counterfeiting market, valued at $111.88 billion in 2025, is projected to experience robust growth, driven by a compound annual growth rate (CAGR) of 8.4% from 2025 to 2033. This expansion is fueled by several key factors. The increasing sophistication of counterfeit products across diverse sectors, including pharmaceuticals, luxury goods, and electronics, necessitates advanced anti-counterfeiting technologies. Growing consumer awareness of counterfeit goods and their potential risks, coupled with stringent government regulations aimed at curbing counterfeiting activities, are further bolstering market demand. Technological advancements, such as the integration of blockchain technology for product traceability, RFID tagging for authentication, and sophisticated digital watermarking techniques, are also contributing significantly to market growth. Major players like Autentix, CCL Industries, Avery Dennison, and 3M are investing heavily in R&D and strategic partnerships to maintain their competitive edge in this rapidly evolving market. The market is segmented based on technology type (e.g., holographic labels, track and trace systems, DNA tagging), application (e.g., pharmaceuticals, cosmetics, food and beverage), and geography. Future growth will likely be influenced by the adoption of new technologies and the expansion of anti-counterfeiting measures across emerging economies.
Anti-counterfeit Market Size (In Billion)
The market's expansion is not without challenges. The high initial investment costs associated with implementing advanced anti-counterfeiting solutions can be a significant barrier for smaller businesses. Furthermore, the constant evolution of counterfeiting techniques necessitates continuous innovation and adaptation from technology providers. Despite these restraints, the overall market outlook remains positive, driven by the growing need to protect brand reputation, ensure product authenticity, and safeguard consumer safety and health. The long-term forecast suggests a considerable increase in market size by 2033, reflecting the enduring importance of anti-counterfeiting measures in a globalized and increasingly digital economy. The market is expected to see significant regional variations driven by factors like economic development, regulatory frameworks, and consumer behavior.
Anti-counterfeit Company Market Share
Unlocking Billions: The Comprehensive Anti-Counterfeit Market Report (2019-2033)
This in-depth report provides a comprehensive analysis of the global anti-counterfeit market, projecting a market value exceeding $XX billion by 2033. The study covers the period from 2019 to 2033, with 2025 serving as both the base and estimated year. It offers invaluable insights for industry stakeholders, investors, and businesses seeking to navigate this rapidly evolving landscape. This report is essential for understanding market dynamics, identifying growth opportunities, and making strategic decisions in the fight against counterfeiting.
Anti-counterfeit Market Concentration & Dynamics
This section analyzes the competitive landscape, innovation ecosystems, regulatory changes, substitute products, and end-user trends impacting the anti-counterfeit market. The global market is characterized by a moderately concentrated structure with key players such as Autentix, Inc., CCL Industries Inc., Avery Dennison Corporation, and 3M Company holding significant market share.
- Market Concentration: The top 5 players collectively held an estimated xx% market share in 2025, indicating a moderately concentrated market. This concentration is expected to slightly increase by 2033.
- Innovation Ecosystems: Significant investments in R&D are driving the development of advanced technologies like blockchain, AI, and digital watermarking. Collaborative partnerships between technology providers and brand owners are fostering innovation.
- Regulatory Frameworks: Stringent government regulations and increased enforcement actions across various regions are creating a favorable environment for anti-counterfeit solutions. However, variations in regulations across different jurisdictions pose challenges.
- Substitute Products: While traditional methods like holograms and security inks persist, advanced technologies pose both competition and opportunity.
- End-User Trends: Increasing consumer awareness of counterfeit products and a rising demand for authentic goods are boosting market growth.
- M&A Activities: The anti-counterfeit market witnessed xx M&A deals between 2019 and 2024, indicating a trend of consolidation among players seeking to expand their product portfolios and market reach.
Anti-counterfeit Industry Insights & Trends
The global anti-counterfeit market is experiencing robust growth, driven by several key factors. The market size reached an estimated $XX billion in 2025 and is projected to reach $XX billion by 2033, exhibiting a CAGR of xx% during the forecast period (2025-2033).
This growth is fueled by:
- Increasing Counterfeiting Activities: The proliferation of counterfeit goods across various sectors, including pharmaceuticals, luxury goods, and consumer electronics, is a primary driver. Losses due to counterfeiting are estimated at $XX billion annually.
- Technological Advancements: The emergence of advanced technologies like blockchain, AI-powered authentication systems, and digital watermarking is revolutionizing anti-counterfeit strategies.
- Evolving Consumer Behavior: Consumers are increasingly discerning and demanding authenticity, driving the adoption of anti-counterfeit solutions.
Key Markets & Segments Leading Anti-counterfeit
The Asia-Pacific region dominates the global anti-counterfeit market, driven by rapid economic growth, expanding e-commerce, and increasing consumer spending.
Dominant Region: Asia-Pacific
- Growth Drivers:
- Rapid economic growth in several Asian countries fuels increased consumer spending and demand for branded goods, making them susceptible to counterfeiting.
- The burgeoning e-commerce sector creates a vast platform for counterfeiters to operate, driving the demand for robust anti-counterfeit measures.
- Increasing government initiatives to combat counterfeiting in key economies like China and India are stimulating market growth.
- Robust manufacturing sector leads to cost-effective anti-counterfeit solutions.
Dominance Analysis: The Asia-Pacific region's dominance is attributable to its large population, high consumer spending, and increasing awareness of counterfeiting issues. The region's large and diverse manufacturing base also contributes to its leading position in the anti-counterfeit market.
Anti-counterfeit Product Developments
Recent innovations include advanced cryptographic techniques integrated into packaging, AI-powered authentication apps, and the use of blockchain for supply chain traceability. These advancements provide enhanced security features, improved consumer experience, and greater brand protection, establishing a competitive edge for businesses in this dynamic landscape.
Challenges in the Anti-Counterfeit Market
The anti-counterfeit market faces several challenges, including regulatory inconsistencies across different jurisdictions, complex and fragmented supply chains making tracing difficult, and intense competition among solution providers. These factors can significantly impact market growth and adoption rates, leading to a potential loss of $XX billion in revenue annually.
Forces Driving Anti-counterfeit Growth
Key growth drivers include the increasing sophistication of counterfeiting techniques necessitating advanced solutions, the rising consumer demand for authentic products, and supportive government regulations creating a conducive environment for innovation and adoption of anti-counterfeit technologies. Furthermore, the growing adoption of e-commerce presents both a challenge and an opportunity for innovation.
Long-Term Growth Catalysts
Long-term growth will be fueled by continued technological innovations, strategic partnerships between technology providers and brand owners, and the expansion of anti-counterfeit solutions into new markets and sectors. These collaborative efforts will strengthen the efficacy and reach of anti-counterfeit measures, fostering sustainable market growth.
Emerging Opportunities in Anti-counterfeit
Emerging opportunities lie in the application of advanced technologies like IoT and AI in supply chain management, personalized anti-counterfeit solutions tailored to specific industries, and the integration of anti-counterfeit measures with existing product packaging. These areas present significant potential for market expansion and innovation.
Leading Players in the Anti-counterfeit Sector
- Autentix, Inc.
- CCL Industries Inc.
- Avery Dennison Corporation
- 3M Company
- Sicpa Holding SA
- Alpvision S.A.
- DowDuPont (Note: DowDuPont has since split into Dow Inc. and DuPont de Nemours Inc.)
- Applied DNA Sciences Inc.
- Zebra Technologies Corporation
- Savi Technology, Inc.
Key Milestones in Anti-counterfeit Industry
- 2020: Increased adoption of blockchain technology for supply chain traceability.
- 2021: Launch of several AI-powered authentication mobile applications.
- 2022: Significant investments in R&D for advanced digital watermarking techniques.
- 2023: Several key mergers and acquisitions reshape the market landscape.
- 2024: Growing adoption of digital authentication technologies in the pharmaceutical industry.
Strategic Outlook for Anti-counterfeit Market
The anti-counterfeit market holds immense potential for future growth, driven by ongoing technological advancements, increasing consumer awareness, and stringent regulatory measures. Strategic partnerships, focused innovation, and expansion into new and emerging markets will be crucial for companies seeking to capitalize on this significant opportunity and contribute towards reducing the substantial economic losses caused by counterfeit goods.
Anti-counterfeit Segmentation
-
1. Application
- 1.1. Food & Beverages
- 1.2. Healthcare & Pharmaceuticals
- 1.3. Industrial & Automotive
- 1.4. Consumer Products
- 1.5. Clothing & Accessories
-
2. Types
- 2.1. Coding & Printing
- 2.2. RFID
- 2.3. Holograms
- 2.4. Security Labels
- 2.5. Packaging Designs
Anti-counterfeit Segmentation By Geography
-
1. North America
- 1.1. United States
- 1.2. Canada
- 1.3. Mexico
-
2. South America
- 2.1. Brazil
- 2.2. Argentina
- 2.3. Rest of South America
-
3. Europe
- 3.1. United Kingdom
- 3.2. Germany
- 3.3. France
- 3.4. Italy
- 3.5. Spain
- 3.6. Russia
- 3.7. Benelux
- 3.8. Nordics
- 3.9. Rest of Europe
-
4. Middle East & Africa
- 4.1. Turkey
- 4.2. Israel
- 4.3. GCC
- 4.4. North Africa
- 4.5. South Africa
- 4.6. Rest of Middle East & Africa
-
5. Asia Pacific
- 5.1. China
- 5.2. India
- 5.3. Japan
- 5.4. South Korea
- 5.5. ASEAN
- 5.6. Oceania
- 5.7. Rest of Asia Pacific

Anti-counterfeit Regional Market Share
Geographic Coverage of Anti-counterfeit
Anti-counterfeit REPORT HIGHLIGHTS
| Aspects | Details |
|---|---|
| Study Period | 2020-2034 |
| Base Year | 2025 |
| Estimated Year | 2026 |
| Forecast Period | 2026-2034 |
| Historical Period | 2020-2025 |
| Growth Rate | CAGR of 8.4% from 2020-2034 |
| Segmentation |
|
Table of Contents
- 1. Introduction
- 1.1. Research Scope
- 1.2. Market Segmentation
- 1.3. Research Methodology
- 1.4. Definitions and Assumptions
- 2. Executive Summary
- 2.1. Introduction
- 3. Market Dynamics
- 3.1. Introduction
- 3.2. Market Drivers
- 3.3. Market Restrains
- 3.4. Market Trends
- 4. Market Factor Analysis
- 4.1. Porters Five Forces
- 4.2. Supply/Value Chain
- 4.3. PESTEL analysis
- 4.4. Market Entropy
- 4.5. Patent/Trademark Analysis
- 5. Global Anti-counterfeit Analysis, Insights and Forecast, 2020-2032
- 5.1. Market Analysis, Insights and Forecast - by Application
- 5.1.1. Food & Beverages
- 5.1.2. Healthcare & Pharmaceuticals
- 5.1.3. Industrial & Automotive
- 5.1.4. Consumer Products
- 5.1.5. Clothing & Accessories
- 5.2. Market Analysis, Insights and Forecast - by Types
- 5.2.1. Coding & Printing
- 5.2.2. RFID
- 5.2.3. Holograms
- 5.2.4. Security Labels
- 5.2.5. Packaging Designs
- 5.3. Market Analysis, Insights and Forecast - by Region
- 5.3.1. North America
- 5.3.2. South America
- 5.3.3. Europe
- 5.3.4. Middle East & Africa
- 5.3.5. Asia Pacific
- 5.1. Market Analysis, Insights and Forecast - by Application
- 6. North America Anti-counterfeit Analysis, Insights and Forecast, 2020-2032
- 6.1. Market Analysis, Insights and Forecast - by Application
- 6.1.1. Food & Beverages
- 6.1.2. Healthcare & Pharmaceuticals
- 6.1.3. Industrial & Automotive
- 6.1.4. Consumer Products
- 6.1.5. Clothing & Accessories
- 6.2. Market Analysis, Insights and Forecast - by Types
- 6.2.1. Coding & Printing
- 6.2.2. RFID
- 6.2.3. Holograms
- 6.2.4. Security Labels
- 6.2.5. Packaging Designs
- 6.1. Market Analysis, Insights and Forecast - by Application
- 7. South America Anti-counterfeit Analysis, Insights and Forecast, 2020-2032
- 7.1. Market Analysis, Insights and Forecast - by Application
- 7.1.1. Food & Beverages
- 7.1.2. Healthcare & Pharmaceuticals
- 7.1.3. Industrial & Automotive
- 7.1.4. Consumer Products
- 7.1.5. Clothing & Accessories
- 7.2. Market Analysis, Insights and Forecast - by Types
- 7.2.1. Coding & Printing
- 7.2.2. RFID
- 7.2.3. Holograms
- 7.2.4. Security Labels
- 7.2.5. Packaging Designs
- 7.1. Market Analysis, Insights and Forecast - by Application
- 8. Europe Anti-counterfeit Analysis, Insights and Forecast, 2020-2032
- 8.1. Market Analysis, Insights and Forecast - by Application
- 8.1.1. Food & Beverages
- 8.1.2. Healthcare & Pharmaceuticals
- 8.1.3. Industrial & Automotive
- 8.1.4. Consumer Products
- 8.1.5. Clothing & Accessories
- 8.2. Market Analysis, Insights and Forecast - by Types
- 8.2.1. Coding & Printing
- 8.2.2. RFID
- 8.2.3. Holograms
- 8.2.4. Security Labels
- 8.2.5. Packaging Designs
- 8.1. Market Analysis, Insights and Forecast - by Application
- 9. Middle East & Africa Anti-counterfeit Analysis, Insights and Forecast, 2020-2032
- 9.1. Market Analysis, Insights and Forecast - by Application
- 9.1.1. Food & Beverages
- 9.1.2. Healthcare & Pharmaceuticals
- 9.1.3. Industrial & Automotive
- 9.1.4. Consumer Products
- 9.1.5. Clothing & Accessories
- 9.2. Market Analysis, Insights and Forecast - by Types
- 9.2.1. Coding & Printing
- 9.2.2. RFID
- 9.2.3. Holograms
- 9.2.4. Security Labels
- 9.2.5. Packaging Designs
- 9.1. Market Analysis, Insights and Forecast - by Application
- 10. Asia Pacific Anti-counterfeit Analysis, Insights and Forecast, 2020-2032
- 10.1. Market Analysis, Insights and Forecast - by Application
- 10.1.1. Food & Beverages
- 10.1.2. Healthcare & Pharmaceuticals
- 10.1.3. Industrial & Automotive
- 10.1.4. Consumer Products
- 10.1.5. Clothing & Accessories
- 10.2. Market Analysis, Insights and Forecast - by Types
- 10.2.1. Coding & Printing
- 10.2.2. RFID
- 10.2.3. Holograms
- 10.2.4. Security Labels
- 10.2.5. Packaging Designs
- 10.1. Market Analysis, Insights and Forecast - by Application
- 11. Competitive Analysis
- 11.1. Global Market Share Analysis 2025
- 11.2. Company Profiles
- 11.2.1 Autentix
- 11.2.1.1. Overview
- 11.2.1.2. Products
- 11.2.1.3. SWOT Analysis
- 11.2.1.4. Recent Developments
- 11.2.1.5. Financials (Based on Availability)
- 11.2.2 Inc.
- 11.2.2.1. Overview
- 11.2.2.2. Products
- 11.2.2.3. SWOT Analysis
- 11.2.2.4. Recent Developments
- 11.2.2.5. Financials (Based on Availability)
- 11.2.3 CCL Industries Inc.
- 11.2.3.1. Overview
- 11.2.3.2. Products
- 11.2.3.3. SWOT Analysis
- 11.2.3.4. Recent Developments
- 11.2.3.5. Financials (Based on Availability)
- 11.2.4 Avery Dennison Corporation
- 11.2.4.1. Overview
- 11.2.4.2. Products
- 11.2.4.3. SWOT Analysis
- 11.2.4.4. Recent Developments
- 11.2.4.5. Financials (Based on Availability)
- 11.2.5 3M Company
- 11.2.5.1. Overview
- 11.2.5.2. Products
- 11.2.5.3. SWOT Analysis
- 11.2.5.4. Recent Developments
- 11.2.5.5. Financials (Based on Availability)
- 11.2.6 Sicpa Holding SA
- 11.2.6.1. Overview
- 11.2.6.2. Products
- 11.2.6.3. SWOT Analysis
- 11.2.6.4. Recent Developments
- 11.2.6.5. Financials (Based on Availability)
- 11.2.7 Alpvision S.A.
- 11.2.7.1. Overview
- 11.2.7.2. Products
- 11.2.7.3. SWOT Analysis
- 11.2.7.4. Recent Developments
- 11.2.7.5. Financials (Based on Availability)
- 11.2.8 DowDuPont
- 11.2.8.1. Overview
- 11.2.8.2. Products
- 11.2.8.3. SWOT Analysis
- 11.2.8.4. Recent Developments
- 11.2.8.5. Financials (Based on Availability)
- 11.2.9 Applied DNA Sciences Inc.
- 11.2.9.1. Overview
- 11.2.9.2. Products
- 11.2.9.3. SWOT Analysis
- 11.2.9.4. Recent Developments
- 11.2.9.5. Financials (Based on Availability)
- 11.2.10 Zebra Technologies Corporation
- 11.2.10.1. Overview
- 11.2.10.2. Products
- 11.2.10.3. SWOT Analysis
- 11.2.10.4. Recent Developments
- 11.2.10.5. Financials (Based on Availability)
- 11.2.11 Savi Technology
- 11.2.11.1. Overview
- 11.2.11.2. Products
- 11.2.11.3. SWOT Analysis
- 11.2.11.4. Recent Developments
- 11.2.11.5. Financials (Based on Availability)
- 11.2.12 Inc.
- 11.2.12.1. Overview
- 11.2.12.2. Products
- 11.2.12.3. SWOT Analysis
- 11.2.12.4. Recent Developments
- 11.2.12.5. Financials (Based on Availability)
- 11.2.1 Autentix
List of Figures
- Figure 1: Global Anti-counterfeit Revenue Breakdown (million, %) by Region 2025 & 2033
- Figure 2: North America Anti-counterfeit Revenue (million), by Application 2025 & 2033
- Figure 3: North America Anti-counterfeit Revenue Share (%), by Application 2025 & 2033
- Figure 4: North America Anti-counterfeit Revenue (million), by Types 2025 & 2033
- Figure 5: North America Anti-counterfeit Revenue Share (%), by Types 2025 & 2033
- Figure 6: North America Anti-counterfeit Revenue (million), by Country 2025 & 2033
- Figure 7: North America Anti-counterfeit Revenue Share (%), by Country 2025 & 2033
- Figure 8: South America Anti-counterfeit Revenue (million), by Application 2025 & 2033
- Figure 9: South America Anti-counterfeit Revenue Share (%), by Application 2025 & 2033
- Figure 10: South America Anti-counterfeit Revenue (million), by Types 2025 & 2033
- Figure 11: South America Anti-counterfeit Revenue Share (%), by Types 2025 & 2033
- Figure 12: South America Anti-counterfeit Revenue (million), by Country 2025 & 2033
- Figure 13: South America Anti-counterfeit Revenue Share (%), by Country 2025 & 2033
- Figure 14: Europe Anti-counterfeit Revenue (million), by Application 2025 & 2033
- Figure 15: Europe Anti-counterfeit Revenue Share (%), by Application 2025 & 2033
- Figure 16: Europe Anti-counterfeit Revenue (million), by Types 2025 & 2033
- Figure 17: Europe Anti-counterfeit Revenue Share (%), by Types 2025 & 2033
- Figure 18: Europe Anti-counterfeit Revenue (million), by Country 2025 & 2033
- Figure 19: Europe Anti-counterfeit Revenue Share (%), by Country 2025 & 2033
- Figure 20: Middle East & Africa Anti-counterfeit Revenue (million), by Application 2025 & 2033
- Figure 21: Middle East & Africa Anti-counterfeit Revenue Share (%), by Application 2025 & 2033
- Figure 22: Middle East & Africa Anti-counterfeit Revenue (million), by Types 2025 & 2033
- Figure 23: Middle East & Africa Anti-counterfeit Revenue Share (%), by Types 2025 & 2033
- Figure 24: Middle East & Africa Anti-counterfeit Revenue (million), by Country 2025 & 2033
- Figure 25: Middle East & Africa Anti-counterfeit Revenue Share (%), by Country 2025 & 2033
- Figure 26: Asia Pacific Anti-counterfeit Revenue (million), by Application 2025 & 2033
- Figure 27: Asia Pacific Anti-counterfeit Revenue Share (%), by Application 2025 & 2033
- Figure 28: Asia Pacific Anti-counterfeit Revenue (million), by Types 2025 & 2033
- Figure 29: Asia Pacific Anti-counterfeit Revenue Share (%), by Types 2025 & 2033
- Figure 30: Asia Pacific Anti-counterfeit Revenue (million), by Country 2025 & 2033
- Figure 31: Asia Pacific Anti-counterfeit Revenue Share (%), by Country 2025 & 2033
List of Tables
- Table 1: Global Anti-counterfeit Revenue million Forecast, by Application 2020 & 2033
- Table 2: Global Anti-counterfeit Revenue million Forecast, by Types 2020 & 2033
- Table 3: Global Anti-counterfeit Revenue million Forecast, by Region 2020 & 2033
- Table 4: Global Anti-counterfeit Revenue million Forecast, by Application 2020 & 2033
- Table 5: Global Anti-counterfeit Revenue million Forecast, by Types 2020 & 2033
- Table 6: Global Anti-counterfeit Revenue million Forecast, by Country 2020 & 2033
- Table 7: United States Anti-counterfeit Revenue (million) Forecast, by Application 2020 & 2033
- Table 8: Canada Anti-counterfeit Revenue (million) Forecast, by Application 2020 & 2033
- Table 9: Mexico Anti-counterfeit Revenue (million) Forecast, by Application 2020 & 2033
- Table 10: Global Anti-counterfeit Revenue million Forecast, by Application 2020 & 2033
- Table 11: Global Anti-counterfeit Revenue million Forecast, by Types 2020 & 2033
- Table 12: Global Anti-counterfeit Revenue million Forecast, by Country 2020 & 2033
- Table 13: Brazil Anti-counterfeit Revenue (million) Forecast, by Application 2020 & 2033
- Table 14: Argentina Anti-counterfeit Revenue (million) Forecast, by Application 2020 & 2033
- Table 15: Rest of South America Anti-counterfeit Revenue (million) Forecast, by Application 2020 & 2033
- Table 16: Global Anti-counterfeit Revenue million Forecast, by Application 2020 & 2033
- Table 17: Global Anti-counterfeit Revenue million Forecast, by Types 2020 & 2033
- Table 18: Global Anti-counterfeit Revenue million Forecast, by Country 2020 & 2033
- Table 19: United Kingdom Anti-counterfeit Revenue (million) Forecast, by Application 2020 & 2033
- Table 20: Germany Anti-counterfeit Revenue (million) Forecast, by Application 2020 & 2033
- Table 21: France Anti-counterfeit Revenue (million) Forecast, by Application 2020 & 2033
- Table 22: Italy Anti-counterfeit Revenue (million) Forecast, by Application 2020 & 2033
- Table 23: Spain Anti-counterfeit Revenue (million) Forecast, by Application 2020 & 2033
- Table 24: Russia Anti-counterfeit Revenue (million) Forecast, by Application 2020 & 2033
- Table 25: Benelux Anti-counterfeit Revenue (million) Forecast, by Application 2020 & 2033
- Table 26: Nordics Anti-counterfeit Revenue (million) Forecast, by Application 2020 & 2033
- Table 27: Rest of Europe Anti-counterfeit Revenue (million) Forecast, by Application 2020 & 2033
- Table 28: Global Anti-counterfeit Revenue million Forecast, by Application 2020 & 2033
- Table 29: Global Anti-counterfeit Revenue million Forecast, by Types 2020 & 2033
- Table 30: Global Anti-counterfeit Revenue million Forecast, by Country 2020 & 2033
- Table 31: Turkey Anti-counterfeit Revenue (million) Forecast, by Application 2020 & 2033
- Table 32: Israel Anti-counterfeit Revenue (million) Forecast, by Application 2020 & 2033
- Table 33: GCC Anti-counterfeit Revenue (million) Forecast, by Application 2020 & 2033
- Table 34: North Africa Anti-counterfeit Revenue (million) Forecast, by Application 2020 & 2033
- Table 35: South Africa Anti-counterfeit Revenue (million) Forecast, by Application 2020 & 2033
- Table 36: Rest of Middle East & Africa Anti-counterfeit Revenue (million) Forecast, by Application 2020 & 2033
- Table 37: Global Anti-counterfeit Revenue million Forecast, by Application 2020 & 2033
- Table 38: Global Anti-counterfeit Revenue million Forecast, by Types 2020 & 2033
- Table 39: Global Anti-counterfeit Revenue million Forecast, by Country 2020 & 2033
- Table 40: China Anti-counterfeit Revenue (million) Forecast, by Application 2020 & 2033
- Table 41: India Anti-counterfeit Revenue (million) Forecast, by Application 2020 & 2033
- Table 42: Japan Anti-counterfeit Revenue (million) Forecast, by Application 2020 & 2033
- Table 43: South Korea Anti-counterfeit Revenue (million) Forecast, by Application 2020 & 2033
- Table 44: ASEAN Anti-counterfeit Revenue (million) Forecast, by Application 2020 & 2033
- Table 45: Oceania Anti-counterfeit Revenue (million) Forecast, by Application 2020 & 2033
- Table 46: Rest of Asia Pacific Anti-counterfeit Revenue (million) Forecast, by Application 2020 & 2033
Frequently Asked Questions
1. What is the projected Compound Annual Growth Rate (CAGR) of the Anti-counterfeit?
The projected CAGR is approximately 8.4%.
2. Which companies are prominent players in the Anti-counterfeit?
Key companies in the market include Autentix, Inc., CCL Industries Inc., Avery Dennison Corporation, 3M Company, Sicpa Holding SA, Alpvision S.A., DowDuPont, Applied DNA Sciences Inc., Zebra Technologies Corporation, Savi Technology, Inc..
3. What are the main segments of the Anti-counterfeit?
The market segments include Application, Types.
4. Can you provide details about the market size?
The market size is estimated to be USD 111880 million as of 2022.
5. What are some drivers contributing to market growth?
N/A
6. What are the notable trends driving market growth?
N/A
7. Are there any restraints impacting market growth?
N/A
8. Can you provide examples of recent developments in the market?
N/A
9. What pricing options are available for accessing the report?
Pricing options include single-user, multi-user, and enterprise licenses priced at USD 4900.00, USD 7350.00, and USD 9800.00 respectively.
10. Is the market size provided in terms of value or volume?
The market size is provided in terms of value, measured in million.
11. Are there any specific market keywords associated with the report?
Yes, the market keyword associated with the report is "Anti-counterfeit," which aids in identifying and referencing the specific market segment covered.
12. How do I determine which pricing option suits my needs best?
The pricing options vary based on user requirements and access needs. Individual users may opt for single-user licenses, while businesses requiring broader access may choose multi-user or enterprise licenses for cost-effective access to the report.
13. Are there any additional resources or data provided in the Anti-counterfeit report?
While the report offers comprehensive insights, it's advisable to review the specific contents or supplementary materials provided to ascertain if additional resources or data are available.
14. How can I stay updated on further developments or reports in the Anti-counterfeit?
To stay informed about further developments, trends, and reports in the Anti-counterfeit, consider subscribing to industry newsletters, following relevant companies and organizations, or regularly checking reputable industry news sources and publications.
Methodology
Step 1 - Identification of Relevant Samples Size from Population Database


Step 2 - Approaches for Defining Global Market Size (Value, Volume* & Price*)

Note*: In applicable scenarios
Step 3 - Data Sources
Primary Research
- Web Analytics
- Survey Reports
- Research Institute
- Latest Research Reports
- Opinion Leaders
Secondary Research
- Annual Reports
- White Paper
- Latest Press Release
- Industry Association
- Paid Database
- Investor Presentations

Step 4 - Data Triangulation
Involves using different sources of information in order to increase the validity of a study
These sources are likely to be stakeholders in a program - participants, other researchers, program staff, other community members, and so on.
Then we put all data in single framework & apply various statistical tools to find out the dynamic on the market.
During the analysis stage, feedback from the stakeholder groups would be compared to determine areas of agreement as well as areas of divergence