
Key Insights
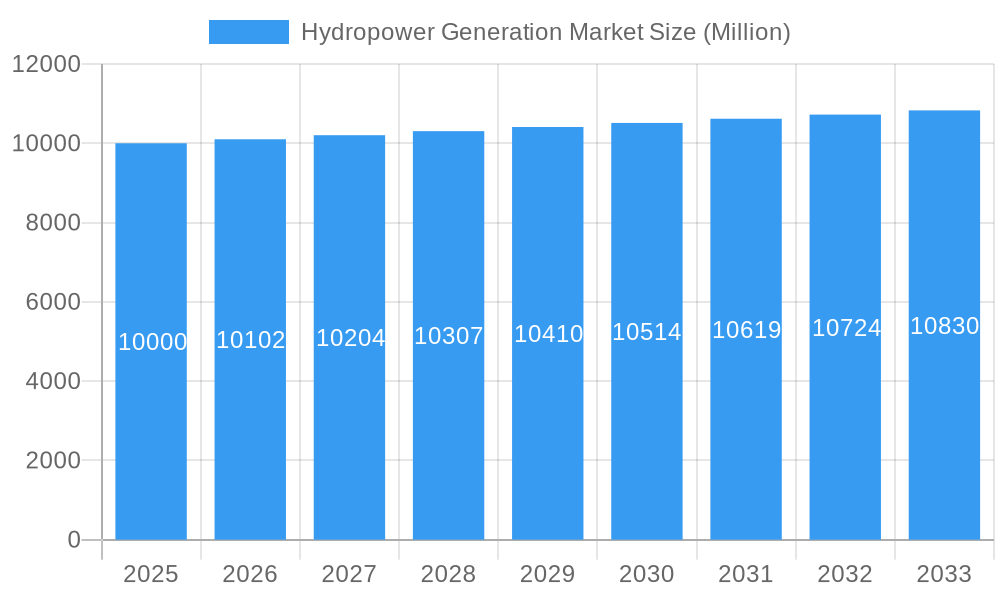
The global hydropower generation market is projected for steady expansion, with an estimated market size of $116.09 billion in 2025. The market is expected to grow at a compound annual growth rate (CAGR) of 0.99% through 2033, driven by the escalating demand for renewable energy and supportive government policies for sustainable power. Key growth catalysts include the imperative to reduce carbon emissions, the cost-effectiveness of hydropower operations, and the increasing reliability of existing facilities. However, challenges such as substantial upfront investment for new projects, environmental considerations linked to dam construction, and site-specific geographical constraints may temper growth. The market is segmented by plant capacity, with large-scale hydropower plants (over 100 MW) holding the largest share, followed by medium (10-100 MW) and small (<10 MW) plants. Asia Pacific is anticipated to lead market growth, fueled by rising energy needs and infrastructure development in countries like China and India. North America and Europe will experience moderate growth through modernization and renewable energy incentives. Key industry participants, including Iberdrola SA and China Yangtze Power Co Ltd, are focused on technological innovation, project execution, and strategic global expansion.
Hydropower Generation Market Market Size (In Billion)
The competitive environment features established leaders and new entrants prioritizing advanced technologies and sustainable practices. Innovations in turbine design and energy storage are enhancing hydropower efficiency. The integration of smart grid technologies and digitalization further optimizes grid performance. Market dynamics will be shaped by project financing, evolving environmental regulations, and the development of novel hydropower solutions. The emphasis on sustainable development and hydropower's role in a diversified energy portfolio will continue to drive market expansion. Responsible development necessitates careful attention to environmental stewardship and community engagement.
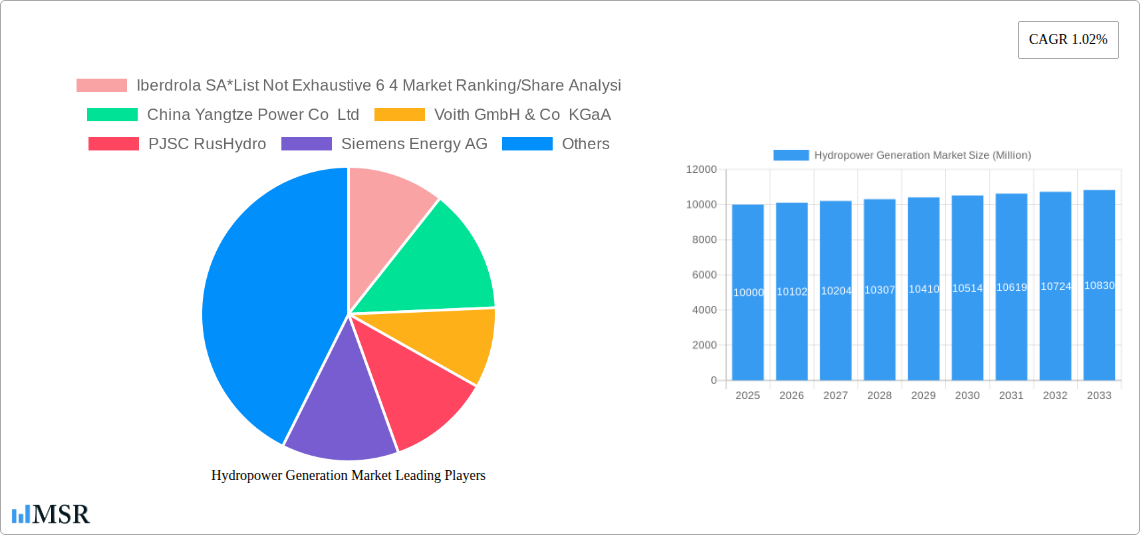
Hydropower Generation Market Company Market Share
Hydropower Generation Market: A Comprehensive Report (2019-2033)
This in-depth report provides a comprehensive analysis of the global hydropower generation market, offering invaluable insights for industry stakeholders, investors, and strategic decision-makers. The report covers market dynamics, key segments, leading players, emerging trends, and future growth prospects, using data from the historical period (2019-2024), base year (2025), and forecast period (2025-2033). The total market size is projected to reach xx Million by 2033, showcasing significant growth opportunities.
Hydropower Generation Market Concentration & Dynamics
This section delves into the competitive landscape of the hydropower generation market, examining market concentration, innovation, regulatory influences, and market forces. We analyze the market share of key players, including Iberdrola SA, China Yangtze Power Co Ltd, Voith GmbH & Co KGaA, PJSC RusHydro, Siemens Energy AG, GE Renewable Energy, Andritz AG, and Électricité de France SA (EDF), and explore the impact of mergers and acquisitions (M&A) activities. The market is characterized by a moderate level of concentration, with the top six players holding an estimated 40% market share in 2025.
- Market Concentration: The top 6 companies hold approximately 40% of the market share, indicating a moderately concentrated market.
- Innovation Ecosystems: Significant investments in R&D drive advancements in turbine technology, energy storage, and grid integration.
- Regulatory Frameworks: Varying regulations across regions influence project development and timelines, impacting market growth.
- Substitute Products: Competition from other renewable energy sources, such as solar and wind power, influences hydropower market growth.
- End-User Trends: Growing demand for clean energy and sustainable power solutions fuels the adoption of hydropower.
- M&A Activities: The number of M&A deals in the hydropower sector averaged approximately xx per year during the historical period (2019-2024), indicating a moderate level of consolidation.
Hydropower Generation Market Industry Insights & Trends
This section analyzes the key drivers and trends shaping the hydropower generation market. The market is experiencing robust growth, driven by increasing energy demand, government support for renewable energy, and technological advancements. The market size is projected to grow at a Compound Annual Growth Rate (CAGR) of xx% during the forecast period (2025-2033), reaching an estimated xx Million by 2033. Technological advancements, such as improved turbine designs and smart grid integration, are enhancing efficiency and optimizing energy production. Consumer behavior is shifting towards sustainable energy choices, further fueling demand for hydropower.
Key Markets & Segments Leading Hydropower Generation Market
This section identifies the dominant regions, countries, and segments within the hydropower generation market. The Large Hydropower segment (greater than 100 MW) is currently the largest, driven by large-scale infrastructure projects in developing countries.
- Large Hydropower (Greater Than 100 MW): Dominant segment driven by substantial power generation capacity and economies of scale.
- Drivers: Large-scale infrastructure projects, government incentives, and energy security concerns.
- Small Hydropower (Smaller Than 10 MW): Growing segment due to decentralized energy generation and suitability for remote areas.
- Drivers: Decentralized energy generation, off-grid solutions, and suitability for smaller communities.
- Other Sizes (10-100 MW): This segment is showing steady growth, bridging the gap between smaller and larger projects.
- Drivers: Balance of cost-effectiveness and capacity, suitable for various geographical locations.
The Asia-Pacific region currently holds the largest market share, followed by North America and Europe, driven by robust economic growth, supportive government policies, and substantial investments in renewable energy infrastructure.
Hydropower Generation Market Product Developments
Recent years have witnessed significant advancements in hydropower technology. Innovations in turbine design, including the development of more efficient and durable turbines, have improved energy conversion efficiency and reduced operational costs. Furthermore, advancements in smart grid integration and digital monitoring systems enhance grid stability and optimize energy distribution. These technological advancements provide a significant competitive edge for manufacturers and operators in the hydropower generation market.
Challenges in the Hydropower Generation Market Market
The hydropower generation market faces various challenges, including regulatory hurdles that can delay project approvals, supply chain disruptions impacting project timelines and costs, and intense competition from other renewable energy sources. These factors can significantly impact market growth and profitability. The environmental impact of large hydropower projects also presents a significant challenge, leading to increased scrutiny and potentially stricter regulations.
Forces Driving Hydropower Generation Market Growth
Several factors are driving the growth of the hydropower generation market. The increasing global demand for clean and sustainable energy, coupled with supportive government policies and incentives, are significant catalysts. Technological advancements in turbine efficiency, grid integration, and energy storage solutions further enhance the attractiveness and viability of hydropower projects. Moreover, the growing awareness of climate change and the need to reduce carbon emissions are increasing the adoption of renewable energy sources, including hydropower.
Long-Term Growth Catalysts in Hydropower Generation Market
Long-term growth in the hydropower generation market is fueled by continued technological innovation, strategic partnerships between energy companies and technology providers, and expansion into new markets. Investments in research and development, focusing on improving efficiency, reducing environmental impact, and enhancing grid integration, will further drive market growth. Furthermore, exploring untapped hydropower resources in emerging economies and developing innovative financing models will unlock significant future market potential.
Emerging Opportunities in Hydropower Generation Market
Emerging opportunities in the hydropower generation market include the development of small-scale and micro-hydropower projects, advancements in pumped hydro storage technology to address intermittency issues, and the integration of hydropower with other renewable energy sources to create hybrid energy systems. The growing interest in green hydrogen production also presents a significant opportunity for hydropower to play a crucial role in sustainable energy transition.
Leading Players in the Hydropower Generation Market Sector
- Iberdrola SA
- China Yangtze Power Co Ltd
- Voith GmbH & Co KGaA
- PJSC RusHydro
- Siemens Energy AG
- GE Renewable Energy
- Andritz AG
- Électricité de France SA (EDF)
Key Milestones in Hydropower Generation Market Industry
- December 2022: Completion of the Baihetan hydropower plant in China, the country's second-largest hydropower facility, significantly increases China's hydropower capacity.
- May 2023: SJVN of India secures permission to develop a second hydropower project in Nepal, the 669 MW Lower Arun project, following the ongoing development of the 900 MW Arun-III project. This signifies increasing cross-border collaborations in the hydropower sector.
Strategic Outlook for Hydropower Generation Market Market
The hydropower generation market exhibits significant long-term growth potential. Strategic opportunities lie in leveraging technological advancements to enhance efficiency and reduce costs, forming strategic partnerships to access new markets and resources, and proactively addressing environmental concerns to secure regulatory approvals. Focusing on sustainable development practices and integrating hydropower with other renewable energy technologies will be crucial for realizing the full potential of this market.
Hydropower Generation Market Segmentation
-
1. Size
- 1.1. Large Hydropower (Greater Than 100 MW)
- 1.2. Small Hydropower (Smaller Than 10 MW)
- 1.3. Other Sizes (10-100 MW)
Hydropower Generation Market Segmentation By Geography
-
1. North America
- 1.1. United States
- 1.2. Canada
- 1.3. Rest of North America
-
2. Europe
- 2.1. Germany
- 2.2. France
- 2.3. United Kingdom
- 2.4. Rest of Europe
-
3. Asia Pacific
- 3.1. China
- 3.2. India
- 3.3. Japan
- 3.4. South Korea
- 3.5. Rest of Asia Pacific
-
4. South America
- 4.1. Brazil
- 4.2. Argentina
- 4.3. Rest of South America
-
5. Middle East and Africa
- 5.1. Saudi Arabia
- 5.2. United Arab Emirates
- 5.3. South Africa
- 5.4. Rest of Middle East and Africa
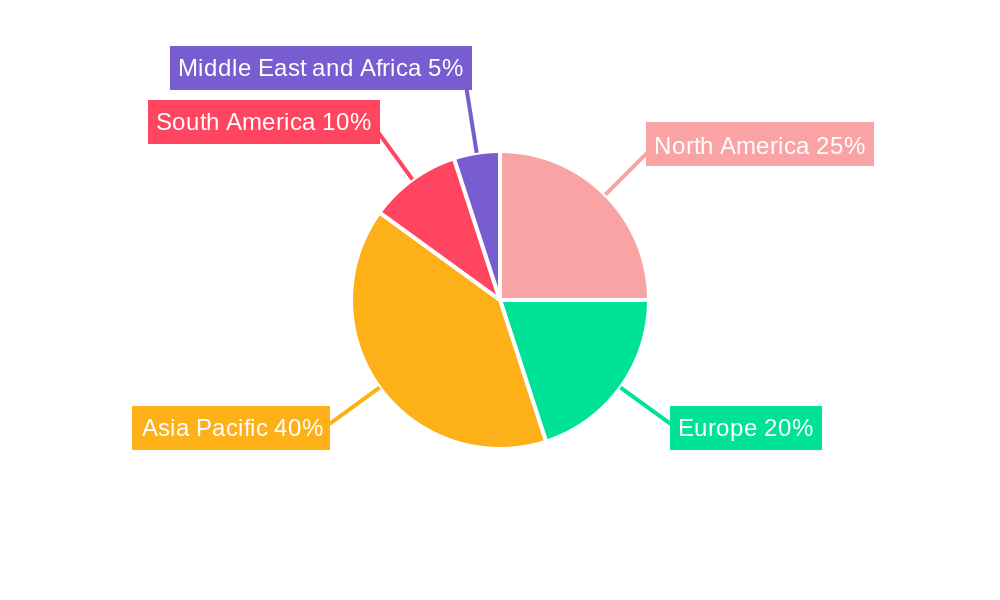
Hydropower Generation Market Regional Market Share
Geographic Coverage of Hydropower Generation Market
Hydropower Generation Market REPORT HIGHLIGHTS
| Aspects | Details |
|---|---|
| Study Period | 2020-2034 |
| Base Year | 2025 |
| Estimated Year | 2026 |
| Forecast Period | 2026-2034 |
| Historical Period | 2020-2025 |
| Growth Rate | CAGR of 0.99% from 2020-2034 |
| Segmentation |
|
Table of Contents
- 1. Introduction
- 1.1. Research Scope
- 1.2. Market Segmentation
- 1.3. Research Methodology
- 1.4. Definitions and Assumptions
- 2. Executive Summary
- 2.1. Introduction
- 3. Market Dynamics
- 3.1. Introduction
- 3.2. Market Drivers
- 3.2.1. 4.; Rising Demand for Reliable Electricity4.; Increasing Government Support for Hydropower Gneeration
- 3.3. Market Restrains
- 3.3.1. 4.; Negative Environmental Consequences of Hydropower Projects
- 3.4. Market Trends
- 3.4.1. The Large Hydropower (Greater Than 100 MW) Segment to Dominate the Market
- 4. Market Factor Analysis
- 4.1. Porters Five Forces
- 4.2. Supply/Value Chain
- 4.3. PESTEL analysis
- 4.4. Market Entropy
- 4.5. Patent/Trademark Analysis
- 5. Global Hydropower Generation Market Analysis, Insights and Forecast, 2020-2032
- 5.1. Market Analysis, Insights and Forecast - by Size
- 5.1.1. Large Hydropower (Greater Than 100 MW)
- 5.1.2. Small Hydropower (Smaller Than 10 MW)
- 5.1.3. Other Sizes (10-100 MW)
- 5.2. Market Analysis, Insights and Forecast - by Region
- 5.2.1. North America
- 5.2.2. Europe
- 5.2.3. Asia Pacific
- 5.2.4. South America
- 5.2.5. Middle East and Africa
- 5.1. Market Analysis, Insights and Forecast - by Size
- 6. North America Hydropower Generation Market Analysis, Insights and Forecast, 2020-2032
- 6.1. Market Analysis, Insights and Forecast - by Size
- 6.1.1. Large Hydropower (Greater Than 100 MW)
- 6.1.2. Small Hydropower (Smaller Than 10 MW)
- 6.1.3. Other Sizes (10-100 MW)
- 6.1. Market Analysis, Insights and Forecast - by Size
- 7. Europe Hydropower Generation Market Analysis, Insights and Forecast, 2020-2032
- 7.1. Market Analysis, Insights and Forecast - by Size
- 7.1.1. Large Hydropower (Greater Than 100 MW)
- 7.1.2. Small Hydropower (Smaller Than 10 MW)
- 7.1.3. Other Sizes (10-100 MW)
- 7.1. Market Analysis, Insights and Forecast - by Size
- 8. Asia Pacific Hydropower Generation Market Analysis, Insights and Forecast, 2020-2032
- 8.1. Market Analysis, Insights and Forecast - by Size
- 8.1.1. Large Hydropower (Greater Than 100 MW)
- 8.1.2. Small Hydropower (Smaller Than 10 MW)
- 8.1.3. Other Sizes (10-100 MW)
- 8.1. Market Analysis, Insights and Forecast - by Size
- 9. South America Hydropower Generation Market Analysis, Insights and Forecast, 2020-2032
- 9.1. Market Analysis, Insights and Forecast - by Size
- 9.1.1. Large Hydropower (Greater Than 100 MW)
- 9.1.2. Small Hydropower (Smaller Than 10 MW)
- 9.1.3. Other Sizes (10-100 MW)
- 9.1. Market Analysis, Insights and Forecast - by Size
- 10. Middle East and Africa Hydropower Generation Market Analysis, Insights and Forecast, 2020-2032
- 10.1. Market Analysis, Insights and Forecast - by Size
- 10.1.1. Large Hydropower (Greater Than 100 MW)
- 10.1.2. Small Hydropower (Smaller Than 10 MW)
- 10.1.3. Other Sizes (10-100 MW)
- 10.1. Market Analysis, Insights and Forecast - by Size
- 11. North America Hydropower Generation Market Analysis, Insights and Forecast, 2020-2032
- 11.1. Market Analysis, Insights and Forecast - By Country/Sub-region
- 11.1.1 United States
- 11.1.2 Canada
- 11.1.3 Rest of North America
- 12. Europe Hydropower Generation Market Analysis, Insights and Forecast, 2020-2032
- 12.1. Market Analysis, Insights and Forecast - By Country/Sub-region
- 12.1.1 Germany
- 12.1.2 France
- 12.1.3 United Kingdom
- 12.1.4 Rest of Europe
- 13. Asia Pacific Hydropower Generation Market Analysis, Insights and Forecast, 2020-2032
- 13.1. Market Analysis, Insights and Forecast - By Country/Sub-region
- 13.1.1 China
- 13.1.2 India
- 13.1.3 Japan
- 13.1.4 South Korea
- 13.1.5 Rest of Asia Pacific
- 14. South America Hydropower Generation Market Analysis, Insights and Forecast, 2020-2032
- 14.1. Market Analysis, Insights and Forecast - By Country/Sub-region
- 14.1.1 Brazil
- 14.1.2 Argentina
- 14.1.3 Rest of South America
- 15. Middle East and Africa Hydropower Generation Market Analysis, Insights and Forecast, 2020-2032
- 15.1. Market Analysis, Insights and Forecast - By Country/Sub-region
- 15.1.1 Saudi Arabia
- 15.1.2 United Arab Emirates
- 15.1.3 South Africa
- 15.1.4 Rest of Middle East and Africa
- 16. Competitive Analysis
- 16.1. Global Market Share Analysis 2025
- 16.2. Company Profiles
- 16.2.1 Iberdrola SA*List Not Exhaustive 6 4 Market Ranking/Share Analysi
- 16.2.1.1. Overview
- 16.2.1.2. Products
- 16.2.1.3. SWOT Analysis
- 16.2.1.4. Recent Developments
- 16.2.1.5. Financials (Based on Availability)
- 16.2.2 China Yangtze Power Co Ltd
- 16.2.2.1. Overview
- 16.2.2.2. Products
- 16.2.2.3. SWOT Analysis
- 16.2.2.4. Recent Developments
- 16.2.2.5. Financials (Based on Availability)
- 16.2.3 Voith GmbH & Co KGaA
- 16.2.3.1. Overview
- 16.2.3.2. Products
- 16.2.3.3. SWOT Analysis
- 16.2.3.4. Recent Developments
- 16.2.3.5. Financials (Based on Availability)
- 16.2.4 PJSC RusHydro
- 16.2.4.1. Overview
- 16.2.4.2. Products
- 16.2.4.3. SWOT Analysis
- 16.2.4.4. Recent Developments
- 16.2.4.5. Financials (Based on Availability)
- 16.2.5 Siemens Energy AG
- 16.2.5.1. Overview
- 16.2.5.2. Products
- 16.2.5.3. SWOT Analysis
- 16.2.5.4. Recent Developments
- 16.2.5.5. Financials (Based on Availability)
- 16.2.6 GE Renewable Energy
- 16.2.6.1. Overview
- 16.2.6.2. Products
- 16.2.6.3. SWOT Analysis
- 16.2.6.4. Recent Developments
- 16.2.6.5. Financials (Based on Availability)
- 16.2.7 Andritz AG
- 16.2.7.1. Overview
- 16.2.7.2. Products
- 16.2.7.3. SWOT Analysis
- 16.2.7.4. Recent Developments
- 16.2.7.5. Financials (Based on Availability)
- 16.2.8 Électricité de France SA (EDF)
- 16.2.8.1. Overview
- 16.2.8.2. Products
- 16.2.8.3. SWOT Analysis
- 16.2.8.4. Recent Developments
- 16.2.8.5. Financials (Based on Availability)
- 16.2.1 Iberdrola SA*List Not Exhaustive 6 4 Market Ranking/Share Analysi
List of Figures
- Figure 1: Global Hydropower Generation Market Revenue Breakdown (billion, %) by Region 2025 & 2033
- Figure 2: Global Hydropower Generation Market Volume Breakdown (terawatt, %) by Region 2025 & 2033
- Figure 3: North America Hydropower Generation Market Revenue (billion), by Country 2025 & 2033
- Figure 4: North America Hydropower Generation Market Volume (terawatt), by Country 2025 & 2033
- Figure 5: North America Hydropower Generation Market Revenue Share (%), by Country 2025 & 2033
- Figure 6: North America Hydropower Generation Market Volume Share (%), by Country 2025 & 2033
- Figure 7: Europe Hydropower Generation Market Revenue (billion), by Country 2025 & 2033
- Figure 8: Europe Hydropower Generation Market Volume (terawatt), by Country 2025 & 2033
- Figure 9: Europe Hydropower Generation Market Revenue Share (%), by Country 2025 & 2033
- Figure 10: Europe Hydropower Generation Market Volume Share (%), by Country 2025 & 2033
- Figure 11: Asia Pacific Hydropower Generation Market Revenue (billion), by Country 2025 & 2033
- Figure 12: Asia Pacific Hydropower Generation Market Volume (terawatt), by Country 2025 & 2033
- Figure 13: Asia Pacific Hydropower Generation Market Revenue Share (%), by Country 2025 & 2033
- Figure 14: Asia Pacific Hydropower Generation Market Volume Share (%), by Country 2025 & 2033
- Figure 15: South America Hydropower Generation Market Revenue (billion), by Country 2025 & 2033
- Figure 16: South America Hydropower Generation Market Volume (terawatt), by Country 2025 & 2033
- Figure 17: South America Hydropower Generation Market Revenue Share (%), by Country 2025 & 2033
- Figure 18: South America Hydropower Generation Market Volume Share (%), by Country 2025 & 2033
- Figure 19: Middle East and Africa Hydropower Generation Market Revenue (billion), by Country 2025 & 2033
- Figure 20: Middle East and Africa Hydropower Generation Market Volume (terawatt), by Country 2025 & 2033
- Figure 21: Middle East and Africa Hydropower Generation Market Revenue Share (%), by Country 2025 & 2033
- Figure 22: Middle East and Africa Hydropower Generation Market Volume Share (%), by Country 2025 & 2033
- Figure 23: North America Hydropower Generation Market Revenue (billion), by Size 2025 & 2033
- Figure 24: North America Hydropower Generation Market Volume (terawatt), by Size 2025 & 2033
- Figure 25: North America Hydropower Generation Market Revenue Share (%), by Size 2025 & 2033
- Figure 26: North America Hydropower Generation Market Volume Share (%), by Size 2025 & 2033
- Figure 27: North America Hydropower Generation Market Revenue (billion), by Country 2025 & 2033
- Figure 28: North America Hydropower Generation Market Volume (terawatt), by Country 2025 & 2033
- Figure 29: North America Hydropower Generation Market Revenue Share (%), by Country 2025 & 2033
- Figure 30: North America Hydropower Generation Market Volume Share (%), by Country 2025 & 2033
- Figure 31: Europe Hydropower Generation Market Revenue (billion), by Size 2025 & 2033
- Figure 32: Europe Hydropower Generation Market Volume (terawatt), by Size 2025 & 2033
- Figure 33: Europe Hydropower Generation Market Revenue Share (%), by Size 2025 & 2033
- Figure 34: Europe Hydropower Generation Market Volume Share (%), by Size 2025 & 2033
- Figure 35: Europe Hydropower Generation Market Revenue (billion), by Country 2025 & 2033
- Figure 36: Europe Hydropower Generation Market Volume (terawatt), by Country 2025 & 2033
- Figure 37: Europe Hydropower Generation Market Revenue Share (%), by Country 2025 & 2033
- Figure 38: Europe Hydropower Generation Market Volume Share (%), by Country 2025 & 2033
- Figure 39: Asia Pacific Hydropower Generation Market Revenue (billion), by Size 2025 & 2033
- Figure 40: Asia Pacific Hydropower Generation Market Volume (terawatt), by Size 2025 & 2033
- Figure 41: Asia Pacific Hydropower Generation Market Revenue Share (%), by Size 2025 & 2033
- Figure 42: Asia Pacific Hydropower Generation Market Volume Share (%), by Size 2025 & 2033
- Figure 43: Asia Pacific Hydropower Generation Market Revenue (billion), by Country 2025 & 2033
- Figure 44: Asia Pacific Hydropower Generation Market Volume (terawatt), by Country 2025 & 2033
- Figure 45: Asia Pacific Hydropower Generation Market Revenue Share (%), by Country 2025 & 2033
- Figure 46: Asia Pacific Hydropower Generation Market Volume Share (%), by Country 2025 & 2033
- Figure 47: South America Hydropower Generation Market Revenue (billion), by Size 2025 & 2033
- Figure 48: South America Hydropower Generation Market Volume (terawatt), by Size 2025 & 2033
- Figure 49: South America Hydropower Generation Market Revenue Share (%), by Size 2025 & 2033
- Figure 50: South America Hydropower Generation Market Volume Share (%), by Size 2025 & 2033
- Figure 51: South America Hydropower Generation Market Revenue (billion), by Country 2025 & 2033
- Figure 52: South America Hydropower Generation Market Volume (terawatt), by Country 2025 & 2033
- Figure 53: South America Hydropower Generation Market Revenue Share (%), by Country 2025 & 2033
- Figure 54: South America Hydropower Generation Market Volume Share (%), by Country 2025 & 2033
- Figure 55: Middle East and Africa Hydropower Generation Market Revenue (billion), by Size 2025 & 2033
- Figure 56: Middle East and Africa Hydropower Generation Market Volume (terawatt), by Size 2025 & 2033
- Figure 57: Middle East and Africa Hydropower Generation Market Revenue Share (%), by Size 2025 & 2033
- Figure 58: Middle East and Africa Hydropower Generation Market Volume Share (%), by Size 2025 & 2033
- Figure 59: Middle East and Africa Hydropower Generation Market Revenue (billion), by Country 2025 & 2033
- Figure 60: Middle East and Africa Hydropower Generation Market Volume (terawatt), by Country 2025 & 2033
- Figure 61: Middle East and Africa Hydropower Generation Market Revenue Share (%), by Country 2025 & 2033
- Figure 62: Middle East and Africa Hydropower Generation Market Volume Share (%), by Country 2025 & 2033
List of Tables
- Table 1: Global Hydropower Generation Market Revenue billion Forecast, by Region 2020 & 2033
- Table 2: Global Hydropower Generation Market Volume terawatt Forecast, by Region 2020 & 2033
- Table 3: Global Hydropower Generation Market Revenue billion Forecast, by Size 2020 & 2033
- Table 4: Global Hydropower Generation Market Volume terawatt Forecast, by Size 2020 & 2033
- Table 5: Global Hydropower Generation Market Revenue billion Forecast, by Region 2020 & 2033
- Table 6: Global Hydropower Generation Market Volume terawatt Forecast, by Region 2020 & 2033
- Table 7: Global Hydropower Generation Market Revenue billion Forecast, by Country 2020 & 2033
- Table 8: Global Hydropower Generation Market Volume terawatt Forecast, by Country 2020 & 2033
- Table 9: United States Hydropower Generation Market Revenue (billion) Forecast, by Application 2020 & 2033
- Table 10: United States Hydropower Generation Market Volume (terawatt) Forecast, by Application 2020 & 2033
- Table 11: Canada Hydropower Generation Market Revenue (billion) Forecast, by Application 2020 & 2033
- Table 12: Canada Hydropower Generation Market Volume (terawatt) Forecast, by Application 2020 & 2033
- Table 13: Rest of North America Hydropower Generation Market Revenue (billion) Forecast, by Application 2020 & 2033
- Table 14: Rest of North America Hydropower Generation Market Volume (terawatt) Forecast, by Application 2020 & 2033
- Table 15: Global Hydropower Generation Market Revenue billion Forecast, by Country 2020 & 2033
- Table 16: Global Hydropower Generation Market Volume terawatt Forecast, by Country 2020 & 2033
- Table 17: Germany Hydropower Generation Market Revenue (billion) Forecast, by Application 2020 & 2033
- Table 18: Germany Hydropower Generation Market Volume (terawatt) Forecast, by Application 2020 & 2033
- Table 19: France Hydropower Generation Market Revenue (billion) Forecast, by Application 2020 & 2033
- Table 20: France Hydropower Generation Market Volume (terawatt) Forecast, by Application 2020 & 2033
- Table 21: United Kingdom Hydropower Generation Market Revenue (billion) Forecast, by Application 2020 & 2033
- Table 22: United Kingdom Hydropower Generation Market Volume (terawatt) Forecast, by Application 2020 & 2033
- Table 23: Rest of Europe Hydropower Generation Market Revenue (billion) Forecast, by Application 2020 & 2033
- Table 24: Rest of Europe Hydropower Generation Market Volume (terawatt) Forecast, by Application 2020 & 2033
- Table 25: Global Hydropower Generation Market Revenue billion Forecast, by Country 2020 & 2033
- Table 26: Global Hydropower Generation Market Volume terawatt Forecast, by Country 2020 & 2033
- Table 27: China Hydropower Generation Market Revenue (billion) Forecast, by Application 2020 & 2033
- Table 28: China Hydropower Generation Market Volume (terawatt) Forecast, by Application 2020 & 2033
- Table 29: India Hydropower Generation Market Revenue (billion) Forecast, by Application 2020 & 2033
- Table 30: India Hydropower Generation Market Volume (terawatt) Forecast, by Application 2020 & 2033
- Table 31: Japan Hydropower Generation Market Revenue (billion) Forecast, by Application 2020 & 2033
- Table 32: Japan Hydropower Generation Market Volume (terawatt) Forecast, by Application 2020 & 2033
- Table 33: South Korea Hydropower Generation Market Revenue (billion) Forecast, by Application 2020 & 2033
- Table 34: South Korea Hydropower Generation Market Volume (terawatt) Forecast, by Application 2020 & 2033
- Table 35: Rest of Asia Pacific Hydropower Generation Market Revenue (billion) Forecast, by Application 2020 & 2033
- Table 36: Rest of Asia Pacific Hydropower Generation Market Volume (terawatt) Forecast, by Application 2020 & 2033
- Table 37: Global Hydropower Generation Market Revenue billion Forecast, by Country 2020 & 2033
- Table 38: Global Hydropower Generation Market Volume terawatt Forecast, by Country 2020 & 2033
- Table 39: Brazil Hydropower Generation Market Revenue (billion) Forecast, by Application 2020 & 2033
- Table 40: Brazil Hydropower Generation Market Volume (terawatt) Forecast, by Application 2020 & 2033
- Table 41: Argentina Hydropower Generation Market Revenue (billion) Forecast, by Application 2020 & 2033
- Table 42: Argentina Hydropower Generation Market Volume (terawatt) Forecast, by Application 2020 & 2033
- Table 43: Rest of South America Hydropower Generation Market Revenue (billion) Forecast, by Application 2020 & 2033
- Table 44: Rest of South America Hydropower Generation Market Volume (terawatt) Forecast, by Application 2020 & 2033
- Table 45: Global Hydropower Generation Market Revenue billion Forecast, by Country 2020 & 2033
- Table 46: Global Hydropower Generation Market Volume terawatt Forecast, by Country 2020 & 2033
- Table 47: Saudi Arabia Hydropower Generation Market Revenue (billion) Forecast, by Application 2020 & 2033
- Table 48: Saudi Arabia Hydropower Generation Market Volume (terawatt) Forecast, by Application 2020 & 2033
- Table 49: United Arab Emirates Hydropower Generation Market Revenue (billion) Forecast, by Application 2020 & 2033
- Table 50: United Arab Emirates Hydropower Generation Market Volume (terawatt) Forecast, by Application 2020 & 2033
- Table 51: South Africa Hydropower Generation Market Revenue (billion) Forecast, by Application 2020 & 2033
- Table 52: South Africa Hydropower Generation Market Volume (terawatt) Forecast, by Application 2020 & 2033
- Table 53: Rest of Middle East and Africa Hydropower Generation Market Revenue (billion) Forecast, by Application 2020 & 2033
- Table 54: Rest of Middle East and Africa Hydropower Generation Market Volume (terawatt) Forecast, by Application 2020 & 2033
- Table 55: Global Hydropower Generation Market Revenue billion Forecast, by Size 2020 & 2033
- Table 56: Global Hydropower Generation Market Volume terawatt Forecast, by Size 2020 & 2033
- Table 57: Global Hydropower Generation Market Revenue billion Forecast, by Country 2020 & 2033
- Table 58: Global Hydropower Generation Market Volume terawatt Forecast, by Country 2020 & 2033
- Table 59: United States Hydropower Generation Market Revenue (billion) Forecast, by Application 2020 & 2033
- Table 60: United States Hydropower Generation Market Volume (terawatt) Forecast, by Application 2020 & 2033
- Table 61: Canada Hydropower Generation Market Revenue (billion) Forecast, by Application 2020 & 2033
- Table 62: Canada Hydropower Generation Market Volume (terawatt) Forecast, by Application 2020 & 2033
- Table 63: Rest of North America Hydropower Generation Market Revenue (billion) Forecast, by Application 2020 & 2033
- Table 64: Rest of North America Hydropower Generation Market Volume (terawatt) Forecast, by Application 2020 & 2033
- Table 65: Global Hydropower Generation Market Revenue billion Forecast, by Size 2020 & 2033
- Table 66: Global Hydropower Generation Market Volume terawatt Forecast, by Size 2020 & 2033
- Table 67: Global Hydropower Generation Market Revenue billion Forecast, by Country 2020 & 2033
- Table 68: Global Hydropower Generation Market Volume terawatt Forecast, by Country 2020 & 2033
- Table 69: Germany Hydropower Generation Market Revenue (billion) Forecast, by Application 2020 & 2033
- Table 70: Germany Hydropower Generation Market Volume (terawatt) Forecast, by Application 2020 & 2033
- Table 71: France Hydropower Generation Market Revenue (billion) Forecast, by Application 2020 & 2033
- Table 72: France Hydropower Generation Market Volume (terawatt) Forecast, by Application 2020 & 2033
- Table 73: United Kingdom Hydropower Generation Market Revenue (billion) Forecast, by Application 2020 & 2033
- Table 74: United Kingdom Hydropower Generation Market Volume (terawatt) Forecast, by Application 2020 & 2033
- Table 75: Rest of Europe Hydropower Generation Market Revenue (billion) Forecast, by Application 2020 & 2033
- Table 76: Rest of Europe Hydropower Generation Market Volume (terawatt) Forecast, by Application 2020 & 2033
- Table 77: Global Hydropower Generation Market Revenue billion Forecast, by Size 2020 & 2033
- Table 78: Global Hydropower Generation Market Volume terawatt Forecast, by Size 2020 & 2033
- Table 79: Global Hydropower Generation Market Revenue billion Forecast, by Country 2020 & 2033
- Table 80: Global Hydropower Generation Market Volume terawatt Forecast, by Country 2020 & 2033
- Table 81: China Hydropower Generation Market Revenue (billion) Forecast, by Application 2020 & 2033
- Table 82: China Hydropower Generation Market Volume (terawatt) Forecast, by Application 2020 & 2033
- Table 83: India Hydropower Generation Market Revenue (billion) Forecast, by Application 2020 & 2033
- Table 84: India Hydropower Generation Market Volume (terawatt) Forecast, by Application 2020 & 2033
- Table 85: Japan Hydropower Generation Market Revenue (billion) Forecast, by Application 2020 & 2033
- Table 86: Japan Hydropower Generation Market Volume (terawatt) Forecast, by Application 2020 & 2033
- Table 87: South Korea Hydropower Generation Market Revenue (billion) Forecast, by Application 2020 & 2033
- Table 88: South Korea Hydropower Generation Market Volume (terawatt) Forecast, by Application 2020 & 2033
- Table 89: Rest of Asia Pacific Hydropower Generation Market Revenue (billion) Forecast, by Application 2020 & 2033
- Table 90: Rest of Asia Pacific Hydropower Generation Market Volume (terawatt) Forecast, by Application 2020 & 2033
- Table 91: Global Hydropower Generation Market Revenue billion Forecast, by Size 2020 & 2033
- Table 92: Global Hydropower Generation Market Volume terawatt Forecast, by Size 2020 & 2033
- Table 93: Global Hydropower Generation Market Revenue billion Forecast, by Country 2020 & 2033
- Table 94: Global Hydropower Generation Market Volume terawatt Forecast, by Country 2020 & 2033
- Table 95: Brazil Hydropower Generation Market Revenue (billion) Forecast, by Application 2020 & 2033
- Table 96: Brazil Hydropower Generation Market Volume (terawatt) Forecast, by Application 2020 & 2033
- Table 97: Argentina Hydropower Generation Market Revenue (billion) Forecast, by Application 2020 & 2033
- Table 98: Argentina Hydropower Generation Market Volume (terawatt) Forecast, by Application 2020 & 2033
- Table 99: Rest of South America Hydropower Generation Market Revenue (billion) Forecast, by Application 2020 & 2033
- Table 100: Rest of South America Hydropower Generation Market Volume (terawatt) Forecast, by Application 2020 & 2033
- Table 101: Global Hydropower Generation Market Revenue billion Forecast, by Size 2020 & 2033
- Table 102: Global Hydropower Generation Market Volume terawatt Forecast, by Size 2020 & 2033
- Table 103: Global Hydropower Generation Market Revenue billion Forecast, by Country 2020 & 2033
- Table 104: Global Hydropower Generation Market Volume terawatt Forecast, by Country 2020 & 2033
- Table 105: Saudi Arabia Hydropower Generation Market Revenue (billion) Forecast, by Application 2020 & 2033
- Table 106: Saudi Arabia Hydropower Generation Market Volume (terawatt) Forecast, by Application 2020 & 2033
- Table 107: United Arab Emirates Hydropower Generation Market Revenue (billion) Forecast, by Application 2020 & 2033
- Table 108: United Arab Emirates Hydropower Generation Market Volume (terawatt) Forecast, by Application 2020 & 2033
- Table 109: South Africa Hydropower Generation Market Revenue (billion) Forecast, by Application 2020 & 2033
- Table 110: South Africa Hydropower Generation Market Volume (terawatt) Forecast, by Application 2020 & 2033
- Table 111: Rest of Middle East and Africa Hydropower Generation Market Revenue (billion) Forecast, by Application 2020 & 2033
- Table 112: Rest of Middle East and Africa Hydropower Generation Market Volume (terawatt) Forecast, by Application 2020 & 2033
Frequently Asked Questions
1. What is the projected Compound Annual Growth Rate (CAGR) of the Hydropower Generation Market?
The projected CAGR is approximately 0.99%.
2. Which companies are prominent players in the Hydropower Generation Market?
Key companies in the market include Iberdrola SA*List Not Exhaustive 6 4 Market Ranking/Share Analysi, China Yangtze Power Co Ltd, Voith GmbH & Co KGaA, PJSC RusHydro, Siemens Energy AG, GE Renewable Energy, Andritz AG, Électricité de France SA (EDF).
3. What are the main segments of the Hydropower Generation Market?
The market segments include Size.
4. Can you provide details about the market size?
The market size is estimated to be USD 116.09 billion as of 2022.
5. What are some drivers contributing to market growth?
4.; Rising Demand for Reliable Electricity4.; Increasing Government Support for Hydropower Gneeration.
6. What are the notable trends driving market growth?
The Large Hydropower (Greater Than 100 MW) Segment to Dominate the Market.
7. Are there any restraints impacting market growth?
4.; Negative Environmental Consequences of Hydropower Projects.
8. Can you provide examples of recent developments in the market?
May 2023: Satluj Jal Vidyut Nigam (SJVN) of India has been granted permission by Nepal to develop a second hydropower project in the country. Currently, the firm is developing a 900-MW Arun-III hydroelectric project located on the Arun River in Eastern Nepal. This project is scheduled to be completed in 2024. Investment Board Nepal (IBN) has approved to build of the 669 MW Lower Arun hydropower project in eastern Nepal.
9. What pricing options are available for accessing the report?
Pricing options include single-user, multi-user, and enterprise licenses priced at USD 4750, USD 5250, and USD 8750 respectively.
10. Is the market size provided in terms of value or volume?
The market size is provided in terms of value, measured in billion and volume, measured in terawatt.
11. Are there any specific market keywords associated with the report?
Yes, the market keyword associated with the report is "Hydropower Generation Market," which aids in identifying and referencing the specific market segment covered.
12. How do I determine which pricing option suits my needs best?
The pricing options vary based on user requirements and access needs. Individual users may opt for single-user licenses, while businesses requiring broader access may choose multi-user or enterprise licenses for cost-effective access to the report.
13. Are there any additional resources or data provided in the Hydropower Generation Market report?
While the report offers comprehensive insights, it's advisable to review the specific contents or supplementary materials provided to ascertain if additional resources or data are available.
14. How can I stay updated on further developments or reports in the Hydropower Generation Market?
To stay informed about further developments, trends, and reports in the Hydropower Generation Market, consider subscribing to industry newsletters, following relevant companies and organizations, or regularly checking reputable industry news sources and publications.
Methodology
Step 1 - Identification of Relevant Samples Size from Population Database


Step 2 - Approaches for Defining Global Market Size (Value, Volume* & Price*)

Note*: In applicable scenarios
Step 3 - Data Sources
Primary Research
- Web Analytics
- Survey Reports
- Research Institute
- Latest Research Reports
- Opinion Leaders
Secondary Research
- Annual Reports
- White Paper
- Latest Press Release
- Industry Association
- Paid Database
- Investor Presentations

Step 4 - Data Triangulation
Involves using different sources of information in order to increase the validity of a study
These sources are likely to be stakeholders in a program - participants, other researchers, program staff, other community members, and so on.
Then we put all data in single framework & apply various statistical tools to find out the dynamic on the market.
During the analysis stage, feedback from the stakeholder groups would be compared to determine areas of agreement as well as areas of divergence
