

Key Insights
The North America Shale Market is projected for significant expansion, with an estimated market size of 88.6 billion by 2024, and is expected to grow at a Compound Annual Growth Rate (CAGR) of 5.9% through 2033. This growth is underpinned by sustained demand for oil and gas, driven by energy security objectives and the crucial need for petrochemical feedstocks. Key catalysts include advancements in extraction technologies such as hydraulic fracturing and horizontal drilling, which have expanded accessible reserves and enhanced operational efficiency. The region's robust infrastructure and favorable regulatory environments in select areas further support market performance. Emerging trends, including the adoption of digital technologies for optimized operations and predictive maintenance, alongside an increased emphasis on environmental responsibility through emission reduction and effective water management, are shaping the market's future.
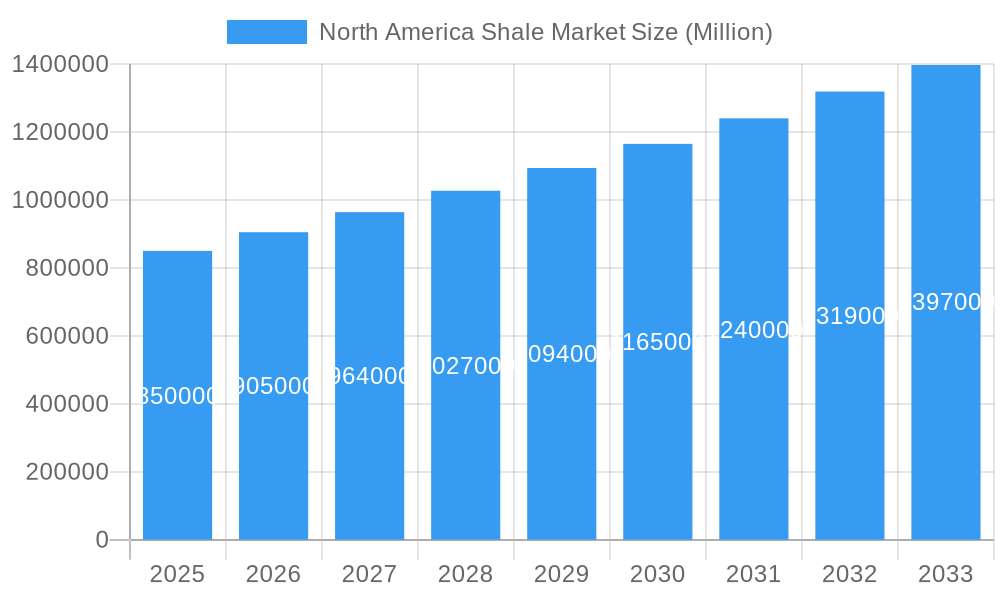
North America Shale Market Market Size (In Billion)
However, the market is influenced by certain constraints that may impact its trajectory. Heightened environmental scrutiny and regulatory pressures concerning shale operations, encompassing potential seismic activity and water quality, pose considerable challenges. Fluctuations in global energy prices, affected by geopolitical events and the expanding adoption of renewable energy, introduce market uncertainty. Notwithstanding these factors, the cost-competitiveness of North American shale production compared to international alternatives, coupled with ongoing innovation in extraction methodologies, is anticipated to maintain a positive growth outlook. The market is segmented by production, consumption, trade dynamics, and price trends, with prominent entities like ExxonMobil, Chevron, and Marathon Petroleum actively influencing the competitive landscape across the United States, Canada, and the wider North American region.
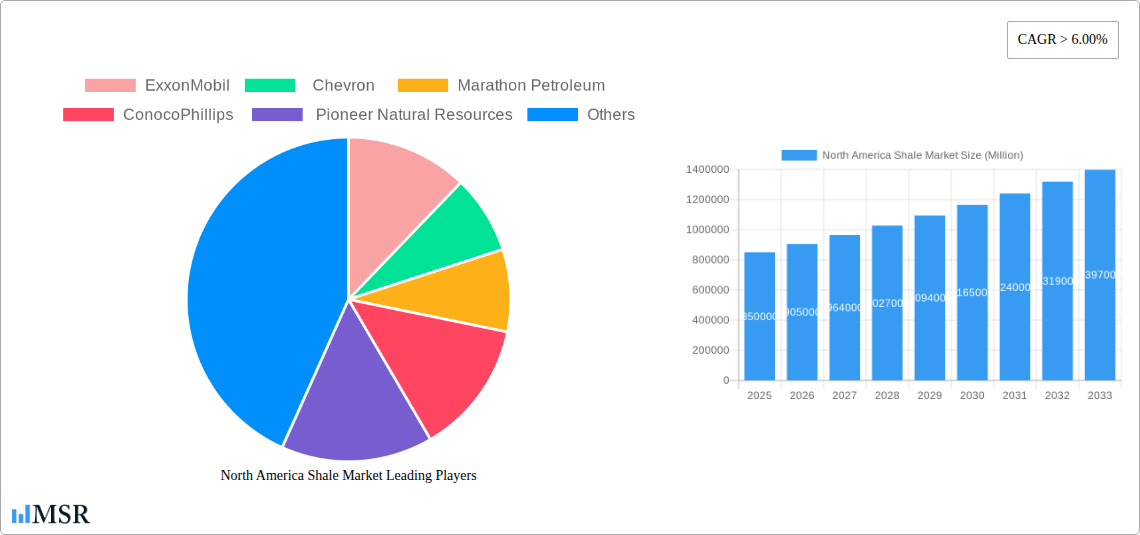
North America Shale Market Company Market Share
North America Shale Market: Comprehensive Market Research Report 2019-2033
Uncover the dynamic forces shaping the North America shale market with our in-depth analysis. This report provides critical insights into production, consumption, trade, pricing, and industry developments from 2019 to 2033, with a base year of 2025.
North America Shale Market Market Concentration & Dynamics
The North America shale market exhibits a moderate to high market concentration, with a few dominant players controlling significant production volumes and market share. Key industry participants like ExxonMobil, Chevron, Marathon Petroleum, ConocoPhillips, and Pioneer Natural Resources are actively engaged in strategic acquisitions and divestitures to optimize their portfolios and gain competitive advantages. The innovation ecosystem is characterized by continuous advancements in drilling and extraction technologies, including enhanced oil recovery (EOR) techniques and digitalization of operations, aimed at improving efficiency and reducing costs. Regulatory frameworks, while evolving, continue to influence operational practices, environmental standards, and land access. The market faces substitute product pressures from renewable energy sources, although shale remains a crucial component of the energy mix due to its established infrastructure and cost-competitiveness for certain applications. End-user trends are driven by global energy demand, particularly from the transportation and petrochemical sectors, with increasing focus on ESG compliance. M&A activities have been a significant feature, with an estimated XX number of deals recorded during the historical period, reflecting consolidation and strategic realignment. Market share distribution among the top five players is estimated to be around XX%.
North America Shale Market Industry Insights & Trends
The North America shale market is poised for significant evolution, driven by a confluence of factors that will reshape its trajectory. Market growth is underpinned by persistent global energy demand, particularly for oil and natural gas, which are essential for powering economies, transportation, and the petrochemical industry. Technological advancements are at the forefront of this growth. Innovations in horizontal drilling, hydraulic fracturing, and seismic imaging have dramatically improved extraction efficiency and economic viability, allowing access to previously unreachable reserves. The market size is estimated to be in the range of $XXX Billion for the base year 2025, with an anticipated Compound Annual Growth Rate (CAGR) of XX% during the forecast period of 2025–2033.
Technological disruptions continue to be a defining characteristic. The adoption of artificial intelligence (AI) and machine learning (ML) for reservoir characterization and operational optimization is enhancing well productivity and reducing downtime. Automation in drilling operations and the use of advanced analytics for predictive maintenance are further streamlining processes. Furthermore, there's a growing emphasis on developing and deploying technologies that minimize the environmental footprint of shale operations, including water recycling and methane emission reduction strategies.
Evolving consumer behaviors are also indirectly influencing the shale market. While direct consumption of shale products by end-users is limited, the growing global awareness and demand for sustainable energy solutions are prompting upstream producers to invest in cleaner extraction methods and to explore diversification into lower-carbon energy sources. This shift is creating a complex interplay between traditional fossil fuel production and the broader energy transition narrative. The market is witnessing increased investment in capturing and utilizing associated gas, a byproduct of oil extraction, further enhancing the economic and environmental profile of shale operations. The resilience of the North American shale sector is also attributed to its ability to respond swiftly to market demand fluctuations, a testament to its established infrastructure and technological prowess.
Key Markets & Segments Leading North America Shale Market
The North America shale market is characterized by distinct regional dominance and segment leadership, driven by a complex interplay of geological endowments, infrastructure development, and market demand.
Production Analysis: The Permian Basin in the United States stands as the undisputed leader in shale oil and gas production, accounting for approximately XX% of the total North American output. This dominance is fueled by its vast reserves, favorable geological formations, and extensive pipeline infrastructure. Other significant producing regions include the Eagle Ford Shale, Bakken Shale, and Marcellus Shale.
- Drivers for Production Dominance:
- Abundant proven reserves.
- Mature and well-developed drilling and completion technologies.
- Extensive midstream infrastructure for transportation.
- Supportive regulatory environments in key producing states.
Consumption Analysis: The United States is the largest consumer of shale-derived products, driven by its massive industrial, transportation, and residential sectors. Petrochemical manufacturing, a significant end-use industry, heavily relies on the abundant natural gas liquids (NGLs) produced from shale formations.
- Drivers for Consumption Dominance:
- Large and diversified industrial base.
- High per capita energy consumption.
- Growth in the petrochemical and plastics industries.
- Extensive refining capacity.
Import Market Analysis (Value & Volume): While North America is a net exporter of crude oil and natural gas, the United States does import specific grades of crude oil and refined products to meet domestic demand and optimize refinery operations. Canada is a significant trading partner, contributing to both import and export flows.
- Import Value (2025 Estimate): $XX Billion
- Import Volume (2025 Estimate): XX Million Barrels
Export Market Analysis (Value & Volume): The United States and Canada are major global exporters of crude oil and natural gas liquids (NGLs). The availability of abundant, cost-competitive shale resources has transformed North America into a key player in the global energy export market, supplying energy to various international destinations.
- Export Value (2025 Estimate): $XXX Billion
- Export Volume (2025 Estimate): XXX Million Barrels
Price Trend Analysis: Shale commodity prices, particularly crude oil and natural gas, are influenced by global supply and demand dynamics, geopolitical events, and OPEC+ decisions. The WTI (West Texas Intermediate) crude oil benchmark, closely associated with North American shale production, has experienced significant volatility but generally trended upwards due to supply constraints and increasing demand. Natural gas prices have also seen fluctuations, influenced by weather patterns, storage levels, and the increasing demand for power generation.
- Price Trend Impact: Influences investment decisions, exploration activity, and overall profitability of shale producers.
North America Shale Market Product Developments
Recent product developments in the North America shale market are primarily focused on enhancing extraction efficiency and minimizing environmental impact. Innovations in advanced hydraulic fracturing techniques, such as the use of slickwater and gel-based fluids, coupled with multi-stage fracturing, are enabling operators to unlock greater reserves from unconventional formations. The integration of real-time data analytics and artificial intelligence is leading to more precise well placement and optimized production strategies. Furthermore, there is a growing emphasis on technologies for capturing and utilizing associated gas, converting a potential waste stream into a valuable commodity and reducing methane emissions. These advancements contribute to a more sustainable and economically viable shale industry.
Challenges in the North America Shale Market Market
The North America shale market faces several significant challenges that could impact its growth and profitability. Regulatory hurdles, including permitting processes, environmental regulations (such as methane emission standards and water disposal rules), and land-use restrictions, can slow down exploration and production activities and increase operational costs. Supply chain disruptions, particularly related to equipment, labor, and transportation, can lead to project delays and cost overruns. Market volatility, driven by global economic conditions, geopolitical tensions, and the ongoing energy transition, creates uncertainty for long-term investment decisions. Public perception and environmental activism also pose a challenge, as concerns over the environmental impact of hydraulic fracturing and associated emissions continue to shape policy and public opinion. Finally, competition from renewable energy sources is a growing concern, as these alternatives gain traction and technological maturity.
Forces Driving North America Shale Market Growth
Several powerful forces are propelling the growth of the North America shale market. Technological advancements in horizontal drilling and hydraulic fracturing continue to unlock vast reserves, making extraction more efficient and cost-effective. The persistent and growing global demand for energy, particularly for oil and natural gas in developing economies and for petrochemical feedstocks, provides a robust market for shale products. Developed infrastructure, including extensive pipeline networks and processing facilities, ensures efficient transportation and utilization of produced hydrocarbons. Favorable economic conditions and investment capital, though subject to market cycles, support exploration and development activities. Furthermore, the strategic importance of energy independence and security for North American nations encourages continued domestic production.
Challenges in the North America Shale Market Market
The long-term growth of the North America shale market is contingent on navigating several key challenges. Environmental concerns related to greenhouse gas emissions, water usage, and seismic activity associated with hydraulic fracturing necessitate ongoing investment in mitigation technologies and sustainable practices. Regulatory uncertainty and evolving policy landscapes can create investment risks and operational complexities. Infrastructure constraints, particularly in areas experiencing rapid production growth, can lead to bottlenecks in transportation and processing. Geopolitical instability can disrupt global energy markets, impacting pricing and demand. Furthermore, the increasing cost of capital and the growing investor focus on Environmental, Social, and Governance (ESG) performance are pressuring companies to demonstrate commitment to sustainable operations.
Emerging Opportunities in North America Shale Market
Emerging opportunities in the North America shale market are diverse and promising. Technological innovation in areas like carbon capture, utilization, and storage (CCUS) presents a significant opportunity to reduce the carbon footprint of shale operations. The growing demand for natural gas liquids (NGLs) as feedstocks for the petrochemical industry, particularly for plastics production, offers a strong market for associated gas. Expansion into emerging international markets for liquefied natural gas (LNG) exports provides new avenues for growth. Furthermore, the potential for synergies between shale operations and renewable energy integration, such as utilizing renewable energy for powering drilling operations, represents a forward-looking opportunity. The development of advanced analytics and AI for predictive maintenance and operational optimization also offers significant efficiency gains.
Leading Players in the North America Shale Market Sector
- ExxonMobil
- Chevron
- Marathon Petroleum
- ConocoPhillips
- Pioneer Natural Resources
Key Milestones in North America Shale Market Industry
- 2019: Significant advancements in multi-well pad drilling and completion techniques further optimize production efficiency.
- 2020: Impact of global pandemic leads to temporary production cuts and price volatility, highlighting market sensitivity.
- 2021: Resurgence in demand and rising energy prices drive renewed investment in shale exploration and development.
- 2022: Increased focus on methane emission reduction technologies and sustainability initiatives gains momentum.
- 2023: Continued consolidation within the industry through strategic mergers and acquisitions to enhance operational scale.
- 2024: Advancements in AI and automation are increasingly integrated into shale operations for predictive analytics and efficiency gains.
Strategic Outlook for North America Shale Market Market
The strategic outlook for the North America shale market remains robust, driven by sustained global energy demand and ongoing technological innovation. Future growth will be significantly shaped by the industry's ability to embrace cleaner extraction technologies and to effectively integrate with the broader energy transition. Companies that prioritize operational efficiency, environmental stewardship, and strategic partnerships will be best positioned for success. Investments in midstream infrastructure and downstream processing will continue to be crucial for maximizing the value of shale resources. The market's adaptability to evolving regulatory landscapes and its capacity to innovate in response to competitive pressures will determine its long-term trajectory.
North America Shale Market Segmentation
- 1. Production Analysis
- 2. Consumption Analysis
- 3. Import Market Analysis (Value & Volume)
- 4. Export Market Analysis (Value & Volume)
- 5. Price Trend Analysis
North America Shale Market Segmentation By Geography
- 1. United States
- 2. Canada
- 3. Rest of North America
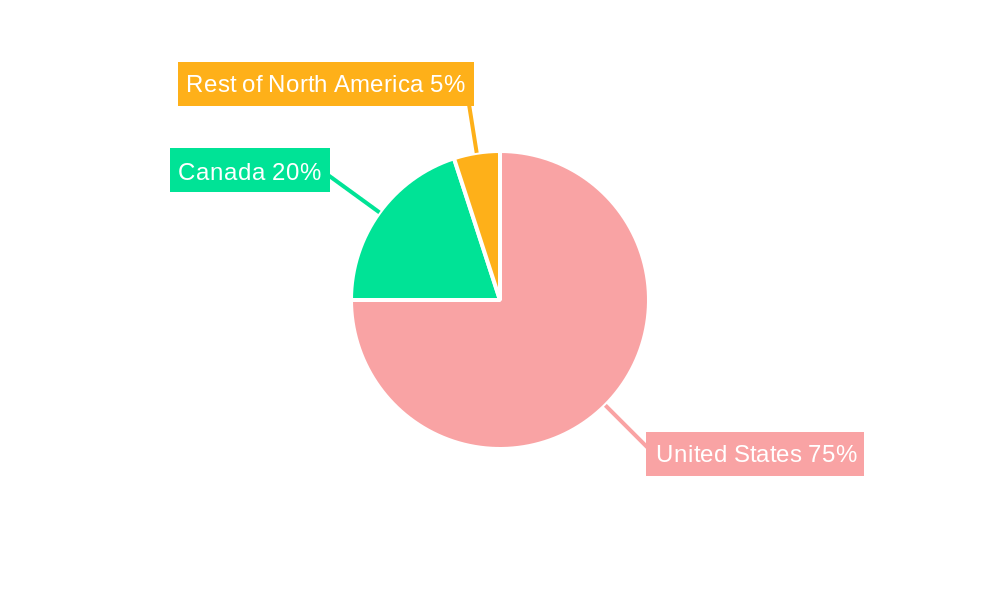
North America Shale Market Regional Market Share
Geographic Coverage of North America Shale Market
North America Shale Market REPORT HIGHLIGHTS
| Aspects | Details |
|---|---|
| Study Period | 2020-2034 |
| Base Year | 2025 |
| Estimated Year | 2026 |
| Forecast Period | 2026-2034 |
| Historical Period | 2020-2025 |
| Growth Rate | CAGR of 5.9% from 2020-2034 |
| Segmentation |
|
Table of Contents
- 1. Introduction
- 1.1. Research Scope
- 1.2. Market Segmentation
- 1.3. Research Objective
- 1.4. Definitions and Assumptions
- 2. Executive Summary
- 2.1. Market Snapshot
- 3. Market Dynamics
- 3.1. Market Drivers
- 3.2. Market Restrains
- 3.3. Market Trends
- 3.4. Market Opportunities
- 4. Market Factor Analysis
- 4.1. Porters Five Forces
- 4.1.1. Bargaining Power of Suppliers
- 4.1.2. Bargaining Power of Buyers
- 4.1.3. Threat of New Entrants
- 4.1.4. Threat of Substitutes
- 4.1.5. Competitive Rivalry
- 4.2. PESTEL analysis
- 4.3. BCG Analysis
- 4.3.1. Stars (High Growth, High Market Share)
- 4.3.2. Cash Cows (Low Growth, High Market Share)
- 4.3.3. Question Mark (High Growth, Low Market Share)
- 4.3.4. Dogs (Low Growth, Low Market Share)
- 4.4. Ansoff Matrix Analysis
- 4.5. Supply Chain Analysis
- 4.6. Regulatory Landscape
- 4.7. Current Market Potential and Opportunity Assessment (TAM–SAM–SOM Framework)
- 4.8. MSR Analyst Note
- 4.1. Porters Five Forces
- 5. Market Analysis, Insights and Forecast 2021-2033
- 5.1. Market Analysis, Insights and Forecast - by Production Analysis
- 5.2. Market Analysis, Insights and Forecast - by Consumption Analysis
- 5.3. Market Analysis, Insights and Forecast - by Import Market Analysis (Value & Volume)
- 5.4. Market Analysis, Insights and Forecast - by Export Market Analysis (Value & Volume)
- 5.5. Market Analysis, Insights and Forecast - by Price Trend Analysis
- 5.6. Market Analysis, Insights and Forecast - by Region
- 5.6.1. United States
- 5.6.2. Canada
- 5.6.3. Rest of North America
- 6. North America Shale Market Analysis, Insights and Forecast, 2021-2033
- 6.1. Market Analysis, Insights and Forecast - by Production Analysis
- 6.2. Market Analysis, Insights and Forecast - by Consumption Analysis
- 6.3. Market Analysis, Insights and Forecast - by Import Market Analysis (Value & Volume)
- 6.4. Market Analysis, Insights and Forecast - by Export Market Analysis (Value & Volume)
- 6.5. Market Analysis, Insights and Forecast - by Price Trend Analysis
- 7. United States North America Shale Market Analysis, Insights and Forecast, 2020-2032
- 7.1. Market Analysis, Insights and Forecast - by Production Analysis
- 7.2. Market Analysis, Insights and Forecast - by Consumption Analysis
- 7.3. Market Analysis, Insights and Forecast - by Import Market Analysis (Value & Volume)
- 7.4. Market Analysis, Insights and Forecast - by Export Market Analysis (Value & Volume)
- 7.5. Market Analysis, Insights and Forecast - by Price Trend Analysis
- 8. Canada North America Shale Market Analysis, Insights and Forecast, 2020-2032
- 8.1. Market Analysis, Insights and Forecast - by Production Analysis
- 8.2. Market Analysis, Insights and Forecast - by Consumption Analysis
- 8.3. Market Analysis, Insights and Forecast - by Import Market Analysis (Value & Volume)
- 8.4. Market Analysis, Insights and Forecast - by Export Market Analysis (Value & Volume)
- 8.5. Market Analysis, Insights and Forecast - by Price Trend Analysis
- 9. Rest of North America North America Shale Market Analysis, Insights and Forecast, 2020-2032
- 9.1. Market Analysis, Insights and Forecast - by Production Analysis
- 9.2. Market Analysis, Insights and Forecast - by Consumption Analysis
- 9.3. Market Analysis, Insights and Forecast - by Import Market Analysis (Value & Volume)
- 9.4. Market Analysis, Insights and Forecast - by Export Market Analysis (Value & Volume)
- 9.5. Market Analysis, Insights and Forecast - by Price Trend Analysis
- 10. Competitive Analysis
- 10.1. Company Profiles
- 10.1.1 ExxonMobil
- 10.1.1.1. Company Overview
- 10.1.1.2. Products
- 10.1.1.3. Company Financials
- 10.1.1.4. SWOT Analysis
- 10.1.2 Chevron
- 10.1.2.1. Company Overview
- 10.1.2.2. Products
- 10.1.2.3. Company Financials
- 10.1.2.4. SWOT Analysis
- 10.1.3 Marathon Petroleum
- 10.1.3.1. Company Overview
- 10.1.3.2. Products
- 10.1.3.3. Company Financials
- 10.1.3.4. SWOT Analysis
- 10.1.4 ConocoPhillips
- 10.1.4.1. Company Overview
- 10.1.4.2. Products
- 10.1.4.3. Company Financials
- 10.1.4.4. SWOT Analysis
- 10.1.5 Pioneer Natural Resources
- 10.1.5.1. Company Overview
- 10.1.5.2. Products
- 10.1.5.3. Company Financials
- 10.1.5.4. SWOT Analysis
- 10.1.1 ExxonMobil
- 10.2. Market Entropy
- 10.2.1 Company's Key Areas Served
- 10.2.2 Recent Developments
- 10.3. Company Market Share Analysis 2025
- 10.3.1 Top 5 Companies Market Share Analysis
- 10.3.2 Top 3 Companies Market Share Analysis
- 10.4. List of Potential Customers
- 11. Research Methodology
List of Figures
- Figure 1: North America Shale Market Revenue Breakdown (billion, %) by Product 2025 & 2033
- Figure 2: North America Shale Market Share (%) by Company 2025
List of Tables
- Table 1: North America Shale Market Revenue billion Forecast, by Production Analysis 2020 & 2033
- Table 2: North America Shale Market Revenue billion Forecast, by Consumption Analysis 2020 & 2033
- Table 3: North America Shale Market Revenue billion Forecast, by Import Market Analysis (Value & Volume) 2020 & 2033
- Table 4: North America Shale Market Revenue billion Forecast, by Export Market Analysis (Value & Volume) 2020 & 2033
- Table 5: North America Shale Market Revenue billion Forecast, by Price Trend Analysis 2020 & 2033
- Table 6: North America Shale Market Revenue billion Forecast, by Region 2020 & 2033
- Table 7: North America Shale Market Revenue billion Forecast, by Production Analysis 2020 & 2033
- Table 8: North America Shale Market Revenue billion Forecast, by Consumption Analysis 2020 & 2033
- Table 9: North America Shale Market Revenue billion Forecast, by Import Market Analysis (Value & Volume) 2020 & 2033
- Table 10: North America Shale Market Revenue billion Forecast, by Export Market Analysis (Value & Volume) 2020 & 2033
- Table 11: North America Shale Market Revenue billion Forecast, by Price Trend Analysis 2020 & 2033
- Table 12: North America Shale Market Revenue billion Forecast, by Country 2020 & 2033
- Table 13: North America Shale Market Revenue billion Forecast, by Production Analysis 2020 & 2033
- Table 14: North America Shale Market Revenue billion Forecast, by Consumption Analysis 2020 & 2033
- Table 15: North America Shale Market Revenue billion Forecast, by Import Market Analysis (Value & Volume) 2020 & 2033
- Table 16: North America Shale Market Revenue billion Forecast, by Export Market Analysis (Value & Volume) 2020 & 2033
- Table 17: North America Shale Market Revenue billion Forecast, by Price Trend Analysis 2020 & 2033
- Table 18: North America Shale Market Revenue billion Forecast, by Country 2020 & 2033
- Table 19: North America Shale Market Revenue billion Forecast, by Production Analysis 2020 & 2033
- Table 20: North America Shale Market Revenue billion Forecast, by Consumption Analysis 2020 & 2033
- Table 21: North America Shale Market Revenue billion Forecast, by Import Market Analysis (Value & Volume) 2020 & 2033
- Table 22: North America Shale Market Revenue billion Forecast, by Export Market Analysis (Value & Volume) 2020 & 2033
- Table 23: North America Shale Market Revenue billion Forecast, by Price Trend Analysis 2020 & 2033
- Table 24: North America Shale Market Revenue billion Forecast, by Country 2020 & 2033
Frequently Asked Questions
1. What is the projected Compound Annual Growth Rate (CAGR) of the North America Shale Market?
The projected CAGR is approximately 5.9%.
2. Which companies are prominent players in the North America Shale Market?
Key companies in the market include ExxonMobil, Chevron , Marathon Petroleum , ConocoPhillips , Pioneer Natural Resources.
3. What are the main segments of the North America Shale Market?
The market segments include Production Analysis, Consumption Analysis, Import Market Analysis (Value & Volume), Export Market Analysis (Value & Volume), Price Trend Analysis.
4. Can you provide details about the market size?
The market size is estimated to be USD 88.6 billion as of 2022.
5. What are some drivers contributing to market growth?
4.; Increasing Number of Offshore Operations 4.; Demand Coming for Unconventional Energy Sources.
6. What are the notable trends driving market growth?
Shale Gas to Dominate the Market.
7. Are there any restraints impacting market growth?
4.; Demand for Renewable Energy.
8. Can you provide examples of recent developments in the market?
N/A
9. What pricing options are available for accessing the report?
Pricing options include single-user, multi-user, and enterprise licenses priced at USD 4750, USD 5250, and USD 8750 respectively.
10. Is the market size provided in terms of value or volume?
The market size is provided in terms of value, measured in billion.
11. Are there any specific market keywords associated with the report?
Yes, the market keyword associated with the report is "North America Shale Market," which aids in identifying and referencing the specific market segment covered.
12. How do I determine which pricing option suits my needs best?
The pricing options vary based on user requirements and access needs. Individual users may opt for single-user licenses, while businesses requiring broader access may choose multi-user or enterprise licenses for cost-effective access to the report.
13. Are there any additional resources or data provided in the North America Shale Market report?
While the report offers comprehensive insights, it's advisable to review the specific contents or supplementary materials provided to ascertain if additional resources or data are available.
14. How can I stay updated on further developments or reports in the North America Shale Market?
To stay informed about further developments, trends, and reports in the North America Shale Market, consider subscribing to industry newsletters, following relevant companies and organizations, or regularly checking reputable industry news sources and publications.
Methodology
Step 1 - Identification of Relevant Samples Size from Population Database


Step 2 - Approaches for Defining Global Market Size (Value, Volume* & Price*)

Note*: In applicable scenarios
Step 3 - Data Sources
Primary Research
- Web Analytics
- Survey Reports
- Research Institute
- Latest Research Reports
- Opinion Leaders
Secondary Research
- Annual Reports
- White Paper
- Latest Press Release
- Industry Association
- Paid Database
- Investor Presentations

Step 4 - Data Triangulation
Involves using different sources of information in order to increase the validity of a study
These sources are likely to be stakeholders in a program - participants, other researchers, program staff, other community members, and so on.
Then we put all data in single framework & apply various statistical tools to find out the dynamic on the market.
During the analysis stage, feedback from the stakeholder groups would be compared to determine areas of agreement as well as areas of divergence