
Key Insights
The Smart Grid Networking market is experiencing robust growth, projected to maintain a Compound Annual Growth Rate (CAGR) exceeding 11% from 2025 to 2033. This expansion is driven by the increasing need for reliable, efficient, and resilient power grids capable of integrating renewable energy sources and managing fluctuating demand. Key technological advancements, such as Advanced Metering Infrastructure (AMI), demand response systems, and sophisticated transmission network management tools, are fueling this growth. The rising adoption of smart meters enables real-time monitoring and control of energy consumption, optimizing grid operations and reducing energy waste. Furthermore, the integration of renewable energy sources, such as solar and wind power, requires intelligent grid management to ensure stability and balance supply and demand. Governments worldwide are investing heavily in smart grid infrastructure upgrades to enhance energy efficiency, improve grid resilience against cyber threats and natural disasters, and reduce carbon emissions. This substantial governmental support alongside increasing private sector investment acts as a major catalyst for market expansion.
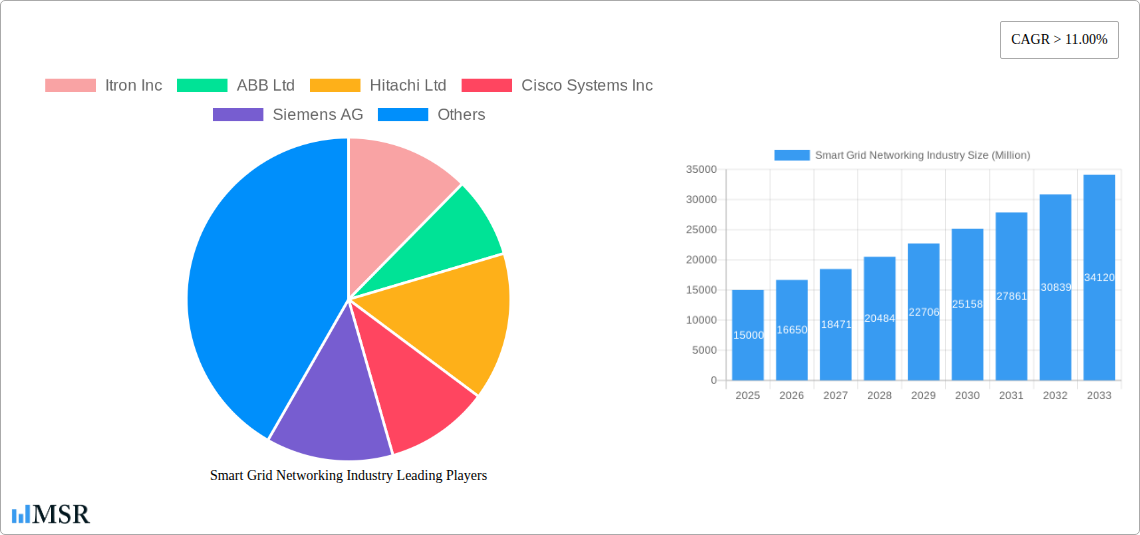
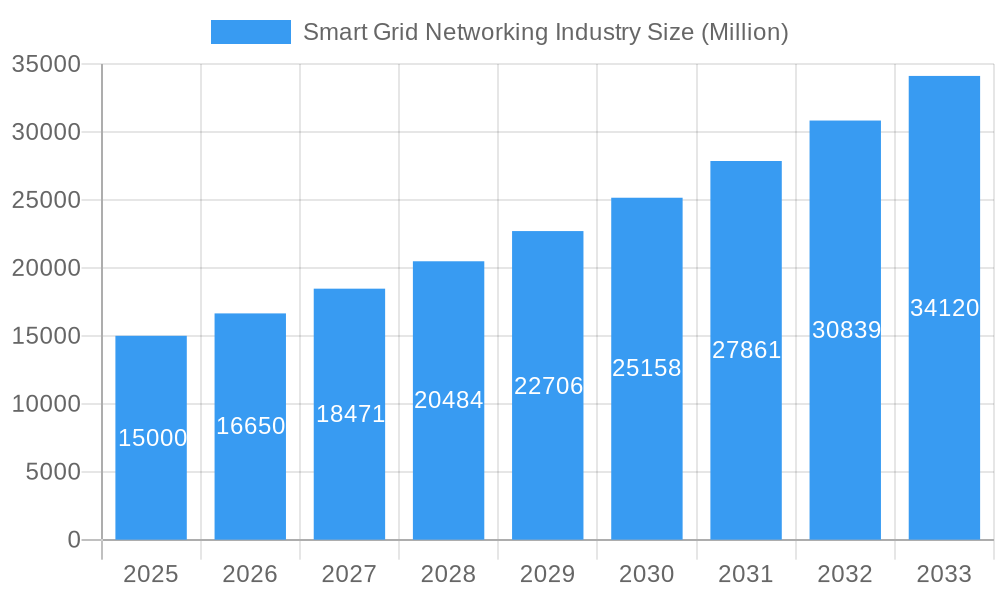
Smart Grid Networking Industry Market Size (In Billion)
The market is segmented geographically, with North America (particularly the United States and Canada), Europe, and Asia Pacific (especially China, Japan, and India) representing major regional hubs. Competition is intense, with established players like Itron, ABB, Hitachi, Cisco, Siemens, Schneider Electric, Eaton, General Electric, and Honeywell dominating the landscape. However, opportunities exist for smaller, specialized companies to emerge in niche segments, such as those focusing on advanced analytics or specific geographic regions. The challenges facing the market include the high initial investment costs associated with smart grid infrastructure upgrades, the complexity of integrating diverse technologies, and concerns about data security and privacy. Nevertheless, the long-term benefits in terms of improved efficiency, reliability, and sustainability are expected to outweigh these challenges, ensuring continued market expansion throughout the forecast period.
Smart Grid Networking Industry Company Market Share
Smart Grid Networking Industry: A Comprehensive Market Report (2019-2033)
This comprehensive report provides an in-depth analysis of the Smart Grid Networking Industry, offering valuable insights for stakeholders seeking to navigate this dynamic market. With a study period spanning 2019-2033, a base year of 2025, and a forecast period of 2025-2033, this report leverages extensive data analysis to present a clear picture of market trends, growth drivers, and challenges. The global market size is estimated at $XX Million in 2025, with a CAGR of XX% projected for the forecast period. This report features detailed analysis of key players including Itron Inc, ABB Ltd, Hitachi Ltd, Cisco Systems Inc, Siemens AG, Schneider Electric SE, Eaton Corporation PLC, General Electric Company, Honeywell International Inc, Osaki Electric Co Ltd (list not exhaustive), and examines key segments like Transmission, Demand Response, Advanced Metering Infrastructure (AMI), and other technology application areas.
Smart Grid Networking Industry Market Concentration & Dynamics
The Smart Grid Networking industry exhibits a moderately concentrated market structure, with a few major players holding significant market share. While precise market share figures for each company require further proprietary data analysis, industry giants like Siemens AG, ABB Ltd, and Schneider Electric SE are expected to collectively hold a significant portion (estimated at XX%). The industry is characterized by a dynamic innovation ecosystem, fostering continuous technological advancements. Stringent regulatory frameworks, particularly concerning data security and grid reliability, influence market dynamics. Substitute products, such as traditional grid infrastructure, pose a competitive challenge, although their market share is expected to diminish due to the advantages offered by smart grid technologies. End-user trends reveal a growing preference for energy efficiency and grid stability, driving the adoption of smart grid networking solutions. Mergers and acquisitions (M&A) activity plays a vital role, enhancing market consolidation and technological capabilities. For instance, the 2021 acquisition of DC Systems BV by Schneider Electric demonstrates strategic maneuvers for market expansion. The number of M&A deals in the past five years is estimated at XX.
- Market Concentration: Moderately concentrated
- Innovation Ecosystem: Highly dynamic
- Regulatory Frameworks: Stringent
- Substitute Products: Traditional grid infrastructure (decreasing market share)
- M&A Activity: Significant, with an estimated XX deals in the past 5 years.
Smart Grid Networking Industry Industry Insights & Trends
The Smart Grid Networking market is experiencing robust growth, fueled by several key factors. The increasing demand for reliable and efficient power distribution is a primary driver. Governments worldwide are investing heavily in upgrading aging grid infrastructure, further accelerating market expansion. The integration of renewable energy sources, such as solar and wind power, necessitates sophisticated smart grid solutions for effective grid management. Technological disruptions, such as the adoption of advanced metering infrastructure (AMI) and the rise of IoT-enabled devices, are transforming the landscape. Evolving consumer behavior, including a growing awareness of environmental sustainability and energy conservation, is also driving demand. The market size is projected to reach $XX Million by 2033.
Key Markets & Segments Leading Smart Grid Networking Industry
North America currently dominates the Smart Grid Networking market, driven by robust economic growth, significant government investments in grid modernization, and early adoption of advanced technologies. Within technology application areas, Advanced Metering Infrastructure (AMI) currently holds the largest market share, followed by Demand Response and Transmission.
- Dominant Region: North America
- Leading Segment: Advanced Metering Infrastructure (AMI)
Drivers for Segment Dominance:
- AMI: Growing need for accurate energy consumption data, improved grid management, and reduced energy losses.
- Demand Response: Increasing electricity prices and the need for load balancing.
- Transmission: Upgrading aging transmission infrastructure for enhanced reliability and efficiency.
Other factors driving market growth across regions and segments include expanding urbanization, rising energy consumption, and growing concerns about climate change.
Smart Grid Networking Industry Product Developments
Recent product innovations focus on enhancing grid reliability, improving energy efficiency, and strengthening cybersecurity. Advanced communication protocols, AI-driven analytics, and improved sensor technologies are key areas of development. These advancements provide competitive advantages by offering superior grid management, real-time monitoring capabilities, and enhanced data security.
Challenges in the Smart Grid Networking Industry Market
The industry faces challenges including regulatory complexities surrounding data privacy and grid security, supply chain disruptions affecting component availability, and intense competition among established players and new entrants. These factors can lead to project delays, increased costs, and reduced profitability. For example, supply chain issues in 2022 resulted in an estimated XX Million loss in revenue for the industry.
Forces Driving Smart Grid Networking Industry Growth
Technological advancements, particularly in areas such as AI, IoT, and advanced sensors, are significantly boosting market growth. Government regulations and incentives designed to promote grid modernization and renewable energy integration are also key drivers. Economic growth in developing economies is creating substantial demand for smart grid solutions. The increasing adoption of renewable energy sources further contributes to the industry's expansion.
Long-Term Growth Catalysts in the Smart Grid Networking Industry
Long-term growth will be fueled by continued innovation in smart grid technologies, strategic partnerships between technology providers and utility companies, and expansion into new geographic markets, particularly in developing countries with rapidly growing energy demands. The integration of AI and machine learning will further enhance grid efficiency and resilience.
Emerging Opportunities in Smart Grid Networking Industry
Emerging opportunities include the integration of blockchain technology for secure energy trading, the development of microgrids for improved resilience, and the expansion of smart grid solutions into rural and underserved areas. Growth in electric vehicle adoption will further drive demand for intelligent charging infrastructure management.
Leading Players in the Smart Grid Networking Industry Sector
Key Milestones in Smart Grid Networking Industry Industry
- September 2020: Siemens Energy launched its new Unified Power Flow Controller (UPFC) PLUS, enhancing grid stabilization capabilities.
- January 2021: Schneider Electric acquired DC Systems BV, strengthening its position in smart grid technologies.
Strategic Outlook for Smart Grid Networking Industry Market
The Smart Grid Networking market is poised for significant growth in the coming years, driven by technological advancements, supportive government policies, and increasing energy demand. Strategic partnerships and investments in research and development will be crucial for companies seeking to capitalize on this market's potential. The focus will shift towards enhanced grid resilience, integration of renewable energy sources, and improved cybersecurity measures.
Smart Grid Networking Industry Segmentation
-
1. Technology Application Area
- 1.1. Transmission
- 1.2. Demand Response
- 1.3. Advanced Metering Infrastructure (AMI)
- 1.4. Other Technology Application Areas
Smart Grid Networking Industry Segmentation By Geography
- 1. North America
- 2. Europe
- 3. Asia Pacific
- 4. South America
- 5. Middle East
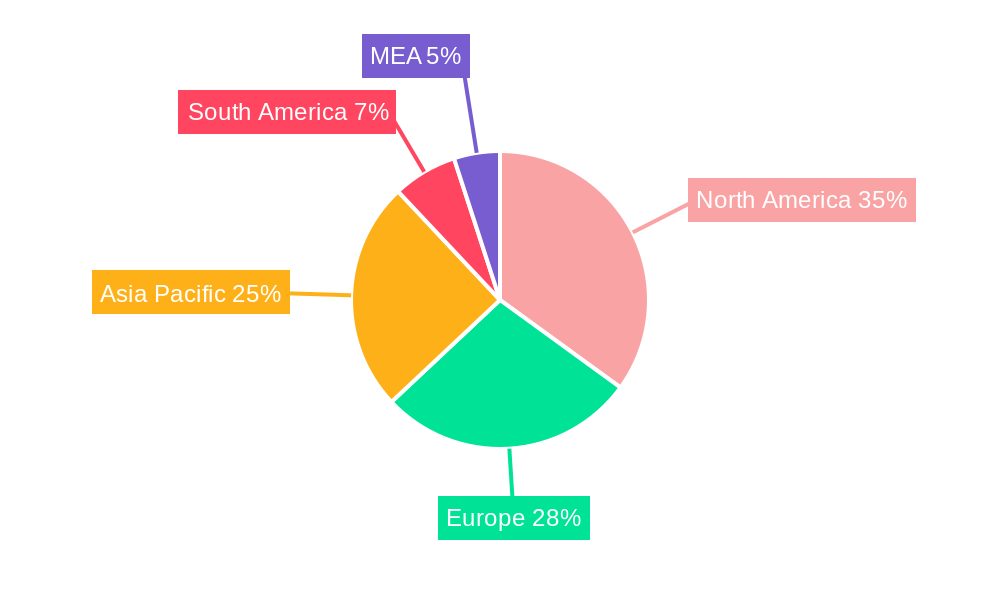
Smart Grid Networking Industry Regional Market Share
Geographic Coverage of Smart Grid Networking Industry
Smart Grid Networking Industry REPORT HIGHLIGHTS
| Aspects | Details |
|---|---|
| Study Period | 2020-2034 |
| Base Year | 2025 |
| Estimated Year | 2026 |
| Forecast Period | 2026-2034 |
| Historical Period | 2020-2025 |
| Growth Rate | CAGR of > 11.00% from 2020-2034 |
| Segmentation |
|
Table of Contents
- 1. Introduction
- 1.1. Research Scope
- 1.2. Market Segmentation
- 1.3. Research Methodology
- 1.4. Definitions and Assumptions
- 2. Executive Summary
- 2.1. Introduction
- 3. Market Dynamics
- 3.1. Introduction
- 3.2. Market Drivers
- 3.2.1. 4.; Growing Power Demand from the Commercial and Industrial Sectors
- 3.3. Market Restrains
- 3.3.1. 4.; Stringent Environmental and Safety Regulations
- 3.4. Market Trends
- 3.4.1. Advanced Metering Infrastructure (AMI) to Witness Significant Growth
- 4. Market Factor Analysis
- 4.1. Porters Five Forces
- 4.2. Supply/Value Chain
- 4.3. PESTEL analysis
- 4.4. Market Entropy
- 4.5. Patent/Trademark Analysis
- 5. Global Smart Grid Networking Industry Analysis, Insights and Forecast, 2020-2032
- 5.1. Market Analysis, Insights and Forecast - by Technology Application Area
- 5.1.1. Transmission
- 5.1.2. Demand Response
- 5.1.3. Advanced Metering Infrastructure (AMI)
- 5.1.4. Other Technology Application Areas
- 5.2. Market Analysis, Insights and Forecast - by Region
- 5.2.1. North America
- 5.2.2. Europe
- 5.2.3. Asia Pacific
- 5.2.4. South America
- 5.2.5. Middle East
- 5.1. Market Analysis, Insights and Forecast - by Technology Application Area
- 6. North America Smart Grid Networking Industry Analysis, Insights and Forecast, 2020-2032
- 6.1. Market Analysis, Insights and Forecast - by Technology Application Area
- 6.1.1. Transmission
- 6.1.2. Demand Response
- 6.1.3. Advanced Metering Infrastructure (AMI)
- 6.1.4. Other Technology Application Areas
- 6.1. Market Analysis, Insights and Forecast - by Technology Application Area
- 7. Europe Smart Grid Networking Industry Analysis, Insights and Forecast, 2020-2032
- 7.1. Market Analysis, Insights and Forecast - by Technology Application Area
- 7.1.1. Transmission
- 7.1.2. Demand Response
- 7.1.3. Advanced Metering Infrastructure (AMI)
- 7.1.4. Other Technology Application Areas
- 7.1. Market Analysis, Insights and Forecast - by Technology Application Area
- 8. Asia Pacific Smart Grid Networking Industry Analysis, Insights and Forecast, 2020-2032
- 8.1. Market Analysis, Insights and Forecast - by Technology Application Area
- 8.1.1. Transmission
- 8.1.2. Demand Response
- 8.1.3. Advanced Metering Infrastructure (AMI)
- 8.1.4. Other Technology Application Areas
- 8.1. Market Analysis, Insights and Forecast - by Technology Application Area
- 9. South America Smart Grid Networking Industry Analysis, Insights and Forecast, 2020-2032
- 9.1. Market Analysis, Insights and Forecast - by Technology Application Area
- 9.1.1. Transmission
- 9.1.2. Demand Response
- 9.1.3. Advanced Metering Infrastructure (AMI)
- 9.1.4. Other Technology Application Areas
- 9.1. Market Analysis, Insights and Forecast - by Technology Application Area
- 10. Middle East Smart Grid Networking Industry Analysis, Insights and Forecast, 2020-2032
- 10.1. Market Analysis, Insights and Forecast - by Technology Application Area
- 10.1.1. Transmission
- 10.1.2. Demand Response
- 10.1.3. Advanced Metering Infrastructure (AMI)
- 10.1.4. Other Technology Application Areas
- 10.1. Market Analysis, Insights and Forecast - by Technology Application Area
- 11. North America Smart Grid Networking Industry Analysis, Insights and Forecast, 2020-2032
- 11.1. Market Analysis, Insights and Forecast - By Country/Sub-region
- 11.1.1 United States
- 11.1.2 Canada
- 11.1.3 Mexico
- 12. Europe Smart Grid Networking Industry Analysis, Insights and Forecast, 2020-2032
- 12.1. Market Analysis, Insights and Forecast - By Country/Sub-region
- 12.1.1 Germany
- 12.1.2 United Kingdom
- 12.1.3 France
- 12.1.4 Spain
- 12.1.5 Italy
- 12.1.6 Spain
- 12.1.7 Belgium
- 12.1.8 Netherland
- 12.1.9 Nordics
- 12.1.10 Rest of Europe
- 13. Asia Pacific Smart Grid Networking Industry Analysis, Insights and Forecast, 2020-2032
- 13.1. Market Analysis, Insights and Forecast - By Country/Sub-region
- 13.1.1 China
- 13.1.2 Japan
- 13.1.3 India
- 13.1.4 South Korea
- 13.1.5 Southeast Asia
- 13.1.6 Australia
- 13.1.7 Indonesia
- 13.1.8 Phillipes
- 13.1.9 Singapore
- 13.1.10 Thailandc
- 13.1.11 Rest of Asia Pacific
- 14. South America Smart Grid Networking Industry Analysis, Insights and Forecast, 2020-2032
- 14.1. Market Analysis, Insights and Forecast - By Country/Sub-region
- 14.1.1 Brazil
- 14.1.2 Argentina
- 14.1.3 Peru
- 14.1.4 Chile
- 14.1.5 Colombia
- 14.1.6 Ecuador
- 14.1.7 Venezuela
- 14.1.8 Rest of South America
- 15. North America Smart Grid Networking Industry Analysis, Insights and Forecast, 2020-2032
- 15.1. Market Analysis, Insights and Forecast - By Country/Sub-region
- 15.1.1 United States
- 15.1.2 Canada
- 15.1.3 Mexico
- 16. MEA Smart Grid Networking Industry Analysis, Insights and Forecast, 2020-2032
- 16.1. Market Analysis, Insights and Forecast - By Country/Sub-region
- 16.1.1 United Arab Emirates
- 16.1.2 Saudi Arabia
- 16.1.3 South Africa
- 16.1.4 Rest of Middle East and Africa
- 17. Competitive Analysis
- 17.1. Global Market Share Analysis 2025
- 17.2. Company Profiles
- 17.2.1 Itron Inc
- 17.2.1.1. Overview
- 17.2.1.2. Products
- 17.2.1.3. SWOT Analysis
- 17.2.1.4. Recent Developments
- 17.2.1.5. Financials (Based on Availability)
- 17.2.2 ABB Ltd
- 17.2.2.1. Overview
- 17.2.2.2. Products
- 17.2.2.3. SWOT Analysis
- 17.2.2.4. Recent Developments
- 17.2.2.5. Financials (Based on Availability)
- 17.2.3 Hitachi Ltd
- 17.2.3.1. Overview
- 17.2.3.2. Products
- 17.2.3.3. SWOT Analysis
- 17.2.3.4. Recent Developments
- 17.2.3.5. Financials (Based on Availability)
- 17.2.4 Cisco Systems Inc
- 17.2.4.1. Overview
- 17.2.4.2. Products
- 17.2.4.3. SWOT Analysis
- 17.2.4.4. Recent Developments
- 17.2.4.5. Financials (Based on Availability)
- 17.2.5 Siemens AG
- 17.2.5.1. Overview
- 17.2.5.2. Products
- 17.2.5.3. SWOT Analysis
- 17.2.5.4. Recent Developments
- 17.2.5.5. Financials (Based on Availability)
- 17.2.6 Schneider Electric SE
- 17.2.6.1. Overview
- 17.2.6.2. Products
- 17.2.6.3. SWOT Analysis
- 17.2.6.4. Recent Developments
- 17.2.6.5. Financials (Based on Availability)
- 17.2.7 Eaton Corporation PLC
- 17.2.7.1. Overview
- 17.2.7.2. Products
- 17.2.7.3. SWOT Analysis
- 17.2.7.4. Recent Developments
- 17.2.7.5. Financials (Based on Availability)
- 17.2.8 General Electric Company
- 17.2.8.1. Overview
- 17.2.8.2. Products
- 17.2.8.3. SWOT Analysis
- 17.2.8.4. Recent Developments
- 17.2.8.5. Financials (Based on Availability)
- 17.2.9 Honeywell International Inc *List Not Exhaustive
- 17.2.9.1. Overview
- 17.2.9.2. Products
- 17.2.9.3. SWOT Analysis
- 17.2.9.4. Recent Developments
- 17.2.9.5. Financials (Based on Availability)
- 17.2.10 Osaki Electric Co Ltd
- 17.2.10.1. Overview
- 17.2.10.2. Products
- 17.2.10.3. SWOT Analysis
- 17.2.10.4. Recent Developments
- 17.2.10.5. Financials (Based on Availability)
- 17.2.1 Itron Inc
List of Figures
- Figure 1: Global Smart Grid Networking Industry Revenue Breakdown (Million, %) by Region 2025 & 2033
- Figure 2: North America Smart Grid Networking Industry Revenue (Million), by Country 2025 & 2033
- Figure 3: North America Smart Grid Networking Industry Revenue Share (%), by Country 2025 & 2033
- Figure 4: Europe Smart Grid Networking Industry Revenue (Million), by Country 2025 & 2033
- Figure 5: Europe Smart Grid Networking Industry Revenue Share (%), by Country 2025 & 2033
- Figure 6: Asia Pacific Smart Grid Networking Industry Revenue (Million), by Country 2025 & 2033
- Figure 7: Asia Pacific Smart Grid Networking Industry Revenue Share (%), by Country 2025 & 2033
- Figure 8: South America Smart Grid Networking Industry Revenue (Million), by Country 2025 & 2033
- Figure 9: South America Smart Grid Networking Industry Revenue Share (%), by Country 2025 & 2033
- Figure 10: North America Smart Grid Networking Industry Revenue (Million), by Country 2025 & 2033
- Figure 11: North America Smart Grid Networking Industry Revenue Share (%), by Country 2025 & 2033
- Figure 12: MEA Smart Grid Networking Industry Revenue (Million), by Country 2025 & 2033
- Figure 13: MEA Smart Grid Networking Industry Revenue Share (%), by Country 2025 & 2033
- Figure 14: North America Smart Grid Networking Industry Revenue (Million), by Technology Application Area 2025 & 2033
- Figure 15: North America Smart Grid Networking Industry Revenue Share (%), by Technology Application Area 2025 & 2033
- Figure 16: North America Smart Grid Networking Industry Revenue (Million), by Country 2025 & 2033
- Figure 17: North America Smart Grid Networking Industry Revenue Share (%), by Country 2025 & 2033
- Figure 18: Europe Smart Grid Networking Industry Revenue (Million), by Technology Application Area 2025 & 2033
- Figure 19: Europe Smart Grid Networking Industry Revenue Share (%), by Technology Application Area 2025 & 2033
- Figure 20: Europe Smart Grid Networking Industry Revenue (Million), by Country 2025 & 2033
- Figure 21: Europe Smart Grid Networking Industry Revenue Share (%), by Country 2025 & 2033
- Figure 22: Asia Pacific Smart Grid Networking Industry Revenue (Million), by Technology Application Area 2025 & 2033
- Figure 23: Asia Pacific Smart Grid Networking Industry Revenue Share (%), by Technology Application Area 2025 & 2033
- Figure 24: Asia Pacific Smart Grid Networking Industry Revenue (Million), by Country 2025 & 2033
- Figure 25: Asia Pacific Smart Grid Networking Industry Revenue Share (%), by Country 2025 & 2033
- Figure 26: South America Smart Grid Networking Industry Revenue (Million), by Technology Application Area 2025 & 2033
- Figure 27: South America Smart Grid Networking Industry Revenue Share (%), by Technology Application Area 2025 & 2033
- Figure 28: South America Smart Grid Networking Industry Revenue (Million), by Country 2025 & 2033
- Figure 29: South America Smart Grid Networking Industry Revenue Share (%), by Country 2025 & 2033
- Figure 30: Middle East Smart Grid Networking Industry Revenue (Million), by Technology Application Area 2025 & 2033
- Figure 31: Middle East Smart Grid Networking Industry Revenue Share (%), by Technology Application Area 2025 & 2033
- Figure 32: Middle East Smart Grid Networking Industry Revenue (Million), by Country 2025 & 2033
- Figure 33: Middle East Smart Grid Networking Industry Revenue Share (%), by Country 2025 & 2033
List of Tables
- Table 1: Global Smart Grid Networking Industry Revenue Million Forecast, by Region 2020 & 2033
- Table 2: Global Smart Grid Networking Industry Revenue Million Forecast, by Technology Application Area 2020 & 2033
- Table 3: Global Smart Grid Networking Industry Revenue Million Forecast, by Region 2020 & 2033
- Table 4: Global Smart Grid Networking Industry Revenue Million Forecast, by Country 2020 & 2033
- Table 5: United States Smart Grid Networking Industry Revenue (Million) Forecast, by Application 2020 & 2033
- Table 6: Canada Smart Grid Networking Industry Revenue (Million) Forecast, by Application 2020 & 2033
- Table 7: Mexico Smart Grid Networking Industry Revenue (Million) Forecast, by Application 2020 & 2033
- Table 8: Global Smart Grid Networking Industry Revenue Million Forecast, by Country 2020 & 2033
- Table 9: Germany Smart Grid Networking Industry Revenue (Million) Forecast, by Application 2020 & 2033
- Table 10: United Kingdom Smart Grid Networking Industry Revenue (Million) Forecast, by Application 2020 & 2033
- Table 11: France Smart Grid Networking Industry Revenue (Million) Forecast, by Application 2020 & 2033
- Table 12: Spain Smart Grid Networking Industry Revenue (Million) Forecast, by Application 2020 & 2033
- Table 13: Italy Smart Grid Networking Industry Revenue (Million) Forecast, by Application 2020 & 2033
- Table 14: Spain Smart Grid Networking Industry Revenue (Million) Forecast, by Application 2020 & 2033
- Table 15: Belgium Smart Grid Networking Industry Revenue (Million) Forecast, by Application 2020 & 2033
- Table 16: Netherland Smart Grid Networking Industry Revenue (Million) Forecast, by Application 2020 & 2033
- Table 17: Nordics Smart Grid Networking Industry Revenue (Million) Forecast, by Application 2020 & 2033
- Table 18: Rest of Europe Smart Grid Networking Industry Revenue (Million) Forecast, by Application 2020 & 2033
- Table 19: Global Smart Grid Networking Industry Revenue Million Forecast, by Country 2020 & 2033
- Table 20: China Smart Grid Networking Industry Revenue (Million) Forecast, by Application 2020 & 2033
- Table 21: Japan Smart Grid Networking Industry Revenue (Million) Forecast, by Application 2020 & 2033
- Table 22: India Smart Grid Networking Industry Revenue (Million) Forecast, by Application 2020 & 2033
- Table 23: South Korea Smart Grid Networking Industry Revenue (Million) Forecast, by Application 2020 & 2033
- Table 24: Southeast Asia Smart Grid Networking Industry Revenue (Million) Forecast, by Application 2020 & 2033
- Table 25: Australia Smart Grid Networking Industry Revenue (Million) Forecast, by Application 2020 & 2033
- Table 26: Indonesia Smart Grid Networking Industry Revenue (Million) Forecast, by Application 2020 & 2033
- Table 27: Phillipes Smart Grid Networking Industry Revenue (Million) Forecast, by Application 2020 & 2033
- Table 28: Singapore Smart Grid Networking Industry Revenue (Million) Forecast, by Application 2020 & 2033
- Table 29: Thailandc Smart Grid Networking Industry Revenue (Million) Forecast, by Application 2020 & 2033
- Table 30: Rest of Asia Pacific Smart Grid Networking Industry Revenue (Million) Forecast, by Application 2020 & 2033
- Table 31: Global Smart Grid Networking Industry Revenue Million Forecast, by Country 2020 & 2033
- Table 32: Brazil Smart Grid Networking Industry Revenue (Million) Forecast, by Application 2020 & 2033
- Table 33: Argentina Smart Grid Networking Industry Revenue (Million) Forecast, by Application 2020 & 2033
- Table 34: Peru Smart Grid Networking Industry Revenue (Million) Forecast, by Application 2020 & 2033
- Table 35: Chile Smart Grid Networking Industry Revenue (Million) Forecast, by Application 2020 & 2033
- Table 36: Colombia Smart Grid Networking Industry Revenue (Million) Forecast, by Application 2020 & 2033
- Table 37: Ecuador Smart Grid Networking Industry Revenue (Million) Forecast, by Application 2020 & 2033
- Table 38: Venezuela Smart Grid Networking Industry Revenue (Million) Forecast, by Application 2020 & 2033
- Table 39: Rest of South America Smart Grid Networking Industry Revenue (Million) Forecast, by Application 2020 & 2033
- Table 40: Global Smart Grid Networking Industry Revenue Million Forecast, by Country 2020 & 2033
- Table 41: United States Smart Grid Networking Industry Revenue (Million) Forecast, by Application 2020 & 2033
- Table 42: Canada Smart Grid Networking Industry Revenue (Million) Forecast, by Application 2020 & 2033
- Table 43: Mexico Smart Grid Networking Industry Revenue (Million) Forecast, by Application 2020 & 2033
- Table 44: Global Smart Grid Networking Industry Revenue Million Forecast, by Country 2020 & 2033
- Table 45: United Arab Emirates Smart Grid Networking Industry Revenue (Million) Forecast, by Application 2020 & 2033
- Table 46: Saudi Arabia Smart Grid Networking Industry Revenue (Million) Forecast, by Application 2020 & 2033
- Table 47: South Africa Smart Grid Networking Industry Revenue (Million) Forecast, by Application 2020 & 2033
- Table 48: Rest of Middle East and Africa Smart Grid Networking Industry Revenue (Million) Forecast, by Application 2020 & 2033
- Table 49: Global Smart Grid Networking Industry Revenue Million Forecast, by Technology Application Area 2020 & 2033
- Table 50: Global Smart Grid Networking Industry Revenue Million Forecast, by Country 2020 & 2033
- Table 51: Global Smart Grid Networking Industry Revenue Million Forecast, by Technology Application Area 2020 & 2033
- Table 52: Global Smart Grid Networking Industry Revenue Million Forecast, by Country 2020 & 2033
- Table 53: Global Smart Grid Networking Industry Revenue Million Forecast, by Technology Application Area 2020 & 2033
- Table 54: Global Smart Grid Networking Industry Revenue Million Forecast, by Country 2020 & 2033
- Table 55: Global Smart Grid Networking Industry Revenue Million Forecast, by Technology Application Area 2020 & 2033
- Table 56: Global Smart Grid Networking Industry Revenue Million Forecast, by Country 2020 & 2033
- Table 57: Global Smart Grid Networking Industry Revenue Million Forecast, by Technology Application Area 2020 & 2033
- Table 58: Global Smart Grid Networking Industry Revenue Million Forecast, by Country 2020 & 2033
Frequently Asked Questions
1. What is the projected Compound Annual Growth Rate (CAGR) of the Smart Grid Networking Industry?
The projected CAGR is approximately > 11.00%.
2. Which companies are prominent players in the Smart Grid Networking Industry?
Key companies in the market include Itron Inc, ABB Ltd, Hitachi Ltd, Cisco Systems Inc, Siemens AG, Schneider Electric SE, Eaton Corporation PLC, General Electric Company, Honeywell International Inc *List Not Exhaustive, Osaki Electric Co Ltd.
3. What are the main segments of the Smart Grid Networking Industry?
The market segments include Technology Application Area.
4. Can you provide details about the market size?
The market size is estimated to be USD XX Million as of 2022.
5. What are some drivers contributing to market growth?
4.; Growing Power Demand from the Commercial and Industrial Sectors.
6. What are the notable trends driving market growth?
Advanced Metering Infrastructure (AMI) to Witness Significant Growth.
7. Are there any restraints impacting market growth?
4.; Stringent Environmental and Safety Regulations.
8. Can you provide examples of recent developments in the market?
In January 2021, Schneider Electric acquired DC Systems BV, a major supplier of smart systems. This acquisition has helped Schneider Electric advance innovations in the electrical distribution and smart grid sectors.
9. What pricing options are available for accessing the report?
Pricing options include single-user, multi-user, and enterprise licenses priced at USD 4750, USD 5250, and USD 8750 respectively.
10. Is the market size provided in terms of value or volume?
The market size is provided in terms of value, measured in Million.
11. Are there any specific market keywords associated with the report?
Yes, the market keyword associated with the report is "Smart Grid Networking Industry," which aids in identifying and referencing the specific market segment covered.
12. How do I determine which pricing option suits my needs best?
The pricing options vary based on user requirements and access needs. Individual users may opt for single-user licenses, while businesses requiring broader access may choose multi-user or enterprise licenses for cost-effective access to the report.
13. Are there any additional resources or data provided in the Smart Grid Networking Industry report?
While the report offers comprehensive insights, it's advisable to review the specific contents or supplementary materials provided to ascertain if additional resources or data are available.
14. How can I stay updated on further developments or reports in the Smart Grid Networking Industry?
To stay informed about further developments, trends, and reports in the Smart Grid Networking Industry, consider subscribing to industry newsletters, following relevant companies and organizations, or regularly checking reputable industry news sources and publications.
Methodology
Step 1 - Identification of Relevant Samples Size from Population Database


Step 2 - Approaches for Defining Global Market Size (Value, Volume* & Price*)

Note*: In applicable scenarios
Step 3 - Data Sources
Primary Research
- Web Analytics
- Survey Reports
- Research Institute
- Latest Research Reports
- Opinion Leaders
Secondary Research
- Annual Reports
- White Paper
- Latest Press Release
- Industry Association
- Paid Database
- Investor Presentations

Step 4 - Data Triangulation
Involves using different sources of information in order to increase the validity of a study
These sources are likely to be stakeholders in a program - participants, other researchers, program staff, other community members, and so on.
Then we put all data in single framework & apply various statistical tools to find out the dynamic on the market.
During the analysis stage, feedback from the stakeholder groups would be compared to determine areas of agreement as well as areas of divergence
