
Key Insights
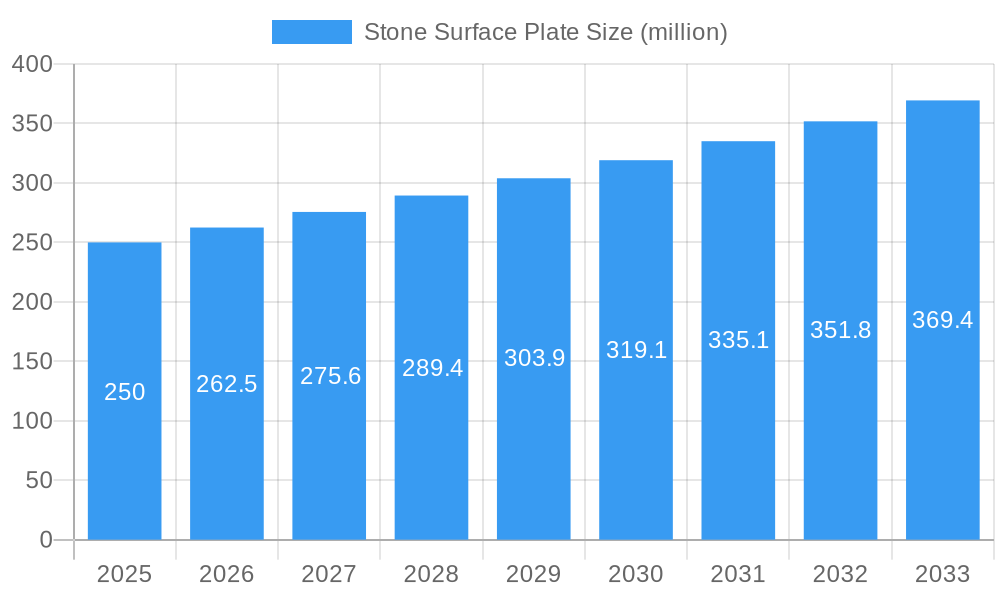
The global Stone Surface Plate market is poised for robust expansion, projected to reach an estimated USD 250 million in 2025 with a Compound Annual Growth Rate (CAGR) of 5% through 2033. This sustained growth is primarily propelled by the escalating demand from industrial manufacturing sectors, particularly in precision engineering and quality control applications. The increasing adoption of advanced metrology techniques and the need for highly stable and accurate measurement surfaces in industries such as aerospace, automotive, and electronics are significant drivers. Furthermore, the expanding R&D activities in laboratories across various scientific disciplines, requiring precise instrumentation and calibration, contribute to the market's upward trajectory. The market's inherent reliance on materials with superior thermal stability and wear resistance, such as granite and ceramic, ensures its continued relevance in applications demanding exceptional accuracy and durability.
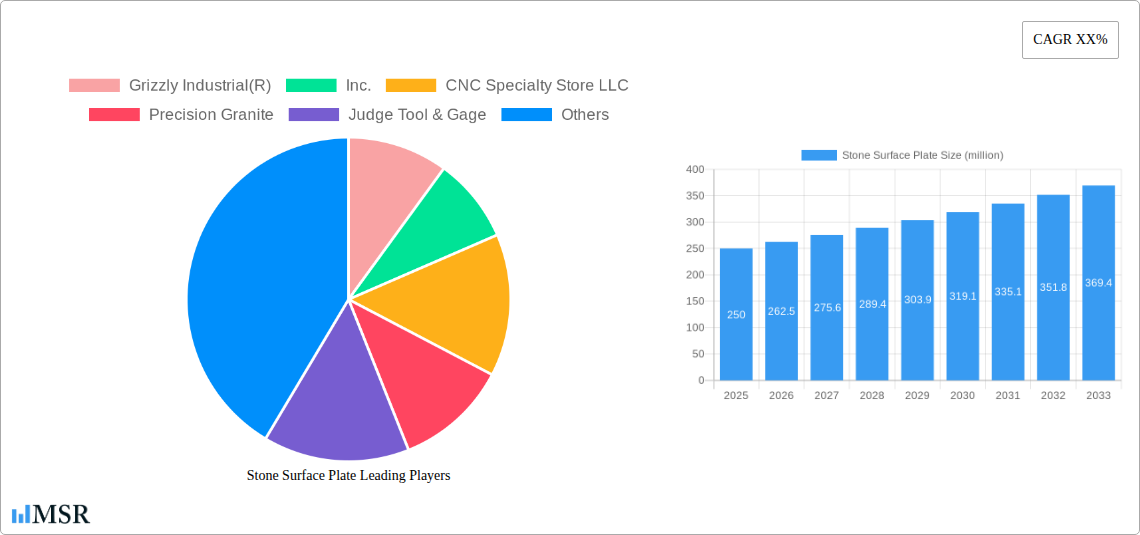
Stone Surface Plate Market Size (In Million)
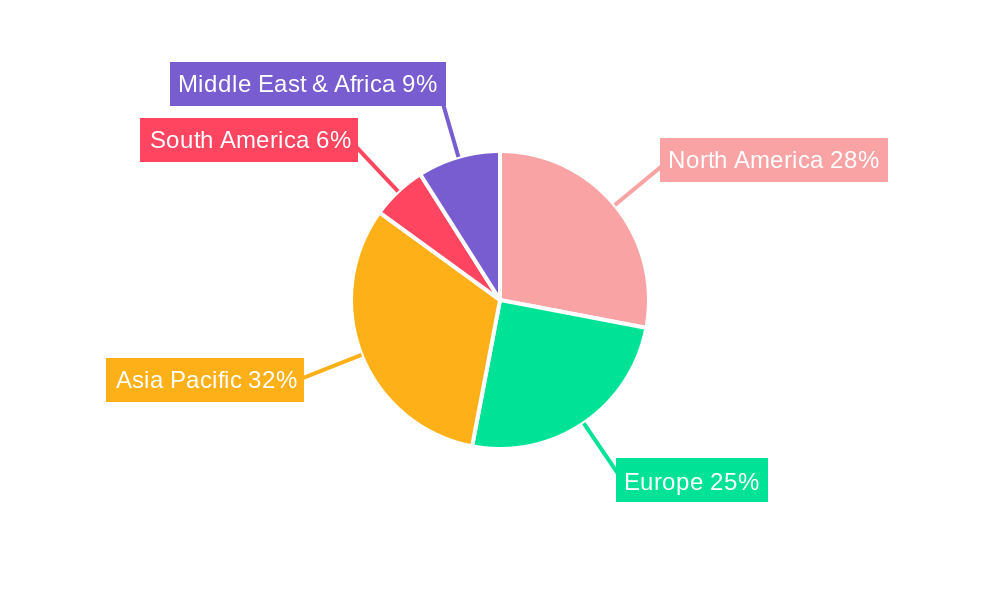
The market segmentation reveals a diverse landscape catering to specialized needs. The "Industrial Manufacturing" application segment is anticipated to lead in market share due to the critical role of stone surface plates in ensuring product quality and manufacturing precision. Within the "Types" segment, "Laboratory Grade" plates are expected to witness significant demand, driven by stringent accuracy requirements in research and development. Emerging trends include the development of advanced composite materials for surface plates, offering enhanced performance characteristics and potentially reducing reliance on traditional stone. However, potential challenges such as the high initial cost of premium quality stone surface plates and the availability of alternative materials like ceramic or composite surfaces could pose moderate restraints. Geographically, the Asia Pacific region, led by China and India, is expected to emerge as a key growth hub, fueled by rapid industrialization and increasing investments in manufacturing infrastructure. North America and Europe are expected to maintain their positions as significant markets, driven by established industrial bases and advanced technological adoption.
Stone Surface Plate Company Market Share
Unveiling the Global Stone Surface Plate Market: Comprehensive Analysis and Strategic Outlook (2019-2033)
This in-depth report provides a definitive analysis of the global Stone Surface Plate market, meticulously tracking its trajectory from 2019 to 2033. With a base year of 2025, the report delves into historical performance, current dynamics, and projected growth across key segments and applications. Understand the intricate forces shaping the precision measuring instruments landscape, from industrial manufacturing and laboratory environments to specialized inspection grade and laboratory grade surface plates. This report is indispensable for precision tooling, metrology, and quality control stakeholders seeking to navigate this vital sector.
Stone Surface Plate Market Concentration & Dynamics
The global Stone Surface Plate market exhibits a moderate to high concentration, with key players dominating the landscape. Innovation ecosystems are driven by advancements in material science and manufacturing processes, leading to enhanced accuracy and durability of granite surface plates and other stone-based solutions. Regulatory frameworks, particularly those concerning industrial standards and laboratory certifications, play a crucial role in market access and product development. The threat of substitute products, such as alternative flat surfaces and advanced digital measurement systems, is present but largely mitigated by the inherent stability, thermal properties, and cost-effectiveness of stone surface plates, especially in demanding precision engineering applications. End-user trends indicate a growing demand for higher precision, larger format surface plates, and customized solutions tailored to specific industrial needs. Mergers and acquisitions (M&A) activities, though not extremely frequent, serve as key indicators of market consolidation and strategic expansion within the industry. M&A deal counts are estimated to be between 5-10 significant transactions over the forecast period, with a market share distribution showing the top 5-7 companies holding approximately 60-70% of the global market. The increasing emphasis on quality assurance and metrological calibration across industries fuels the sustained demand for reliable stone surface plates.
Stone Surface Plate Industry Insights & Trends
The Stone Surface Plate industry is poised for substantial growth, driven by several interconnected factors and evolving trends. The global market size is projected to reach approximately $750 million by 2025, with a projected Compound Annual Growth Rate (CAGR) of 4.5% during the forecast period of 2025–2033. This growth is underpinned by the relentless pursuit of precision and accuracy in sectors such as automotive manufacturing, aerospace, electronics, and advanced research. Technological disruptions are primarily focused on improving the flatness, stability, and surface finish of stone plates through advanced lapping and polishing techniques, as well as the integration of sensor technologies for real-time monitoring. The development of new composite stone materials and enhanced manufacturing processes contributes to the creation of lighter, stronger, and more dimensionally stable surface plates. Evolving consumer behaviors reflect a demand for not only high-performance products but also for comprehensive support services, including calibration, maintenance, and bespoke design solutions. The increasing adoption of Industry 4.0 principles, emphasizing automation and data-driven decision-making, further accentuates the need for accurate and reliable metrology tools like stone surface plates. The growth of emerging economies and the associated industrialization efforts are also significant contributors to market expansion. Furthermore, the critical role of stone surface plates in ensuring the quality and integrity of manufactured goods, from microelectronic components to large industrial machinery, solidifies their indispensable position in modern industrial operations. The ongoing research into novel stone compositions and advanced manufacturing techniques is expected to drive further innovation and market expansion. The demand for custom surface plates and solutions that meet stringent international standards will continue to be a key trend.
Key Markets & Segments Leading Stone Surface Plate
The Industrial Manufacturing segment is the undisputed leader in the global Stone Surface Plate market, driven by widespread adoption across diverse manufacturing verticals. This dominance is fueled by several key factors:
- Economic Growth and Industrialization: Rapid industrial expansion in developing economies, particularly in Asia-Pacific and emerging markets, creates a robust demand for precision tooling and metrology equipment.
- Automotive Industry: The automotive sector, with its stringent quality control requirements for engine components, chassis, and assembly lines, is a major consumer of industrial grade and inspection grade surface plates.
- Aerospace and Defense: The precision demands of aircraft manufacturing, missile systems, and defense equipment necessitate the use of highly accurate stone surface plates for critical component inspection and assembly.
- Electronics Manufacturing: The miniaturization and increasing complexity of electronic components require exceptionally precise measurement and assembly surfaces.
Within this segment, Inspection Grade and Workshop Grade surface plates represent the largest sub-segments, catering to a broad spectrum of inspection and assembly tasks.
The Laboratory Environment segment, while smaller in volume, contributes significantly to market value due to the higher precision requirements and the prevalence of Laboratory Grade surface plates.
- Scientific Research and Development: Research institutions, universities, and advanced R&D centers utilize these plates for delicate experiments, calibration of sensitive instruments, and the development of new technologies.
- Metrology and Calibration Laboratories: Dedicated metrology labs rely on laboratory grade surface plates for calibrating measuring instruments and ensuring the accuracy of standards.
- Pharmaceutical and Biotechnology: These industries demand highly sterile and precise environments, making laboratory grade surface plates essential for quality control and research.
The Rough Grade segment serves niche applications where extreme flatness is not the primary concern but a stable, durable surface is required, such as for general fixturing or heavier-duty workshop tasks.
Geographically, North America and Europe continue to be significant markets due to their established industrial base and strong emphasis on quality and innovation. However, the Asia-Pacific region is exhibiting the fastest growth, driven by rapid industrialization, increasing manufacturing capabilities, and government initiatives promoting advanced manufacturing and quality standards. Countries like China, India, and South Korea are key growth engines within this region.
Stone Surface Plate Product Developments
Recent product developments in the Stone Surface Plate market are centered on enhancing precision, improving portability, and integrating smart functionalities. Innovations include the use of advanced composite materials for lighter yet equally stable plates, superior surface finishes achieved through sophisticated lapping and polishing techniques, and the incorporation of modular designs for easier customization and expansion. The development of self-leveling and temperature-compensated surface plates is also gaining traction, addressing critical environmental factors that affect measurement accuracy. These advancements provide competitive edges by enabling users to achieve higher levels of measurement fidelity, streamline their inspection processes, and adapt to evolving industrial demands. The focus remains on delivering robust, reliable, and accurate metrology solutions for critical applications across various industries.
Challenges in the Stone Surface Plate Market
The Stone Surface Plate market faces several challenges that influence its growth trajectory. These include:
- High initial cost of premium-grade plates: The investment for high-precision laboratory grade and inspection grade surface plates can be substantial, posing a barrier for smaller businesses.
- Logistical complexities: The weight and fragility of large stone surface plates present significant challenges in transportation, installation, and handling, leading to increased costs and potential for damage.
- Competition from alternative materials and technologies: While stone remains a benchmark, advancements in composite materials and digital measurement systems offer alternative solutions that may be perceived as more cost-effective or user-friendly in certain applications.
- Need for regular calibration and maintenance: Maintaining the required level of accuracy necessitates periodic calibration and careful handling, adding to the ongoing operational costs.
- Stringent environmental control requirements: Achieving and maintaining optimal environmental conditions (temperature, humidity, vibration) for the highest precision applications can be resource-intensive.
Forces Driving Stone Surface Plate Growth
Several key forces are propelling the growth of the Stone Surface Plate market. The ever-increasing demand for high-precision manufacturing across sectors like aerospace, automotive, and electronics is a primary driver. As products become more complex and tolerances tighter, the need for accurate reference surfaces becomes paramount. Technological advancements in manufacturing processes, particularly in the development of more durable and dimensionally stable granite and other stone composites, enhance product performance and appeal. Furthermore, the global emphasis on quality control and assurance standards, driven by regulatory bodies and customer expectations, necessitates the use of reliable metrology equipment, including stone surface plates. The expanding industrial base in emerging economies is also a significant growth catalyst, as these regions invest in modern manufacturing infrastructure and adopt global quality benchmarks.
Challenges in the Stone Surface Plate Market
Looking ahead, long-term growth catalysts for the Stone Surface Plate market are deeply rooted in innovation and market expansion. The continuous pursuit of higher accuracy and enhanced material properties in stone surface plates will ensure their continued relevance. Strategic partnerships between manufacturers and end-users to develop bespoke solutions for niche applications will open new avenues for growth. The increasing adoption of smart technologies, such as integrated sensors for real-time monitoring of surface flatness and environmental conditions, will add value and create new market opportunities. Furthermore, expanding the reach into underserved emerging markets with tailored product offerings and localized support will be crucial for sustained long-term expansion and market penetration. The development of more sustainable manufacturing practices and recyclable materials could also become a significant long-term growth factor.
Emerging Opportunities in Stone Surface Plate
Emerging opportunities in the Stone Surface Plate market are characterized by technological integration and the exploration of new application frontiers. The development of smart surface plates with embedded sensors for real-time data acquisition on flatness, vibration, and temperature presents a significant opportunity for enhanced performance monitoring and predictive maintenance. The growing demand for large-format surface plates in advanced manufacturing sectors, such as additive manufacturing (3D printing) of large components and robotics assembly, is another key trend. Furthermore, the integration of augmented reality (AR) and virtual reality (VR) technologies with stone surface plates for advanced inspection and assembly guidance could unlock new user experiences and efficiencies. The increasing focus on sustainable materials and manufacturing processes offers opportunities for eco-friendly stone solutions.
Leading Players in the Stone Surface Plate Sector
- Grizzly Industrial(R),Inc.
- CNC Specialty Store LLC
- Precision Granite
- Judge Tool & Gage
- Shars Tool
- Productivity Quality Inc
- TDC CO.,LTD.
- CHUO PRECISION INDUSTRIAL
Key Milestones in Stone Surface Plate Industry
- 2019: Increased focus on ultra-precision lapping techniques for enhanced flatness in laboratory grade surface plates.
- 2020: Introduction of lighter composite granite formulations for easier installation and handling.
- 2021: Growing adoption of inspection grade surface plates in advanced electronics manufacturing.
- 2022: Development of modular custom surface plates for flexible industrial applications.
- 2023: Emergence of early-stage smart surface plate concepts with basic sensor integration.
- 2024: Enhanced regulatory focus on calibration traceability and metrology standards for industrial applications.
- 2025 (Estimated): Significant market growth projected due to post-pandemic industrial recovery and investments in advanced manufacturing.
- 2026-2033 (Forecast): Continued innovation in material science, smart technologies, and expansion into emerging markets.
Strategic Outlook for Stone Surface Plate Market
The strategic outlook for the Stone Surface Plate market is one of robust and sustained growth, driven by an unwavering demand for precision and accuracy in industrial and scientific applications. Key growth accelerators include the continuous innovation in material science leading to even more stable and precise plates, the integration of smart technologies for enhanced functionality and data analysis, and the strategic expansion into high-growth emerging markets. Companies that focus on developing value-added services, such as advanced calibration, custom solutions, and comprehensive technical support, will be well-positioned to capture market share. The increasing global emphasis on quality control and adherence to international standards will further solidify the indispensable role of stone surface plates in ensuring product integrity and driving technological advancements across a multitude of industries. The market is expected to witness a CAGR of approximately 4.5% through 2033, reaching an estimated $750 million by 2025, signifying a healthy and promising future.
Stone Surface Plate Segmentation
-
1. Application
- 1.1. Industrial Manufacturing
- 1.2. Laboratory Environment
- 1.3. Others
-
2. Types
- 2.1. Laboratory Grade
- 2.2. Inspection Grade
- 2.3. Workshop Grade
- 2.4. Rough Grade
Stone Surface Plate Segmentation By Geography
-
1. North America
- 1.1. United States
- 1.2. Canada
- 1.3. Mexico
-
2. South America
- 2.1. Brazil
- 2.2. Argentina
- 2.3. Rest of South America
-
3. Europe
- 3.1. United Kingdom
- 3.2. Germany
- 3.3. France
- 3.4. Italy
- 3.5. Spain
- 3.6. Russia
- 3.7. Benelux
- 3.8. Nordics
- 3.9. Rest of Europe
-
4. Middle East & Africa
- 4.1. Turkey
- 4.2. Israel
- 4.3. GCC
- 4.4. North Africa
- 4.5. South Africa
- 4.6. Rest of Middle East & Africa
-
5. Asia Pacific
- 5.1. China
- 5.2. India
- 5.3. Japan
- 5.4. South Korea
- 5.5. ASEAN
- 5.6. Oceania
- 5.7. Rest of Asia Pacific
Stone Surface Plate Regional Market Share
Geographic Coverage of Stone Surface Plate
Stone Surface Plate REPORT HIGHLIGHTS
| Aspects | Details |
|---|---|
| Study Period | 2020-2034 |
| Base Year | 2025 |
| Estimated Year | 2026 |
| Forecast Period | 2026-2034 |
| Historical Period | 2020-2025 |
| Growth Rate | CAGR of 5% from 2020-2034 |
| Segmentation |
|
Table of Contents
- 1. Introduction
- 1.1. Research Scope
- 1.2. Market Segmentation
- 1.3. Research Methodology
- 1.4. Definitions and Assumptions
- 2. Executive Summary
- 2.1. Introduction
- 3. Market Dynamics
- 3.1. Introduction
- 3.2. Market Drivers
- 3.3. Market Restrains
- 3.4. Market Trends
- 4. Market Factor Analysis
- 4.1. Porters Five Forces
- 4.2. Supply/Value Chain
- 4.3. PESTEL analysis
- 4.4. Market Entropy
- 4.5. Patent/Trademark Analysis
- 5. Global Stone Surface Plate Analysis, Insights and Forecast, 2020-2032
- 5.1. Market Analysis, Insights and Forecast - by Application
- 5.1.1. Industrial Manufacturing
- 5.1.2. Laboratory Environment
- 5.1.3. Others
- 5.2. Market Analysis, Insights and Forecast - by Types
- 5.2.1. Laboratory Grade
- 5.2.2. Inspection Grade
- 5.2.3. Workshop Grade
- 5.2.4. Rough Grade
- 5.3. Market Analysis, Insights and Forecast - by Region
- 5.3.1. North America
- 5.3.2. South America
- 5.3.3. Europe
- 5.3.4. Middle East & Africa
- 5.3.5. Asia Pacific
- 5.1. Market Analysis, Insights and Forecast - by Application
- 6. North America Stone Surface Plate Analysis, Insights and Forecast, 2020-2032
- 6.1. Market Analysis, Insights and Forecast - by Application
- 6.1.1. Industrial Manufacturing
- 6.1.2. Laboratory Environment
- 6.1.3. Others
- 6.2. Market Analysis, Insights and Forecast - by Types
- 6.2.1. Laboratory Grade
- 6.2.2. Inspection Grade
- 6.2.3. Workshop Grade
- 6.2.4. Rough Grade
- 6.1. Market Analysis, Insights and Forecast - by Application
- 7. South America Stone Surface Plate Analysis, Insights and Forecast, 2020-2032
- 7.1. Market Analysis, Insights and Forecast - by Application
- 7.1.1. Industrial Manufacturing
- 7.1.2. Laboratory Environment
- 7.1.3. Others
- 7.2. Market Analysis, Insights and Forecast - by Types
- 7.2.1. Laboratory Grade
- 7.2.2. Inspection Grade
- 7.2.3. Workshop Grade
- 7.2.4. Rough Grade
- 7.1. Market Analysis, Insights and Forecast - by Application
- 8. Europe Stone Surface Plate Analysis, Insights and Forecast, 2020-2032
- 8.1. Market Analysis, Insights and Forecast - by Application
- 8.1.1. Industrial Manufacturing
- 8.1.2. Laboratory Environment
- 8.1.3. Others
- 8.2. Market Analysis, Insights and Forecast - by Types
- 8.2.1. Laboratory Grade
- 8.2.2. Inspection Grade
- 8.2.3. Workshop Grade
- 8.2.4. Rough Grade
- 8.1. Market Analysis, Insights and Forecast - by Application
- 9. Middle East & Africa Stone Surface Plate Analysis, Insights and Forecast, 2020-2032
- 9.1. Market Analysis, Insights and Forecast - by Application
- 9.1.1. Industrial Manufacturing
- 9.1.2. Laboratory Environment
- 9.1.3. Others
- 9.2. Market Analysis, Insights and Forecast - by Types
- 9.2.1. Laboratory Grade
- 9.2.2. Inspection Grade
- 9.2.3. Workshop Grade
- 9.2.4. Rough Grade
- 9.1. Market Analysis, Insights and Forecast - by Application
- 10. Asia Pacific Stone Surface Plate Analysis, Insights and Forecast, 2020-2032
- 10.1. Market Analysis, Insights and Forecast - by Application
- 10.1.1. Industrial Manufacturing
- 10.1.2. Laboratory Environment
- 10.1.3. Others
- 10.2. Market Analysis, Insights and Forecast - by Types
- 10.2.1. Laboratory Grade
- 10.2.2. Inspection Grade
- 10.2.3. Workshop Grade
- 10.2.4. Rough Grade
- 10.1. Market Analysis, Insights and Forecast - by Application
- 11. Competitive Analysis
- 11.1. Global Market Share Analysis 2025
- 11.2. Company Profiles
- 11.2.1 Grizzly Industrial(R)
- 11.2.1.1. Overview
- 11.2.1.2. Products
- 11.2.1.3. SWOT Analysis
- 11.2.1.4. Recent Developments
- 11.2.1.5. Financials (Based on Availability)
- 11.2.2 Inc.
- 11.2.2.1. Overview
- 11.2.2.2. Products
- 11.2.2.3. SWOT Analysis
- 11.2.2.4. Recent Developments
- 11.2.2.5. Financials (Based on Availability)
- 11.2.3 CNC Specialty Store LLC
- 11.2.3.1. Overview
- 11.2.3.2. Products
- 11.2.3.3. SWOT Analysis
- 11.2.3.4. Recent Developments
- 11.2.3.5. Financials (Based on Availability)
- 11.2.4 Precision Granite
- 11.2.4.1. Overview
- 11.2.4.2. Products
- 11.2.4.3. SWOT Analysis
- 11.2.4.4. Recent Developments
- 11.2.4.5. Financials (Based on Availability)
- 11.2.5 Judge Tool & Gage
- 11.2.5.1. Overview
- 11.2.5.2. Products
- 11.2.5.3. SWOT Analysis
- 11.2.5.4. Recent Developments
- 11.2.5.5. Financials (Based on Availability)
- 11.2.6 Shars Tool
- 11.2.6.1. Overview
- 11.2.6.2. Products
- 11.2.6.3. SWOT Analysis
- 11.2.6.4. Recent Developments
- 11.2.6.5. Financials (Based on Availability)
- 11.2.7 Productivity Quality Inc
- 11.2.7.1. Overview
- 11.2.7.2. Products
- 11.2.7.3. SWOT Analysis
- 11.2.7.4. Recent Developments
- 11.2.7.5. Financials (Based on Availability)
- 11.2.8 TDC CO.
- 11.2.8.1. Overview
- 11.2.8.2. Products
- 11.2.8.3. SWOT Analysis
- 11.2.8.4. Recent Developments
- 11.2.8.5. Financials (Based on Availability)
- 11.2.9 LTD.
- 11.2.9.1. Overview
- 11.2.9.2. Products
- 11.2.9.3. SWOT Analysis
- 11.2.9.4. Recent Developments
- 11.2.9.5. Financials (Based on Availability)
- 11.2.10 CHUO PRECISION INDUSTRIAL
- 11.2.10.1. Overview
- 11.2.10.2. Products
- 11.2.10.3. SWOT Analysis
- 11.2.10.4. Recent Developments
- 11.2.10.5. Financials (Based on Availability)
- 11.2.1 Grizzly Industrial(R)
List of Figures
- Figure 1: Global Stone Surface Plate Revenue Breakdown (undefined, %) by Region 2025 & 2033
- Figure 2: Global Stone Surface Plate Volume Breakdown (K, %) by Region 2025 & 2033
- Figure 3: North America Stone Surface Plate Revenue (undefined), by Application 2025 & 2033
- Figure 4: North America Stone Surface Plate Volume (K), by Application 2025 & 2033
- Figure 5: North America Stone Surface Plate Revenue Share (%), by Application 2025 & 2033
- Figure 6: North America Stone Surface Plate Volume Share (%), by Application 2025 & 2033
- Figure 7: North America Stone Surface Plate Revenue (undefined), by Types 2025 & 2033
- Figure 8: North America Stone Surface Plate Volume (K), by Types 2025 & 2033
- Figure 9: North America Stone Surface Plate Revenue Share (%), by Types 2025 & 2033
- Figure 10: North America Stone Surface Plate Volume Share (%), by Types 2025 & 2033
- Figure 11: North America Stone Surface Plate Revenue (undefined), by Country 2025 & 2033
- Figure 12: North America Stone Surface Plate Volume (K), by Country 2025 & 2033
- Figure 13: North America Stone Surface Plate Revenue Share (%), by Country 2025 & 2033
- Figure 14: North America Stone Surface Plate Volume Share (%), by Country 2025 & 2033
- Figure 15: South America Stone Surface Plate Revenue (undefined), by Application 2025 & 2033
- Figure 16: South America Stone Surface Plate Volume (K), by Application 2025 & 2033
- Figure 17: South America Stone Surface Plate Revenue Share (%), by Application 2025 & 2033
- Figure 18: South America Stone Surface Plate Volume Share (%), by Application 2025 & 2033
- Figure 19: South America Stone Surface Plate Revenue (undefined), by Types 2025 & 2033
- Figure 20: South America Stone Surface Plate Volume (K), by Types 2025 & 2033
- Figure 21: South America Stone Surface Plate Revenue Share (%), by Types 2025 & 2033
- Figure 22: South America Stone Surface Plate Volume Share (%), by Types 2025 & 2033
- Figure 23: South America Stone Surface Plate Revenue (undefined), by Country 2025 & 2033
- Figure 24: South America Stone Surface Plate Volume (K), by Country 2025 & 2033
- Figure 25: South America Stone Surface Plate Revenue Share (%), by Country 2025 & 2033
- Figure 26: South America Stone Surface Plate Volume Share (%), by Country 2025 & 2033
- Figure 27: Europe Stone Surface Plate Revenue (undefined), by Application 2025 & 2033
- Figure 28: Europe Stone Surface Plate Volume (K), by Application 2025 & 2033
- Figure 29: Europe Stone Surface Plate Revenue Share (%), by Application 2025 & 2033
- Figure 30: Europe Stone Surface Plate Volume Share (%), by Application 2025 & 2033
- Figure 31: Europe Stone Surface Plate Revenue (undefined), by Types 2025 & 2033
- Figure 32: Europe Stone Surface Plate Volume (K), by Types 2025 & 2033
- Figure 33: Europe Stone Surface Plate Revenue Share (%), by Types 2025 & 2033
- Figure 34: Europe Stone Surface Plate Volume Share (%), by Types 2025 & 2033
- Figure 35: Europe Stone Surface Plate Revenue (undefined), by Country 2025 & 2033
- Figure 36: Europe Stone Surface Plate Volume (K), by Country 2025 & 2033
- Figure 37: Europe Stone Surface Plate Revenue Share (%), by Country 2025 & 2033
- Figure 38: Europe Stone Surface Plate Volume Share (%), by Country 2025 & 2033
- Figure 39: Middle East & Africa Stone Surface Plate Revenue (undefined), by Application 2025 & 2033
- Figure 40: Middle East & Africa Stone Surface Plate Volume (K), by Application 2025 & 2033
- Figure 41: Middle East & Africa Stone Surface Plate Revenue Share (%), by Application 2025 & 2033
- Figure 42: Middle East & Africa Stone Surface Plate Volume Share (%), by Application 2025 & 2033
- Figure 43: Middle East & Africa Stone Surface Plate Revenue (undefined), by Types 2025 & 2033
- Figure 44: Middle East & Africa Stone Surface Plate Volume (K), by Types 2025 & 2033
- Figure 45: Middle East & Africa Stone Surface Plate Revenue Share (%), by Types 2025 & 2033
- Figure 46: Middle East & Africa Stone Surface Plate Volume Share (%), by Types 2025 & 2033
- Figure 47: Middle East & Africa Stone Surface Plate Revenue (undefined), by Country 2025 & 2033
- Figure 48: Middle East & Africa Stone Surface Plate Volume (K), by Country 2025 & 2033
- Figure 49: Middle East & Africa Stone Surface Plate Revenue Share (%), by Country 2025 & 2033
- Figure 50: Middle East & Africa Stone Surface Plate Volume Share (%), by Country 2025 & 2033
- Figure 51: Asia Pacific Stone Surface Plate Revenue (undefined), by Application 2025 & 2033
- Figure 52: Asia Pacific Stone Surface Plate Volume (K), by Application 2025 & 2033
- Figure 53: Asia Pacific Stone Surface Plate Revenue Share (%), by Application 2025 & 2033
- Figure 54: Asia Pacific Stone Surface Plate Volume Share (%), by Application 2025 & 2033
- Figure 55: Asia Pacific Stone Surface Plate Revenue (undefined), by Types 2025 & 2033
- Figure 56: Asia Pacific Stone Surface Plate Volume (K), by Types 2025 & 2033
- Figure 57: Asia Pacific Stone Surface Plate Revenue Share (%), by Types 2025 & 2033
- Figure 58: Asia Pacific Stone Surface Plate Volume Share (%), by Types 2025 & 2033
- Figure 59: Asia Pacific Stone Surface Plate Revenue (undefined), by Country 2025 & 2033
- Figure 60: Asia Pacific Stone Surface Plate Volume (K), by Country 2025 & 2033
- Figure 61: Asia Pacific Stone Surface Plate Revenue Share (%), by Country 2025 & 2033
- Figure 62: Asia Pacific Stone Surface Plate Volume Share (%), by Country 2025 & 2033
List of Tables
- Table 1: Global Stone Surface Plate Revenue undefined Forecast, by Region 2020 & 2033
- Table 2: Global Stone Surface Plate Volume K Forecast, by Region 2020 & 2033
- Table 3: Global Stone Surface Plate Revenue undefined Forecast, by Application 2020 & 2033
- Table 4: Global Stone Surface Plate Volume K Forecast, by Application 2020 & 2033
- Table 5: Global Stone Surface Plate Revenue undefined Forecast, by Types 2020 & 2033
- Table 6: Global Stone Surface Plate Volume K Forecast, by Types 2020 & 2033
- Table 7: Global Stone Surface Plate Revenue undefined Forecast, by Region 2020 & 2033
- Table 8: Global Stone Surface Plate Volume K Forecast, by Region 2020 & 2033
- Table 9: Global Stone Surface Plate Revenue undefined Forecast, by Application 2020 & 2033
- Table 10: Global Stone Surface Plate Volume K Forecast, by Application 2020 & 2033
- Table 11: Global Stone Surface Plate Revenue undefined Forecast, by Types 2020 & 2033
- Table 12: Global Stone Surface Plate Volume K Forecast, by Types 2020 & 2033
- Table 13: Global Stone Surface Plate Revenue undefined Forecast, by Country 2020 & 2033
- Table 14: Global Stone Surface Plate Volume K Forecast, by Country 2020 & 2033
- Table 15: United States Stone Surface Plate Revenue (undefined) Forecast, by Application 2020 & 2033
- Table 16: United States Stone Surface Plate Volume (K) Forecast, by Application 2020 & 2033
- Table 17: Canada Stone Surface Plate Revenue (undefined) Forecast, by Application 2020 & 2033
- Table 18: Canada Stone Surface Plate Volume (K) Forecast, by Application 2020 & 2033
- Table 19: Mexico Stone Surface Plate Revenue (undefined) Forecast, by Application 2020 & 2033
- Table 20: Mexico Stone Surface Plate Volume (K) Forecast, by Application 2020 & 2033
- Table 21: Global Stone Surface Plate Revenue undefined Forecast, by Application 2020 & 2033
- Table 22: Global Stone Surface Plate Volume K Forecast, by Application 2020 & 2033
- Table 23: Global Stone Surface Plate Revenue undefined Forecast, by Types 2020 & 2033
- Table 24: Global Stone Surface Plate Volume K Forecast, by Types 2020 & 2033
- Table 25: Global Stone Surface Plate Revenue undefined Forecast, by Country 2020 & 2033
- Table 26: Global Stone Surface Plate Volume K Forecast, by Country 2020 & 2033
- Table 27: Brazil Stone Surface Plate Revenue (undefined) Forecast, by Application 2020 & 2033
- Table 28: Brazil Stone Surface Plate Volume (K) Forecast, by Application 2020 & 2033
- Table 29: Argentina Stone Surface Plate Revenue (undefined) Forecast, by Application 2020 & 2033
- Table 30: Argentina Stone Surface Plate Volume (K) Forecast, by Application 2020 & 2033
- Table 31: Rest of South America Stone Surface Plate Revenue (undefined) Forecast, by Application 2020 & 2033
- Table 32: Rest of South America Stone Surface Plate Volume (K) Forecast, by Application 2020 & 2033
- Table 33: Global Stone Surface Plate Revenue undefined Forecast, by Application 2020 & 2033
- Table 34: Global Stone Surface Plate Volume K Forecast, by Application 2020 & 2033
- Table 35: Global Stone Surface Plate Revenue undefined Forecast, by Types 2020 & 2033
- Table 36: Global Stone Surface Plate Volume K Forecast, by Types 2020 & 2033
- Table 37: Global Stone Surface Plate Revenue undefined Forecast, by Country 2020 & 2033
- Table 38: Global Stone Surface Plate Volume K Forecast, by Country 2020 & 2033
- Table 39: United Kingdom Stone Surface Plate Revenue (undefined) Forecast, by Application 2020 & 2033
- Table 40: United Kingdom Stone Surface Plate Volume (K) Forecast, by Application 2020 & 2033
- Table 41: Germany Stone Surface Plate Revenue (undefined) Forecast, by Application 2020 & 2033
- Table 42: Germany Stone Surface Plate Volume (K) Forecast, by Application 2020 & 2033
- Table 43: France Stone Surface Plate Revenue (undefined) Forecast, by Application 2020 & 2033
- Table 44: France Stone Surface Plate Volume (K) Forecast, by Application 2020 & 2033
- Table 45: Italy Stone Surface Plate Revenue (undefined) Forecast, by Application 2020 & 2033
- Table 46: Italy Stone Surface Plate Volume (K) Forecast, by Application 2020 & 2033
- Table 47: Spain Stone Surface Plate Revenue (undefined) Forecast, by Application 2020 & 2033
- Table 48: Spain Stone Surface Plate Volume (K) Forecast, by Application 2020 & 2033
- Table 49: Russia Stone Surface Plate Revenue (undefined) Forecast, by Application 2020 & 2033
- Table 50: Russia Stone Surface Plate Volume (K) Forecast, by Application 2020 & 2033
- Table 51: Benelux Stone Surface Plate Revenue (undefined) Forecast, by Application 2020 & 2033
- Table 52: Benelux Stone Surface Plate Volume (K) Forecast, by Application 2020 & 2033
- Table 53: Nordics Stone Surface Plate Revenue (undefined) Forecast, by Application 2020 & 2033
- Table 54: Nordics Stone Surface Plate Volume (K) Forecast, by Application 2020 & 2033
- Table 55: Rest of Europe Stone Surface Plate Revenue (undefined) Forecast, by Application 2020 & 2033
- Table 56: Rest of Europe Stone Surface Plate Volume (K) Forecast, by Application 2020 & 2033
- Table 57: Global Stone Surface Plate Revenue undefined Forecast, by Application 2020 & 2033
- Table 58: Global Stone Surface Plate Volume K Forecast, by Application 2020 & 2033
- Table 59: Global Stone Surface Plate Revenue undefined Forecast, by Types 2020 & 2033
- Table 60: Global Stone Surface Plate Volume K Forecast, by Types 2020 & 2033
- Table 61: Global Stone Surface Plate Revenue undefined Forecast, by Country 2020 & 2033
- Table 62: Global Stone Surface Plate Volume K Forecast, by Country 2020 & 2033
- Table 63: Turkey Stone Surface Plate Revenue (undefined) Forecast, by Application 2020 & 2033
- Table 64: Turkey Stone Surface Plate Volume (K) Forecast, by Application 2020 & 2033
- Table 65: Israel Stone Surface Plate Revenue (undefined) Forecast, by Application 2020 & 2033
- Table 66: Israel Stone Surface Plate Volume (K) Forecast, by Application 2020 & 2033
- Table 67: GCC Stone Surface Plate Revenue (undefined) Forecast, by Application 2020 & 2033
- Table 68: GCC Stone Surface Plate Volume (K) Forecast, by Application 2020 & 2033
- Table 69: North Africa Stone Surface Plate Revenue (undefined) Forecast, by Application 2020 & 2033
- Table 70: North Africa Stone Surface Plate Volume (K) Forecast, by Application 2020 & 2033
- Table 71: South Africa Stone Surface Plate Revenue (undefined) Forecast, by Application 2020 & 2033
- Table 72: South Africa Stone Surface Plate Volume (K) Forecast, by Application 2020 & 2033
- Table 73: Rest of Middle East & Africa Stone Surface Plate Revenue (undefined) Forecast, by Application 2020 & 2033
- Table 74: Rest of Middle East & Africa Stone Surface Plate Volume (K) Forecast, by Application 2020 & 2033
- Table 75: Global Stone Surface Plate Revenue undefined Forecast, by Application 2020 & 2033
- Table 76: Global Stone Surface Plate Volume K Forecast, by Application 2020 & 2033
- Table 77: Global Stone Surface Plate Revenue undefined Forecast, by Types 2020 & 2033
- Table 78: Global Stone Surface Plate Volume K Forecast, by Types 2020 & 2033
- Table 79: Global Stone Surface Plate Revenue undefined Forecast, by Country 2020 & 2033
- Table 80: Global Stone Surface Plate Volume K Forecast, by Country 2020 & 2033
- Table 81: China Stone Surface Plate Revenue (undefined) Forecast, by Application 2020 & 2033
- Table 82: China Stone Surface Plate Volume (K) Forecast, by Application 2020 & 2033
- Table 83: India Stone Surface Plate Revenue (undefined) Forecast, by Application 2020 & 2033
- Table 84: India Stone Surface Plate Volume (K) Forecast, by Application 2020 & 2033
- Table 85: Japan Stone Surface Plate Revenue (undefined) Forecast, by Application 2020 & 2033
- Table 86: Japan Stone Surface Plate Volume (K) Forecast, by Application 2020 & 2033
- Table 87: South Korea Stone Surface Plate Revenue (undefined) Forecast, by Application 2020 & 2033
- Table 88: South Korea Stone Surface Plate Volume (K) Forecast, by Application 2020 & 2033
- Table 89: ASEAN Stone Surface Plate Revenue (undefined) Forecast, by Application 2020 & 2033
- Table 90: ASEAN Stone Surface Plate Volume (K) Forecast, by Application 2020 & 2033
- Table 91: Oceania Stone Surface Plate Revenue (undefined) Forecast, by Application 2020 & 2033
- Table 92: Oceania Stone Surface Plate Volume (K) Forecast, by Application 2020 & 2033
- Table 93: Rest of Asia Pacific Stone Surface Plate Revenue (undefined) Forecast, by Application 2020 & 2033
- Table 94: Rest of Asia Pacific Stone Surface Plate Volume (K) Forecast, by Application 2020 & 2033
Frequently Asked Questions
1. What is the projected Compound Annual Growth Rate (CAGR) of the Stone Surface Plate?
The projected CAGR is approximately 5%.
2. Which companies are prominent players in the Stone Surface Plate?
Key companies in the market include Grizzly Industrial(R), Inc., CNC Specialty Store LLC, Precision Granite, Judge Tool & Gage, Shars Tool, Productivity Quality Inc, TDC CO., LTD., CHUO PRECISION INDUSTRIAL.
3. What are the main segments of the Stone Surface Plate?
The market segments include Application, Types.
4. Can you provide details about the market size?
The market size is estimated to be USD XXX N/A as of 2022.
5. What are some drivers contributing to market growth?
N/A
6. What are the notable trends driving market growth?
N/A
7. Are there any restraints impacting market growth?
N/A
8. Can you provide examples of recent developments in the market?
N/A
9. What pricing options are available for accessing the report?
Pricing options include single-user, multi-user, and enterprise licenses priced at USD 3950.00, USD 5925.00, and USD 7900.00 respectively.
10. Is the market size provided in terms of value or volume?
The market size is provided in terms of value, measured in N/A and volume, measured in K.
11. Are there any specific market keywords associated with the report?
Yes, the market keyword associated with the report is "Stone Surface Plate," which aids in identifying and referencing the specific market segment covered.
12. How do I determine which pricing option suits my needs best?
The pricing options vary based on user requirements and access needs. Individual users may opt for single-user licenses, while businesses requiring broader access may choose multi-user or enterprise licenses for cost-effective access to the report.
13. Are there any additional resources or data provided in the Stone Surface Plate report?
While the report offers comprehensive insights, it's advisable to review the specific contents or supplementary materials provided to ascertain if additional resources or data are available.
14. How can I stay updated on further developments or reports in the Stone Surface Plate?
To stay informed about further developments, trends, and reports in the Stone Surface Plate, consider subscribing to industry newsletters, following relevant companies and organizations, or regularly checking reputable industry news sources and publications.
Methodology
Step 1 - Identification of Relevant Samples Size from Population Database


Step 2 - Approaches for Defining Global Market Size (Value, Volume* & Price*)

Note*: In applicable scenarios
Step 3 - Data Sources
Primary Research
- Web Analytics
- Survey Reports
- Research Institute
- Latest Research Reports
- Opinion Leaders
Secondary Research
- Annual Reports
- White Paper
- Latest Press Release
- Industry Association
- Paid Database
- Investor Presentations

Step 4 - Data Triangulation
Involves using different sources of information in order to increase the validity of a study
These sources are likely to be stakeholders in a program - participants, other researchers, program staff, other community members, and so on.
Then we put all data in single framework & apply various statistical tools to find out the dynamic on the market.
During the analysis stage, feedback from the stakeholder groups would be compared to determine areas of agreement as well as areas of divergence
