
Key Insights
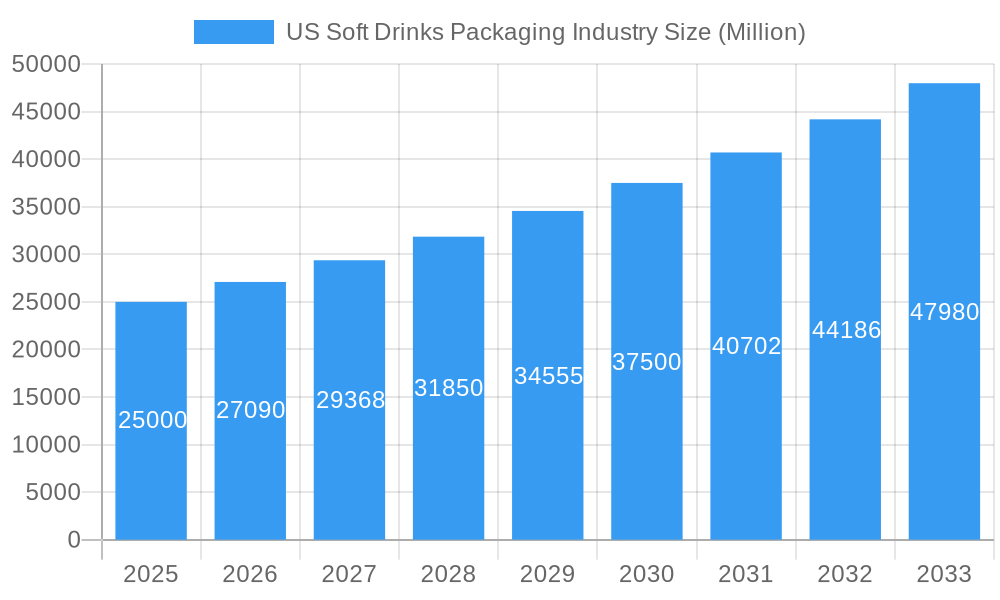
The US soft drinks packaging market, valued at approximately $26.86 billion in 2025, is projected for significant expansion. This market is forecast to grow at a compound annual growth rate (CAGR) of 4.4% from 2025 to 2033. Key growth drivers include the escalating demand for convenient, on-the-go beverage consumption, which necessitates efficient and appealing packaging. Shifting consumer preferences towards healthier options, such as juices and sports drinks, are influencing packaging material choices, with a notable increase in demand for sustainable and eco-friendly materials like paper and paperboard. Technological advancements in packaging, including lightweighting and enhanced barrier properties, contribute to cost efficiencies and extended product shelf life, further stimulating market growth. Major industry players, including WestRock, Ball Corporation, and Amcor, are investing heavily in production capacity expansion and the development of innovative packaging solutions, which will continue to define market trends. Regional distribution is anticipated to concentrate in densely populated areas such as the Northeast and West Coast, with strong growth potential in the Southwest owing to population expansion and tourism. However, market expansion faces challenges from fluctuating raw material costs and growing environmental concerns, driving the adoption of sustainable packaging practices.

US Soft Drinks Packaging Industry Market Size (In Billion)
Within the US soft drinks packaging market, plastics remain the primary material. However, the share of paper and paperboard packaging is expected to rise, driven by increasing sustainability initiatives. Bottled water and carbonated beverages continue to represent the largest product segments. The growth of ready-to-drink (RTD) beverages and sports drinks is also fostering market diversification. Intense competition among key players centers on technological innovation, strategic alliances, and geographic expansion. The market's future trajectory will be significantly shaped by the efficacy of sustainability efforts, evolving consumer preferences, and changing regulatory frameworks concerning packaging materials. Companies are prioritizing the development of recyclable and biodegradable packaging solutions to address rising environmental concerns, thereby creating substantial opportunities for innovative products and continued market growth.
US Soft Drinks Packaging Industry Company Market Share
US Soft Drinks Packaging Industry: A Comprehensive Market Report (2019-2033)
This comprehensive report provides an in-depth analysis of the US soft drinks packaging industry, covering market dynamics, key segments, leading players, and future growth opportunities. The study period spans from 2019 to 2033, with 2025 serving as the base and estimated year. This report is essential for industry stakeholders, investors, and strategic decision-makers seeking to navigate this dynamic market. The report analyzes a market valued at $XX Million in 2025, projecting a Compound Annual Growth Rate (CAGR) of XX% from 2025 to 2033.
US Soft Drinks Packaging Industry Market Concentration & Dynamics
The US soft drinks packaging market is characterized by a moderately concentrated landscape, with a few major players holding significant market share. WestRock Company, Ball Corporation, and Crown Holdings Inc. are among the dominant players, collectively accounting for an estimated xx% of the market in 2025. The industry’s innovation ecosystem is driven by advancements in sustainable packaging materials, lightweighting technologies, and improved barrier properties. Stringent regulatory frameworks, particularly concerning recyclability and plastic reduction, significantly influence industry practices. Substitute products, such as reusable containers and alternative beverage delivery systems, pose a growing challenge. End-user trends toward convenience, portability, and sustainability are reshaping packaging preferences. Mergers and acquisitions (M&A) activity has been relatively robust in recent years, with xx major deals recorded between 2019 and 2024, primarily driven by consolidation efforts and expansion into new markets.
- Market Share (2025): WestRock Company (xx%), Ball Corporation (xx%), Crown Holdings Inc. (xx%), Others (xx%)
- M&A Deal Count (2019-2024): xx
- Key Regulatory Drivers: Plastic reduction initiatives, recyclability standards.
- Emerging Substitute Products: Reusable containers, concentrate delivery systems.
US Soft Drinks Packaging Industry Industry Insights & Trends
The US soft drinks packaging market experienced significant growth during the historical period (2019-2024), driven primarily by increasing soft drink consumption, particularly in bottled water and ready-to-drink (RTD) beverages. The market size reached $XX Million in 2024. Technological disruptions, such as the rise of lightweighting technologies and advancements in barrier materials, are enhancing packaging efficiency and sustainability. Evolving consumer behaviors, including a preference for on-the-go consumption and a growing awareness of environmental concerns, are driving demand for innovative and eco-friendly packaging solutions. Furthermore, the increasing adoption of e-commerce has fueled demand for packaging solutions optimized for online delivery. The forecast period (2025-2033) is expected to witness continued market expansion, driven by sustained consumer demand and technological advancements. Specific growth drivers include the rising popularity of functional beverages and the growing adoption of flexible packaging. The market is projected to reach $XX Million by 2033.
Key Markets & Segments Leading US Soft Drinks Packaging Industry
The largest segment within the US soft drinks packaging market is plastic packaging, driven by its cost-effectiveness, versatility, and suitability for various beverage types. The bottled water segment exhibits the highest growth potential, reflecting the ongoing popularity of this beverage category. The key regional market is the western US region (xx%), showcasing higher per capita consumption of soft drinks.
By Packaging Material Type:
- Plastic: Dominated by its cost-effectiveness and versatility. Drivers include high soft drink consumption and readily available manufacturing capabilities.
- Paper & Paperboard: Growing segment driven by sustainability concerns and increasing demand for recyclable options. Drivers include rising environmental awareness and advancements in barrier coatings.
- Glass: Niche segment focused on premium beverages. Drivers include perceived higher quality and brand image associated with glass bottles.
- Metal: Strong presence in carbonated drinks due to its durability and ability to maintain carbonation. Drivers include its suitability for high-pressure carbonation.
- Other Materials: Includes materials like biodegradable plastics and composite materials. Drivers include technological advancements and increasing sustainability concerns.
By Product Type:
- Bottled Water: Highest growth segment due to health and wellness trends and increasing demand for hydration. Drivers include increasing health consciousness and convenience factor.
- Carbonated Drinks: Established segment, although facing some pressure due to health concerns. Drivers include established market share and continued demand for carbonated beverages.
- Juices: Significant market segment with opportunities in premium and functional juices. Drivers include health-conscious consumers seeking natural and functional beverages.
- RTD Beverages: Fast-growing segment owing to convenience and variety. Drivers include lifestyle factors and increasing demand for ready-to-consume beverages.
- Sports Drinks: Niche segment driven by fitness and athletic activities. Drivers include rising interest in fitness and sports participation.
- Other Products: Includes energy drinks, iced tea and other niche beverages.
US Soft Drinks Packaging Industry Product Developments
Recent product innovations focus on enhanced sustainability through lightweighting, improved recyclability, and the use of recycled content. The development of barrier films with enhanced oxygen and moisture resistance is vital. Competition is driven by offering superior barrier properties, increased speed and efficiency in production, and improved recyclability options, showcasing technological prowess and minimizing environmental footprint. Amcor's launch of the AmPrima line in June 2021 exemplifies these advancements, significantly enhancing production speed and delivering a recycle-ready solution.
Challenges in the US Soft Drinks Packaging Industry Market
The industry faces challenges related to fluctuating raw material costs (estimated impact: xx% increase in production cost in 2024), stringent regulations impacting packaging design and materials, and intense competition from both established players and emerging packaging solutions. Supply chain disruptions impacting the availability and cost of raw materials have also posed significant issues, especially in recent years. These issues collectively constrain profitability and innovation within the market.
Forces Driving US Soft Drinks Packaging Industry Growth
Key growth drivers include rising soft drink consumption, particularly in convenience formats, the growing demand for sustainable packaging options, and advancements in packaging technologies enhancing product shelf life and reducing environmental impact. Favorable economic conditions also contribute to increased consumer spending on beverages and packaging materials. Government initiatives promoting sustainability in the packaging industry are further encouraging innovation and investment in eco-friendly solutions.
Long-Term Growth Catalysts in the US Soft Drinks Packaging Industry
Long-term growth hinges on continued technological innovation in sustainable materials, like biodegradable plastics and plant-based alternatives. Strategic partnerships between packaging manufacturers and beverage companies will play a vital role in driving the adoption of novel and efficient solutions. Expansion into emerging markets and developing new packaging formats designed for optimized e-commerce delivery systems will contribute significantly to long-term growth.
Emerging Opportunities in US Soft Drinks Packaging Industry
Emerging opportunities lie in the growing demand for personalized and customizable packaging, the increasing adoption of smart packaging incorporating technology for enhanced product traceability and consumer engagement, and exploring new markets like functional beverages and plant-based drinks. Furthermore, expanding into the growing reusable packaging and refillable container market offers significant potential.
Leading Players in the US Soft Drinks Packaging Industry Sector
- WestRock Company
- Ball Corporation
- CAN-PACK S A
- Ardagh Group SA
- Crown Holdings Inc
- Graham Packaging Company
- Tetra Pak International
- Toyo Seikan Group Holdings Ltd
- Placon Corporation
- Sealed Air Corporation
- Owens-Illinois Inc
- Refresco Group NV
- Amcor Ltd
Key Milestones in US Soft Drinks Packaging Industry Industry
- June 2021: Amcor launched the AmPrima line of ultra-clear and heat-resistant films, significantly advancing production speeds and offering a recycle-ready solution. This milestone highlights a shift towards sustainable and high-performance packaging solutions, impacting market competition and consumer preferences.
Strategic Outlook for US Soft Drinks Packaging Industry Market
The US soft drinks packaging market is poised for continued growth, driven by a combination of factors including technological innovation, increasing consumer demand for sustainable packaging, and favorable economic conditions. Strategic opportunities exist for companies to invest in research and development of eco-friendly packaging materials, explore new packaging formats, and enhance supply chain efficiencies. Companies that can effectively address consumer demand for convenience and sustainability while optimizing their operations will be well-positioned to succeed in this dynamic market.
US Soft Drinks Packaging Industry Segmentation
-
1. Packaging Material Type
- 1.1. Plastic
- 1.2. Paper & Paperboard
- 1.3. Glass
- 1.4. Metal
- 1.5. Other Materials
-
2. Product Type
- 2.1. Bottled Water
- 2.2. Carbonated Drinks
- 2.3. Juices
- 2.4. RTD Beverages
- 2.5. Sports Drink
- 2.6. Other Products
US Soft Drinks Packaging Industry Segmentation By Geography
-
1. North America
- 1.1. United States
- 1.2. Canada
- 1.3. Mexico
-
2. South America
- 2.1. Brazil
- 2.2. Argentina
- 2.3. Rest of South America
-
3. Europe
- 3.1. United Kingdom
- 3.2. Germany
- 3.3. France
- 3.4. Italy
- 3.5. Spain
- 3.6. Russia
- 3.7. Benelux
- 3.8. Nordics
- 3.9. Rest of Europe
-
4. Middle East & Africa
- 4.1. Turkey
- 4.2. Israel
- 4.3. GCC
- 4.4. North Africa
- 4.5. South Africa
- 4.6. Rest of Middle East & Africa
-
5. Asia Pacific
- 5.1. China
- 5.2. India
- 5.3. Japan
- 5.4. South Korea
- 5.5. ASEAN
- 5.6. Oceania
- 5.7. Rest of Asia Pacific

US Soft Drinks Packaging Industry Regional Market Share
Geographic Coverage of US Soft Drinks Packaging Industry
US Soft Drinks Packaging Industry REPORT HIGHLIGHTS
| Aspects | Details |
|---|---|
| Study Period | 2020-2034 |
| Base Year | 2025 |
| Estimated Year | 2026 |
| Forecast Period | 2026-2034 |
| Historical Period | 2020-2025 |
| Growth Rate | CAGR of 4.4% from 2020-2034 |
| Segmentation |
|
Table of Contents
- 1. Introduction
- 1.1. Research Scope
- 1.2. Market Segmentation
- 1.3. Research Methodology
- 1.4. Definitions and Assumptions
- 2. Executive Summary
- 2.1. Introduction
- 3. Market Dynamics
- 3.1. Introduction
- 3.2. Market Drivers
- 3.2.1. Growing Demand for Ready-to-use Drinks; Increased demand for convenience packaging from consumers
- 3.3. Market Restrains
- 3.3.1. Environmental concerns regarding usage of plastic; Stringent Government Regulations
- 3.4. Market Trends
- 3.4.1. Plastic is Expected to Hold Significant Market Share
- 4. Market Factor Analysis
- 4.1. Porters Five Forces
- 4.2. Supply/Value Chain
- 4.3. PESTEL analysis
- 4.4. Market Entropy
- 4.5. Patent/Trademark Analysis
- 5. Global US Soft Drinks Packaging Industry Analysis, Insights and Forecast, 2020-2032
- 5.1. Market Analysis, Insights and Forecast - by Packaging Material Type
- 5.1.1. Plastic
- 5.1.2. Paper & Paperboard
- 5.1.3. Glass
- 5.1.4. Metal
- 5.1.5. Other Materials
- 5.2. Market Analysis, Insights and Forecast - by Product Type
- 5.2.1. Bottled Water
- 5.2.2. Carbonated Drinks
- 5.2.3. Juices
- 5.2.4. RTD Beverages
- 5.2.5. Sports Drink
- 5.2.6. Other Products
- 5.3. Market Analysis, Insights and Forecast - by Region
- 5.3.1. North America
- 5.3.2. South America
- 5.3.3. Europe
- 5.3.4. Middle East & Africa
- 5.3.5. Asia Pacific
- 5.1. Market Analysis, Insights and Forecast - by Packaging Material Type
- 6. North America US Soft Drinks Packaging Industry Analysis, Insights and Forecast, 2020-2032
- 6.1. Market Analysis, Insights and Forecast - by Packaging Material Type
- 6.1.1. Plastic
- 6.1.2. Paper & Paperboard
- 6.1.3. Glass
- 6.1.4. Metal
- 6.1.5. Other Materials
- 6.2. Market Analysis, Insights and Forecast - by Product Type
- 6.2.1. Bottled Water
- 6.2.2. Carbonated Drinks
- 6.2.3. Juices
- 6.2.4. RTD Beverages
- 6.2.5. Sports Drink
- 6.2.6. Other Products
- 6.1. Market Analysis, Insights and Forecast - by Packaging Material Type
- 7. South America US Soft Drinks Packaging Industry Analysis, Insights and Forecast, 2020-2032
- 7.1. Market Analysis, Insights and Forecast - by Packaging Material Type
- 7.1.1. Plastic
- 7.1.2. Paper & Paperboard
- 7.1.3. Glass
- 7.1.4. Metal
- 7.1.5. Other Materials
- 7.2. Market Analysis, Insights and Forecast - by Product Type
- 7.2.1. Bottled Water
- 7.2.2. Carbonated Drinks
- 7.2.3. Juices
- 7.2.4. RTD Beverages
- 7.2.5. Sports Drink
- 7.2.6. Other Products
- 7.1. Market Analysis, Insights and Forecast - by Packaging Material Type
- 8. Europe US Soft Drinks Packaging Industry Analysis, Insights and Forecast, 2020-2032
- 8.1. Market Analysis, Insights and Forecast - by Packaging Material Type
- 8.1.1. Plastic
- 8.1.2. Paper & Paperboard
- 8.1.3. Glass
- 8.1.4. Metal
- 8.1.5. Other Materials
- 8.2. Market Analysis, Insights and Forecast - by Product Type
- 8.2.1. Bottled Water
- 8.2.2. Carbonated Drinks
- 8.2.3. Juices
- 8.2.4. RTD Beverages
- 8.2.5. Sports Drink
- 8.2.6. Other Products
- 8.1. Market Analysis, Insights and Forecast - by Packaging Material Type
- 9. Middle East & Africa US Soft Drinks Packaging Industry Analysis, Insights and Forecast, 2020-2032
- 9.1. Market Analysis, Insights and Forecast - by Packaging Material Type
- 9.1.1. Plastic
- 9.1.2. Paper & Paperboard
- 9.1.3. Glass
- 9.1.4. Metal
- 9.1.5. Other Materials
- 9.2. Market Analysis, Insights and Forecast - by Product Type
- 9.2.1. Bottled Water
- 9.2.2. Carbonated Drinks
- 9.2.3. Juices
- 9.2.4. RTD Beverages
- 9.2.5. Sports Drink
- 9.2.6. Other Products
- 9.1. Market Analysis, Insights and Forecast - by Packaging Material Type
- 10. Asia Pacific US Soft Drinks Packaging Industry Analysis, Insights and Forecast, 2020-2032
- 10.1. Market Analysis, Insights and Forecast - by Packaging Material Type
- 10.1.1. Plastic
- 10.1.2. Paper & Paperboard
- 10.1.3. Glass
- 10.1.4. Metal
- 10.1.5. Other Materials
- 10.2. Market Analysis, Insights and Forecast - by Product Type
- 10.2.1. Bottled Water
- 10.2.2. Carbonated Drinks
- 10.2.3. Juices
- 10.2.4. RTD Beverages
- 10.2.5. Sports Drink
- 10.2.6. Other Products
- 10.1. Market Analysis, Insights and Forecast - by Packaging Material Type
- 11. Northeast US Soft Drinks Packaging Industry Analysis, Insights and Forecast, 2020-2032
- 12. Southeast US Soft Drinks Packaging Industry Analysis, Insights and Forecast, 2020-2032
- 13. Midwest US Soft Drinks Packaging Industry Analysis, Insights and Forecast, 2020-2032
- 14. Southwest US Soft Drinks Packaging Industry Analysis, Insights and Forecast, 2020-2032
- 15. West US Soft Drinks Packaging Industry Analysis, Insights and Forecast, 2020-2032
- 16. Competitive Analysis
- 16.1. Global Market Share Analysis 2025
- 16.2. Company Profiles
- 16.2.1 WestRock Company
- 16.2.1.1. Overview
- 16.2.1.2. Products
- 16.2.1.3. SWOT Analysis
- 16.2.1.4. Recent Developments
- 16.2.1.5. Financials (Based on Availability)
- 16.2.2 Ball Corporation
- 16.2.2.1. Overview
- 16.2.2.2. Products
- 16.2.2.3. SWOT Analysis
- 16.2.2.4. Recent Developments
- 16.2.2.5. Financials (Based on Availability)
- 16.2.3 CAN-PACK S A
- 16.2.3.1. Overview
- 16.2.3.2. Products
- 16.2.3.3. SWOT Analysis
- 16.2.3.4. Recent Developments
- 16.2.3.5. Financials (Based on Availability)
- 16.2.4 Ardagh Group SA
- 16.2.4.1. Overview
- 16.2.4.2. Products
- 16.2.4.3. SWOT Analysis
- 16.2.4.4. Recent Developments
- 16.2.4.5. Financials (Based on Availability)
- 16.2.5 Crown Holdings Inc
- 16.2.5.1. Overview
- 16.2.5.2. Products
- 16.2.5.3. SWOT Analysis
- 16.2.5.4. Recent Developments
- 16.2.5.5. Financials (Based on Availability)
- 16.2.6 Graham Packaging Company
- 16.2.6.1. Overview
- 16.2.6.2. Products
- 16.2.6.3. SWOT Analysis
- 16.2.6.4. Recent Developments
- 16.2.6.5. Financials (Based on Availability)
- 16.2.7 Tetra Pak International
- 16.2.7.1. Overview
- 16.2.7.2. Products
- 16.2.7.3. SWOT Analysis
- 16.2.7.4. Recent Developments
- 16.2.7.5. Financials (Based on Availability)
- 16.2.8 Toyo Seikan Group Holdings Ltd
- 16.2.8.1. Overview
- 16.2.8.2. Products
- 16.2.8.3. SWOT Analysis
- 16.2.8.4. Recent Developments
- 16.2.8.5. Financials (Based on Availability)
- 16.2.9 Placon Corporation
- 16.2.9.1. Overview
- 16.2.9.2. Products
- 16.2.9.3. SWOT Analysis
- 16.2.9.4. Recent Developments
- 16.2.9.5. Financials (Based on Availability)
- 16.2.10 Sealed Air Corporation
- 16.2.10.1. Overview
- 16.2.10.2. Products
- 16.2.10.3. SWOT Analysis
- 16.2.10.4. Recent Developments
- 16.2.10.5. Financials (Based on Availability)
- 16.2.11 Owens-Illinois Inc
- 16.2.11.1. Overview
- 16.2.11.2. Products
- 16.2.11.3. SWOT Analysis
- 16.2.11.4. Recent Developments
- 16.2.11.5. Financials (Based on Availability)
- 16.2.12 Refresco Group NV
- 16.2.12.1. Overview
- 16.2.12.2. Products
- 16.2.12.3. SWOT Analysis
- 16.2.12.4. Recent Developments
- 16.2.12.5. Financials (Based on Availability)
- 16.2.13 Amcor Ltd
- 16.2.13.1. Overview
- 16.2.13.2. Products
- 16.2.13.3. SWOT Analysis
- 16.2.13.4. Recent Developments
- 16.2.13.5. Financials (Based on Availability)
- 16.2.1 WestRock Company
List of Figures
- Figure 1: Global US Soft Drinks Packaging Industry Revenue Breakdown (billion, %) by Region 2025 & 2033
- Figure 2: United states US Soft Drinks Packaging Industry Revenue (billion), by Country 2025 & 2033
- Figure 3: United states US Soft Drinks Packaging Industry Revenue Share (%), by Country 2025 & 2033
- Figure 4: North America US Soft Drinks Packaging Industry Revenue (billion), by Packaging Material Type 2025 & 2033
- Figure 5: North America US Soft Drinks Packaging Industry Revenue Share (%), by Packaging Material Type 2025 & 2033
- Figure 6: North America US Soft Drinks Packaging Industry Revenue (billion), by Product Type 2025 & 2033
- Figure 7: North America US Soft Drinks Packaging Industry Revenue Share (%), by Product Type 2025 & 2033
- Figure 8: North America US Soft Drinks Packaging Industry Revenue (billion), by Country 2025 & 2033
- Figure 9: North America US Soft Drinks Packaging Industry Revenue Share (%), by Country 2025 & 2033
- Figure 10: South America US Soft Drinks Packaging Industry Revenue (billion), by Packaging Material Type 2025 & 2033
- Figure 11: South America US Soft Drinks Packaging Industry Revenue Share (%), by Packaging Material Type 2025 & 2033
- Figure 12: South America US Soft Drinks Packaging Industry Revenue (billion), by Product Type 2025 & 2033
- Figure 13: South America US Soft Drinks Packaging Industry Revenue Share (%), by Product Type 2025 & 2033
- Figure 14: South America US Soft Drinks Packaging Industry Revenue (billion), by Country 2025 & 2033
- Figure 15: South America US Soft Drinks Packaging Industry Revenue Share (%), by Country 2025 & 2033
- Figure 16: Europe US Soft Drinks Packaging Industry Revenue (billion), by Packaging Material Type 2025 & 2033
- Figure 17: Europe US Soft Drinks Packaging Industry Revenue Share (%), by Packaging Material Type 2025 & 2033
- Figure 18: Europe US Soft Drinks Packaging Industry Revenue (billion), by Product Type 2025 & 2033
- Figure 19: Europe US Soft Drinks Packaging Industry Revenue Share (%), by Product Type 2025 & 2033
- Figure 20: Europe US Soft Drinks Packaging Industry Revenue (billion), by Country 2025 & 2033
- Figure 21: Europe US Soft Drinks Packaging Industry Revenue Share (%), by Country 2025 & 2033
- Figure 22: Middle East & Africa US Soft Drinks Packaging Industry Revenue (billion), by Packaging Material Type 2025 & 2033
- Figure 23: Middle East & Africa US Soft Drinks Packaging Industry Revenue Share (%), by Packaging Material Type 2025 & 2033
- Figure 24: Middle East & Africa US Soft Drinks Packaging Industry Revenue (billion), by Product Type 2025 & 2033
- Figure 25: Middle East & Africa US Soft Drinks Packaging Industry Revenue Share (%), by Product Type 2025 & 2033
- Figure 26: Middle East & Africa US Soft Drinks Packaging Industry Revenue (billion), by Country 2025 & 2033
- Figure 27: Middle East & Africa US Soft Drinks Packaging Industry Revenue Share (%), by Country 2025 & 2033
- Figure 28: Asia Pacific US Soft Drinks Packaging Industry Revenue (billion), by Packaging Material Type 2025 & 2033
- Figure 29: Asia Pacific US Soft Drinks Packaging Industry Revenue Share (%), by Packaging Material Type 2025 & 2033
- Figure 30: Asia Pacific US Soft Drinks Packaging Industry Revenue (billion), by Product Type 2025 & 2033
- Figure 31: Asia Pacific US Soft Drinks Packaging Industry Revenue Share (%), by Product Type 2025 & 2033
- Figure 32: Asia Pacific US Soft Drinks Packaging Industry Revenue (billion), by Country 2025 & 2033
- Figure 33: Asia Pacific US Soft Drinks Packaging Industry Revenue Share (%), by Country 2025 & 2033
List of Tables
- Table 1: Global US Soft Drinks Packaging Industry Revenue billion Forecast, by Region 2020 & 2033
- Table 2: Global US Soft Drinks Packaging Industry Revenue billion Forecast, by Packaging Material Type 2020 & 2033
- Table 3: Global US Soft Drinks Packaging Industry Revenue billion Forecast, by Product Type 2020 & 2033
- Table 4: Global US Soft Drinks Packaging Industry Revenue billion Forecast, by Region 2020 & 2033
- Table 5: Global US Soft Drinks Packaging Industry Revenue billion Forecast, by Country 2020 & 2033
- Table 6: Northeast US Soft Drinks Packaging Industry Revenue (billion) Forecast, by Application 2020 & 2033
- Table 7: Southeast US Soft Drinks Packaging Industry Revenue (billion) Forecast, by Application 2020 & 2033
- Table 8: Midwest US Soft Drinks Packaging Industry Revenue (billion) Forecast, by Application 2020 & 2033
- Table 9: Southwest US Soft Drinks Packaging Industry Revenue (billion) Forecast, by Application 2020 & 2033
- Table 10: West US Soft Drinks Packaging Industry Revenue (billion) Forecast, by Application 2020 & 2033
- Table 11: Global US Soft Drinks Packaging Industry Revenue billion Forecast, by Packaging Material Type 2020 & 2033
- Table 12: Global US Soft Drinks Packaging Industry Revenue billion Forecast, by Product Type 2020 & 2033
- Table 13: Global US Soft Drinks Packaging Industry Revenue billion Forecast, by Country 2020 & 2033
- Table 14: United States US Soft Drinks Packaging Industry Revenue (billion) Forecast, by Application 2020 & 2033
- Table 15: Canada US Soft Drinks Packaging Industry Revenue (billion) Forecast, by Application 2020 & 2033
- Table 16: Mexico US Soft Drinks Packaging Industry Revenue (billion) Forecast, by Application 2020 & 2033
- Table 17: Global US Soft Drinks Packaging Industry Revenue billion Forecast, by Packaging Material Type 2020 & 2033
- Table 18: Global US Soft Drinks Packaging Industry Revenue billion Forecast, by Product Type 2020 & 2033
- Table 19: Global US Soft Drinks Packaging Industry Revenue billion Forecast, by Country 2020 & 2033
- Table 20: Brazil US Soft Drinks Packaging Industry Revenue (billion) Forecast, by Application 2020 & 2033
- Table 21: Argentina US Soft Drinks Packaging Industry Revenue (billion) Forecast, by Application 2020 & 2033
- Table 22: Rest of South America US Soft Drinks Packaging Industry Revenue (billion) Forecast, by Application 2020 & 2033
- Table 23: Global US Soft Drinks Packaging Industry Revenue billion Forecast, by Packaging Material Type 2020 & 2033
- Table 24: Global US Soft Drinks Packaging Industry Revenue billion Forecast, by Product Type 2020 & 2033
- Table 25: Global US Soft Drinks Packaging Industry Revenue billion Forecast, by Country 2020 & 2033
- Table 26: United Kingdom US Soft Drinks Packaging Industry Revenue (billion) Forecast, by Application 2020 & 2033
- Table 27: Germany US Soft Drinks Packaging Industry Revenue (billion) Forecast, by Application 2020 & 2033
- Table 28: France US Soft Drinks Packaging Industry Revenue (billion) Forecast, by Application 2020 & 2033
- Table 29: Italy US Soft Drinks Packaging Industry Revenue (billion) Forecast, by Application 2020 & 2033
- Table 30: Spain US Soft Drinks Packaging Industry Revenue (billion) Forecast, by Application 2020 & 2033
- Table 31: Russia US Soft Drinks Packaging Industry Revenue (billion) Forecast, by Application 2020 & 2033
- Table 32: Benelux US Soft Drinks Packaging Industry Revenue (billion) Forecast, by Application 2020 & 2033
- Table 33: Nordics US Soft Drinks Packaging Industry Revenue (billion) Forecast, by Application 2020 & 2033
- Table 34: Rest of Europe US Soft Drinks Packaging Industry Revenue (billion) Forecast, by Application 2020 & 2033
- Table 35: Global US Soft Drinks Packaging Industry Revenue billion Forecast, by Packaging Material Type 2020 & 2033
- Table 36: Global US Soft Drinks Packaging Industry Revenue billion Forecast, by Product Type 2020 & 2033
- Table 37: Global US Soft Drinks Packaging Industry Revenue billion Forecast, by Country 2020 & 2033
- Table 38: Turkey US Soft Drinks Packaging Industry Revenue (billion) Forecast, by Application 2020 & 2033
- Table 39: Israel US Soft Drinks Packaging Industry Revenue (billion) Forecast, by Application 2020 & 2033
- Table 40: GCC US Soft Drinks Packaging Industry Revenue (billion) Forecast, by Application 2020 & 2033
- Table 41: North Africa US Soft Drinks Packaging Industry Revenue (billion) Forecast, by Application 2020 & 2033
- Table 42: South Africa US Soft Drinks Packaging Industry Revenue (billion) Forecast, by Application 2020 & 2033
- Table 43: Rest of Middle East & Africa US Soft Drinks Packaging Industry Revenue (billion) Forecast, by Application 2020 & 2033
- Table 44: Global US Soft Drinks Packaging Industry Revenue billion Forecast, by Packaging Material Type 2020 & 2033
- Table 45: Global US Soft Drinks Packaging Industry Revenue billion Forecast, by Product Type 2020 & 2033
- Table 46: Global US Soft Drinks Packaging Industry Revenue billion Forecast, by Country 2020 & 2033
- Table 47: China US Soft Drinks Packaging Industry Revenue (billion) Forecast, by Application 2020 & 2033
- Table 48: India US Soft Drinks Packaging Industry Revenue (billion) Forecast, by Application 2020 & 2033
- Table 49: Japan US Soft Drinks Packaging Industry Revenue (billion) Forecast, by Application 2020 & 2033
- Table 50: South Korea US Soft Drinks Packaging Industry Revenue (billion) Forecast, by Application 2020 & 2033
- Table 51: ASEAN US Soft Drinks Packaging Industry Revenue (billion) Forecast, by Application 2020 & 2033
- Table 52: Oceania US Soft Drinks Packaging Industry Revenue (billion) Forecast, by Application 2020 & 2033
- Table 53: Rest of Asia Pacific US Soft Drinks Packaging Industry Revenue (billion) Forecast, by Application 2020 & 2033
Frequently Asked Questions
1. What is the projected Compound Annual Growth Rate (CAGR) of the US Soft Drinks Packaging Industry?
The projected CAGR is approximately 4.4%.
2. Which companies are prominent players in the US Soft Drinks Packaging Industry?
Key companies in the market include WestRock Company, Ball Corporation, CAN-PACK S A, Ardagh Group SA, Crown Holdings Inc, Graham Packaging Company, Tetra Pak International, Toyo Seikan Group Holdings Ltd, Placon Corporation, Sealed Air Corporation, Owens-Illinois Inc, Refresco Group NV, Amcor Ltd.
3. What are the main segments of the US Soft Drinks Packaging Industry?
The market segments include Packaging Material Type, Product Type.
4. Can you provide details about the market size?
The market size is estimated to be USD 26.86 billion as of 2022.
5. What are some drivers contributing to market growth?
Growing Demand for Ready-to-use Drinks; Increased demand for convenience packaging from consumers.
6. What are the notable trends driving market growth?
Plastic is Expected to Hold Significant Market Share.
7. Are there any restraints impacting market growth?
Environmental concerns regarding usage of plastic; Stringent Government Regulations.
8. Can you provide examples of recent developments in the market?
June 2021 - Amcor launched new machines to produce ultra-clear and heat resistance films. The AmPrima line uses machine-direction orientation technology to produce films that can run at speeds that competitors cannot match in a recycle-ready solution for packaging purposes.
9. What pricing options are available for accessing the report?
Pricing options include single-user, multi-user, and enterprise licenses priced at USD 3800, USD 4500, and USD 5800 respectively.
10. Is the market size provided in terms of value or volume?
The market size is provided in terms of value, measured in billion.
11. Are there any specific market keywords associated with the report?
Yes, the market keyword associated with the report is "US Soft Drinks Packaging Industry," which aids in identifying and referencing the specific market segment covered.
12. How do I determine which pricing option suits my needs best?
The pricing options vary based on user requirements and access needs. Individual users may opt for single-user licenses, while businesses requiring broader access may choose multi-user or enterprise licenses for cost-effective access to the report.
13. Are there any additional resources or data provided in the US Soft Drinks Packaging Industry report?
While the report offers comprehensive insights, it's advisable to review the specific contents or supplementary materials provided to ascertain if additional resources or data are available.
14. How can I stay updated on further developments or reports in the US Soft Drinks Packaging Industry?
To stay informed about further developments, trends, and reports in the US Soft Drinks Packaging Industry, consider subscribing to industry newsletters, following relevant companies and organizations, or regularly checking reputable industry news sources and publications.
Methodology
Step 1 - Identification of Relevant Samples Size from Population Database


Step 2 - Approaches for Defining Global Market Size (Value, Volume* & Price*)

Note*: In applicable scenarios
Step 3 - Data Sources
Primary Research
- Web Analytics
- Survey Reports
- Research Institute
- Latest Research Reports
- Opinion Leaders
Secondary Research
- Annual Reports
- White Paper
- Latest Press Release
- Industry Association
- Paid Database
- Investor Presentations

Step 4 - Data Triangulation
Involves using different sources of information in order to increase the validity of a study
These sources are likely to be stakeholders in a program - participants, other researchers, program staff, other community members, and so on.
Then we put all data in single framework & apply various statistical tools to find out the dynamic on the market.
During the analysis stage, feedback from the stakeholder groups would be compared to determine areas of agreement as well as areas of divergence
