
Key Insights
The global wind power equipment market is experiencing robust growth, driven by the increasing demand for renewable energy sources and supportive government policies aimed at reducing carbon emissions. A compound annual growth rate (CAGR) of 9.12% from 2019 to 2024 suggests a significant expansion, projected to continue through 2033. This growth is fueled by several key factors, including the declining cost of wind energy technology, advancements in turbine design leading to higher efficiency and capacity, and the expanding geographical reach of wind farms, both onshore and offshore. The market segmentation reveals significant opportunities across various equipment types, with rotor/blade components, towers, and generators representing major market segments. Leading companies such as Vestas, Siemens Gamesa, and Goldwind are actively shaping the market landscape through innovation and strategic investments in research and development, as well as expanding their global presence. The regional breakdown indicates strong market penetration in North America, Europe, and Asia-Pacific, with developing economies in Asia and emerging markets in South America and the Middle East and Africa presenting significant growth potential. Offshore wind energy, in particular, is a rapidly evolving sector poised for substantial expansion in the coming years.
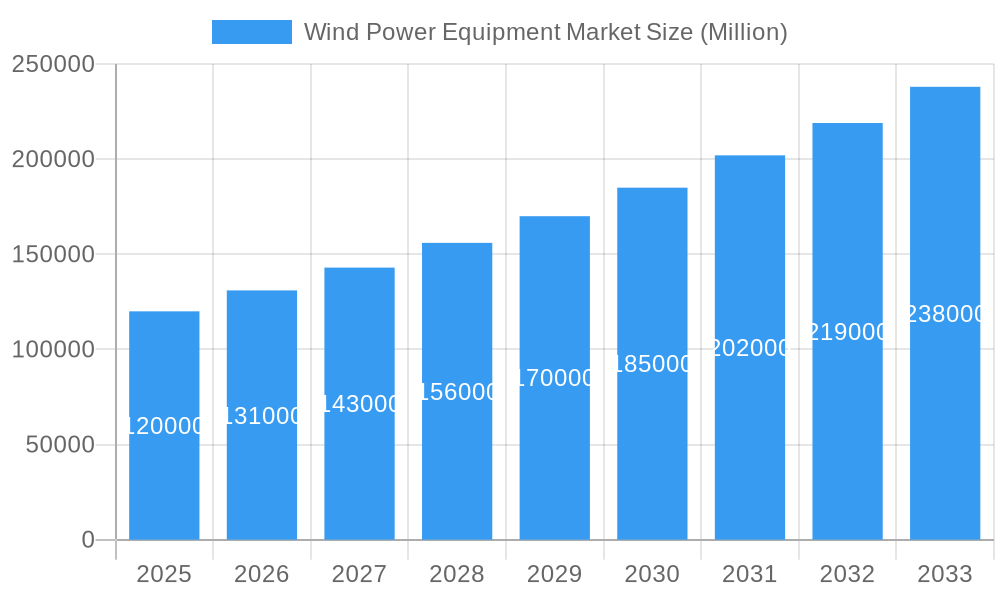
Wind Power Equipment Market Market Size (In Billion)
The competitive landscape is characterized by both established multinational corporations and regional players. While established players benefit from economies of scale and extensive experience, smaller, more agile companies are driving innovation in specific niche areas, such as advanced blade design and smart grid integration. However, challenges remain, including the intermittency of wind power, the need for efficient grid infrastructure to accommodate fluctuating energy supply, and potential environmental concerns associated with the construction and operation of wind farms. Addressing these concerns and further technological advancements will be critical in ensuring the sustained growth and wider adoption of wind power equipment in the years to come. The market's continued expansion relies on overcoming logistical hurdles, streamlining regulatory processes, and further reducing the overall cost of energy production.
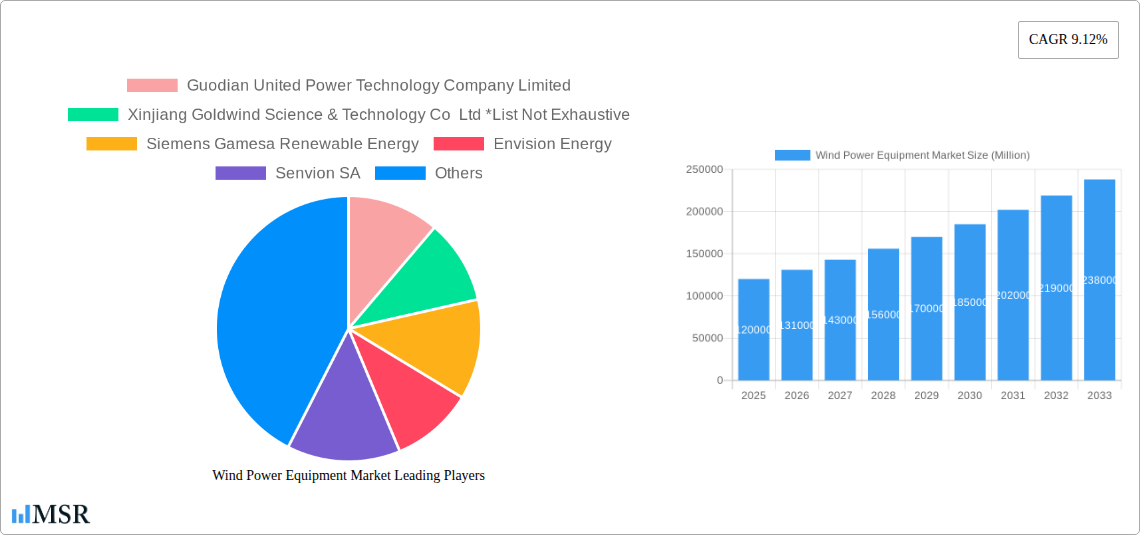
Wind Power Equipment Market Company Market Share
Wind Power Equipment Market: A Comprehensive Report (2019-2033)
This in-depth report provides a comprehensive analysis of the global Wind Power Equipment Market, offering invaluable insights for stakeholders across the renewable energy sector. Covering the period 2019-2033, with a focus on 2025, this report dissects market dynamics, key players, emerging trends, and future growth projections. The study incorporates detailed segmentation by location (onshore, offshore), equipment type (rotor/blade, tower, generator, other), and includes an analysis of recent industry developments. Expect actionable data and strategic recommendations to navigate this rapidly evolving market. The market is expected to reach xx Million by 2033.
Wind Power Equipment Market Concentration & Dynamics
The Wind Power Equipment market exhibits a moderately concentrated landscape, with several major players holding significant market share. Leading companies such as Vestas Wind Systems AS, Siemens Gamesa Renewable Energy, and Goldwind hold substantial positions, while several other companies like General Electric Company, Envision Energy, Nordex SE, Enercon GmbH, Ming Yang Wind Power Group Limited, and Guodian United Power Technology Company Limited contribute significantly. However, the market also accommodates numerous smaller, specialized players, particularly in niche segments like offshore wind turbine components.
- Market Concentration: The Herfindahl-Hirschman Index (HHI) is estimated at xx, indicating a moderately concentrated market.
- Innovation Ecosystem: The market is characterized by intense R&D activity, with ongoing innovation in blade design, turbine technology, and smart grid integration.
- Regulatory Frameworks: Government policies promoting renewable energy, including tax incentives and feed-in tariffs, are major drivers, while fluctuating regulations can pose challenges.
- Substitute Products: While wind power is increasingly competitive, it faces some substitution from solar PV and other renewable energy sources, influencing market dynamics.
- End-User Trends: The increasing demand for renewable energy from utilities, independent power producers, and corporate buyers fuels market growth.
- M&A Activities: The past five years have witnessed xx M&A deals in this sector, indicating a trend towards consolidation and expansion within the industry.
Wind Power Equipment Market Industry Insights & Trends
The global wind power equipment market is experiencing robust growth, driven by increasing global energy demand, stringent environmental regulations, and the declining cost of wind energy. The market size was valued at xx Million in 2024, and is projected to exhibit a Compound Annual Growth Rate (CAGR) of xx% during the forecast period (2025-2033). Several key factors contribute to this growth:
- Government support for renewable energy initiatives: Government subsidies, tax breaks, and renewable portfolio standards are creating a favorable environment for wind energy projects.
- Technological advancements: Improved turbine designs, larger rotor diameters, and enhanced energy efficiency are making wind power more cost-effective.
- Falling capital costs: The decreasing cost of wind turbines and associated infrastructure is making wind power more competitive with fossil fuels.
- Growing awareness of climate change: Heightened awareness about climate change and the need for sustainable energy sources is driving demand for renewable energy solutions.
- Improved grid infrastructure: Enhancements in grid infrastructure are improving the integration of wind power into national power grids.
Key Markets & Segments Leading Wind Power Equipment Market
The onshore wind power segment currently dominates the market, accounting for a larger share compared to the offshore sector. However, offshore wind is experiencing rapid growth and is expected to gain considerable market share during the forecast period. Within equipment types, the rotor/blade segment is expected to maintain the largest market share, followed by towers and generators.
Dominant Regions:
- China: Boasts the largest installed wind power capacity globally, driving significant demand for wind power equipment.
- Europe: High renewable energy targets and supportive government policies are supporting market expansion.
- North America: Experiences steady growth, driven by both onshore and offshore projects.
Dominant Segments:
- Onshore: Lower installation costs and established infrastructure contribute to the current dominance of this sector.
- Rotor/Blade: The largest market segment due to the high number of turbines that require replacement or new parts.
Drivers for key segments:
- Economic growth: In developing nations, economic expansion fuels the energy demand driving the demand for wind power.
- Infrastructure development: Investments in power grids and transmission infrastructure support the growth of wind power.
- Technological advancements: Continued innovation in blade design, turbine technology, and material science is improving efficiency and reducing costs.
Wind Power Equipment Market Product Developments
Recent years have witnessed significant advancements in wind turbine technology, including the development of larger, more efficient turbines with longer blades. The focus on lighter and stronger materials, such as carbon fiber composites, is improving durability and performance. Innovations in digital technologies, such as smart grid integration and predictive maintenance systems, are also enhancing the efficiency and reliability of wind farms. These advancements contribute to the competitiveness of wind power in the global energy market.
Challenges in the Wind Power Equipment Market
The wind power equipment market faces several challenges that impact growth. Intermittency of wind power requires efficient energy storage solutions which is currently an expensive technology. Supply chain disruptions, especially relating to critical materials like rare earth elements, can affect manufacturing and project timelines, leading to delays and cost overruns. Furthermore, intense competition amongst major players necessitates continuous innovation and cost optimization to maintain market share. Regulatory uncertainties and changes in policy can also create challenges for long-term planning and investment. The industry also needs to ensure the responsible manufacturing and end-of-life management of wind turbine components.
Forces Driving Wind Power Equipment Market Growth
Several factors contribute to the sustained growth of this market. Firstly, the increasing urgency to transition away from fossil fuels and meet climate change targets is a major driver. Secondly, technological advancements, such as improved turbine designs and energy storage solutions, are improving efficiency and lowering costs. Thirdly, supportive government policies, including tax incentives and renewable energy mandates, are providing a favorable environment for investment in wind power projects.
Long-Term Growth Catalysts in the Wind Power Equipment Market
Long-term growth will be driven by ongoing technological innovations such as the development of floating offshore wind farms, expanding into deeper waters to unlock vast untapped potential. Strategic partnerships between equipment manufacturers, energy developers, and grid operators are crucial for streamlining project development and deployment. Expansion into new markets, particularly in developing countries with high renewable energy potential, will also contribute to long-term growth.
Emerging Opportunities in Wind Power Equipment Market
Emerging opportunities include the development of hybrid energy systems integrating wind power with other renewable sources, creating more reliable and efficient power generation. The increasing demand for distributed generation and microgrids presents opportunities for smaller, modular wind turbines. Furthermore, advancements in digital technologies, such as AI and machine learning, are improving operational efficiency and predictive maintenance capabilities.
Leading Players in the Wind Power Equipment Market Sector
- Guodian United Power Technology Company Limited
- Xinjiang Goldwind Science & Technology Co Ltd
- Siemens Gamesa Renewable Energy
- Envision Energy
- Senvion SA
- Vestas Wind Systems AS
- General Electric Company
- Enercon GmbH
- Ming Yang Wind Power Group Limited
- Nordex SE
Key Milestones in Wind Power Equipment Market Industry
- May 2023: Suzlon secures a 69 MW wind energy order in India, showcasing growth in the emerging markets.
- October 2022: Suzlon wins a 144.9 MW order in India, demonstrating strong demand and a focus on Hybrid Lattice Tubular (HLT) towers.
- January 2022: A 1.2 GW offshore wind project contract is signed in the Philippines, highlighting the growing potential of offshore wind energy.
Strategic Outlook for Wind Power Equipment Market
The future of the wind power equipment market appears bright, driven by strong global demand for renewable energy, ongoing technological innovation, and supportive government policies. Companies that invest in R&D, focus on efficient manufacturing, and foster strategic partnerships will be well-positioned to capitalize on this growth. The focus on sustainable practices and lifecycle management of wind turbine components will also be essential for long-term success.
Wind Power Equipment Market Segmentation
-
1. Location
- 1.1. Onshore
- 1.2. Offshore
-
2. Equipment Type
- 2.1. Rotor/Blade
- 2.2. Tower
- 2.3. Generator
- 2.4. Other Equipment Types
Wind Power Equipment Market Segmentation By Geography
-
1. North America
- 1.1. United States of America
- 1.2. Canada
- 1.3. Rest of the North America
-
2. Europe
- 2.1. United Kingdom
- 2.2. France
- 2.3. Norway
- 2.4. Italy
- 2.5. Germany
- 2.6. Rest of the Europe
-
3. Asia Pacific
- 3.1. China
- 3.2. India
- 3.3. Japan
- 3.4. Rest of the Asia Pacific
-
4. Middle East and Africa
- 4.1. United Arab Emirates
- 4.2. Saudi Arabia
- 4.3. South Africa
- 4.4. Rest of the Middle East and Africa
-
5. South America
- 5.1. Brazil
- 5.2. Argentina
- 5.3. Rest of the South America
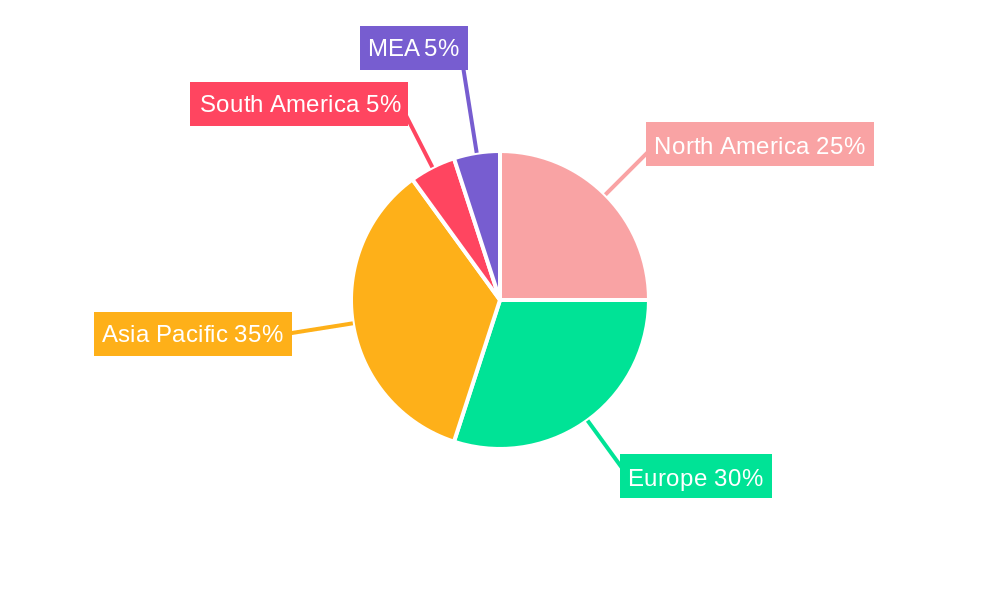
Wind Power Equipment Market Regional Market Share
Geographic Coverage of Wind Power Equipment Market
Wind Power Equipment Market REPORT HIGHLIGHTS
| Aspects | Details |
|---|---|
| Study Period | 2020-2034 |
| Base Year | 2025 |
| Estimated Year | 2026 |
| Forecast Period | 2026-2034 |
| Historical Period | 2020-2025 |
| Growth Rate | CAGR of 9.12% from 2020-2034 |
| Segmentation |
|
Table of Contents
- 1. Introduction
- 1.1. Research Scope
- 1.2. Market Segmentation
- 1.3. Research Methodology
- 1.4. Definitions and Assumptions
- 2. Executive Summary
- 2.1. Introduction
- 3. Market Dynamics
- 3.1. Introduction
- 3.2. Market Drivers
- 3.2.1. 4.; The Declining Cost of Wind Energy4.; Increasing Investments in the Wind Power Sector
- 3.3. Market Restrains
- 3.3.1. 4.; Substitution From Solar Energy and Gas-Fired Power Plants
- 3.4. Market Trends
- 3.4.1. Increasing Demand from Onshore Wind Power Industry
- 4. Market Factor Analysis
- 4.1. Porters Five Forces
- 4.2. Supply/Value Chain
- 4.3. PESTEL analysis
- 4.4. Market Entropy
- 4.5. Patent/Trademark Analysis
- 5. Global Wind Power Equipment Market Analysis, Insights and Forecast, 2020-2032
- 5.1. Market Analysis, Insights and Forecast - by Location
- 5.1.1. Onshore
- 5.1.2. Offshore
- 5.2. Market Analysis, Insights and Forecast - by Equipment Type
- 5.2.1. Rotor/Blade
- 5.2.2. Tower
- 5.2.3. Generator
- 5.2.4. Other Equipment Types
- 5.3. Market Analysis, Insights and Forecast - by Region
- 5.3.1. North America
- 5.3.2. Europe
- 5.3.3. Asia Pacific
- 5.3.4. Middle East and Africa
- 5.3.5. South America
- 5.1. Market Analysis, Insights and Forecast - by Location
- 6. North America Wind Power Equipment Market Analysis, Insights and Forecast, 2020-2032
- 6.1. Market Analysis, Insights and Forecast - by Location
- 6.1.1. Onshore
- 6.1.2. Offshore
- 6.2. Market Analysis, Insights and Forecast - by Equipment Type
- 6.2.1. Rotor/Blade
- 6.2.2. Tower
- 6.2.3. Generator
- 6.2.4. Other Equipment Types
- 6.1. Market Analysis, Insights and Forecast - by Location
- 7. Europe Wind Power Equipment Market Analysis, Insights and Forecast, 2020-2032
- 7.1. Market Analysis, Insights and Forecast - by Location
- 7.1.1. Onshore
- 7.1.2. Offshore
- 7.2. Market Analysis, Insights and Forecast - by Equipment Type
- 7.2.1. Rotor/Blade
- 7.2.2. Tower
- 7.2.3. Generator
- 7.2.4. Other Equipment Types
- 7.1. Market Analysis, Insights and Forecast - by Location
- 8. Asia Pacific Wind Power Equipment Market Analysis, Insights and Forecast, 2020-2032
- 8.1. Market Analysis, Insights and Forecast - by Location
- 8.1.1. Onshore
- 8.1.2. Offshore
- 8.2. Market Analysis, Insights and Forecast - by Equipment Type
- 8.2.1. Rotor/Blade
- 8.2.2. Tower
- 8.2.3. Generator
- 8.2.4. Other Equipment Types
- 8.1. Market Analysis, Insights and Forecast - by Location
- 9. Middle East and Africa Wind Power Equipment Market Analysis, Insights and Forecast, 2020-2032
- 9.1. Market Analysis, Insights and Forecast - by Location
- 9.1.1. Onshore
- 9.1.2. Offshore
- 9.2. Market Analysis, Insights and Forecast - by Equipment Type
- 9.2.1. Rotor/Blade
- 9.2.2. Tower
- 9.2.3. Generator
- 9.2.4. Other Equipment Types
- 9.1. Market Analysis, Insights and Forecast - by Location
- 10. South America Wind Power Equipment Market Analysis, Insights and Forecast, 2020-2032
- 10.1. Market Analysis, Insights and Forecast - by Location
- 10.1.1. Onshore
- 10.1.2. Offshore
- 10.2. Market Analysis, Insights and Forecast - by Equipment Type
- 10.2.1. Rotor/Blade
- 10.2.2. Tower
- 10.2.3. Generator
- 10.2.4. Other Equipment Types
- 10.1. Market Analysis, Insights and Forecast - by Location
- 11. North America Wind Power Equipment Market Analysis, Insights and Forecast, 2020-2032
- 11.1. Market Analysis, Insights and Forecast - By Country/Sub-region
- 11.1.1 United States
- 11.1.2 Canada
- 11.1.3 Mexico
- 12. Europe Wind Power Equipment Market Analysis, Insights and Forecast, 2020-2032
- 12.1. Market Analysis, Insights and Forecast - By Country/Sub-region
- 12.1.1 Germany
- 12.1.2 United Kingdom
- 12.1.3 France
- 12.1.4 Spain
- 12.1.5 Italy
- 12.1.6 Spain
- 12.1.7 Belgium
- 12.1.8 Netherland
- 12.1.9 Nordics
- 12.1.10 Rest of Europe
- 13. Asia Pacific Wind Power Equipment Market Analysis, Insights and Forecast, 2020-2032
- 13.1. Market Analysis, Insights and Forecast - By Country/Sub-region
- 13.1.1 China
- 13.1.2 Japan
- 13.1.3 India
- 13.1.4 South Korea
- 13.1.5 Southeast Asia
- 13.1.6 Australia
- 13.1.7 Indonesia
- 13.1.8 Phillipes
- 13.1.9 Singapore
- 13.1.10 Thailandc
- 13.1.11 Rest of Asia Pacific
- 14. South America Wind Power Equipment Market Analysis, Insights and Forecast, 2020-2032
- 14.1. Market Analysis, Insights and Forecast - By Country/Sub-region
- 14.1.1 Brazil
- 14.1.2 Argentina
- 14.1.3 Peru
- 14.1.4 Chile
- 14.1.5 Colombia
- 14.1.6 Ecuador
- 14.1.7 Venezuela
- 14.1.8 Rest of South America
- 15. North America Wind Power Equipment Market Analysis, Insights and Forecast, 2020-2032
- 15.1. Market Analysis, Insights and Forecast - By Country/Sub-region
- 15.1.1 United States
- 15.1.2 Canada
- 15.1.3 Mexico
- 16. MEA Wind Power Equipment Market Analysis, Insights and Forecast, 2020-2032
- 16.1. Market Analysis, Insights and Forecast - By Country/Sub-region
- 16.1.1 United Arab Emirates
- 16.1.2 Saudi Arabia
- 16.1.3 South Africa
- 16.1.4 Rest of Middle East and Africa
- 17. Competitive Analysis
- 17.1. Global Market Share Analysis 2025
- 17.2. Company Profiles
- 17.2.1 Guodian United Power Technology Company Limited
- 17.2.1.1. Overview
- 17.2.1.2. Products
- 17.2.1.3. SWOT Analysis
- 17.2.1.4. Recent Developments
- 17.2.1.5. Financials (Based on Availability)
- 17.2.2 Xinjiang Goldwind Science & Technology Co Ltd *List Not Exhaustive
- 17.2.2.1. Overview
- 17.2.2.2. Products
- 17.2.2.3. SWOT Analysis
- 17.2.2.4. Recent Developments
- 17.2.2.5. Financials (Based on Availability)
- 17.2.3 Siemens Gamesa Renewable Energy
- 17.2.3.1. Overview
- 17.2.3.2. Products
- 17.2.3.3. SWOT Analysis
- 17.2.3.4. Recent Developments
- 17.2.3.5. Financials (Based on Availability)
- 17.2.4 Envision Energy
- 17.2.4.1. Overview
- 17.2.4.2. Products
- 17.2.4.3. SWOT Analysis
- 17.2.4.4. Recent Developments
- 17.2.4.5. Financials (Based on Availability)
- 17.2.5 Senvion SA
- 17.2.5.1. Overview
- 17.2.5.2. Products
- 17.2.5.3. SWOT Analysis
- 17.2.5.4. Recent Developments
- 17.2.5.5. Financials (Based on Availability)
- 17.2.6 Vestas Wind Systems AS
- 17.2.6.1. Overview
- 17.2.6.2. Products
- 17.2.6.3. SWOT Analysis
- 17.2.6.4. Recent Developments
- 17.2.6.5. Financials (Based on Availability)
- 17.2.7 General Electric Company
- 17.2.7.1. Overview
- 17.2.7.2. Products
- 17.2.7.3. SWOT Analysis
- 17.2.7.4. Recent Developments
- 17.2.7.5. Financials (Based on Availability)
- 17.2.8 Enercon GmbH
- 17.2.8.1. Overview
- 17.2.8.2. Products
- 17.2.8.3. SWOT Analysis
- 17.2.8.4. Recent Developments
- 17.2.8.5. Financials (Based on Availability)
- 17.2.9 Ming Yang Wind Power Group Limited
- 17.2.9.1. Overview
- 17.2.9.2. Products
- 17.2.9.3. SWOT Analysis
- 17.2.9.4. Recent Developments
- 17.2.9.5. Financials (Based on Availability)
- 17.2.10 Nordex SE
- 17.2.10.1. Overview
- 17.2.10.2. Products
- 17.2.10.3. SWOT Analysis
- 17.2.10.4. Recent Developments
- 17.2.10.5. Financials (Based on Availability)
- 17.2.1 Guodian United Power Technology Company Limited
List of Figures
- Figure 1: Global Wind Power Equipment Market Revenue Breakdown (Million, %) by Region 2025 & 2033
- Figure 2: Global Wind Power Equipment Market Volume Breakdown (K Units, %) by Region 2025 & 2033
- Figure 3: North America Wind Power Equipment Market Revenue (Million), by Country 2025 & 2033
- Figure 4: North America Wind Power Equipment Market Volume (K Units), by Country 2025 & 2033
- Figure 5: North America Wind Power Equipment Market Revenue Share (%), by Country 2025 & 2033
- Figure 6: North America Wind Power Equipment Market Volume Share (%), by Country 2025 & 2033
- Figure 7: Europe Wind Power Equipment Market Revenue (Million), by Country 2025 & 2033
- Figure 8: Europe Wind Power Equipment Market Volume (K Units), by Country 2025 & 2033
- Figure 9: Europe Wind Power Equipment Market Revenue Share (%), by Country 2025 & 2033
- Figure 10: Europe Wind Power Equipment Market Volume Share (%), by Country 2025 & 2033
- Figure 11: Asia Pacific Wind Power Equipment Market Revenue (Million), by Country 2025 & 2033
- Figure 12: Asia Pacific Wind Power Equipment Market Volume (K Units), by Country 2025 & 2033
- Figure 13: Asia Pacific Wind Power Equipment Market Revenue Share (%), by Country 2025 & 2033
- Figure 14: Asia Pacific Wind Power Equipment Market Volume Share (%), by Country 2025 & 2033
- Figure 15: South America Wind Power Equipment Market Revenue (Million), by Country 2025 & 2033
- Figure 16: South America Wind Power Equipment Market Volume (K Units), by Country 2025 & 2033
- Figure 17: South America Wind Power Equipment Market Revenue Share (%), by Country 2025 & 2033
- Figure 18: South America Wind Power Equipment Market Volume Share (%), by Country 2025 & 2033
- Figure 19: North America Wind Power Equipment Market Revenue (Million), by Country 2025 & 2033
- Figure 20: North America Wind Power Equipment Market Volume (K Units), by Country 2025 & 2033
- Figure 21: North America Wind Power Equipment Market Revenue Share (%), by Country 2025 & 2033
- Figure 22: North America Wind Power Equipment Market Volume Share (%), by Country 2025 & 2033
- Figure 23: MEA Wind Power Equipment Market Revenue (Million), by Country 2025 & 2033
- Figure 24: MEA Wind Power Equipment Market Volume (K Units), by Country 2025 & 2033
- Figure 25: MEA Wind Power Equipment Market Revenue Share (%), by Country 2025 & 2033
- Figure 26: MEA Wind Power Equipment Market Volume Share (%), by Country 2025 & 2033
- Figure 27: North America Wind Power Equipment Market Revenue (Million), by Location 2025 & 2033
- Figure 28: North America Wind Power Equipment Market Volume (K Units), by Location 2025 & 2033
- Figure 29: North America Wind Power Equipment Market Revenue Share (%), by Location 2025 & 2033
- Figure 30: North America Wind Power Equipment Market Volume Share (%), by Location 2025 & 2033
- Figure 31: North America Wind Power Equipment Market Revenue (Million), by Equipment Type 2025 & 2033
- Figure 32: North America Wind Power Equipment Market Volume (K Units), by Equipment Type 2025 & 2033
- Figure 33: North America Wind Power Equipment Market Revenue Share (%), by Equipment Type 2025 & 2033
- Figure 34: North America Wind Power Equipment Market Volume Share (%), by Equipment Type 2025 & 2033
- Figure 35: North America Wind Power Equipment Market Revenue (Million), by Country 2025 & 2033
- Figure 36: North America Wind Power Equipment Market Volume (K Units), by Country 2025 & 2033
- Figure 37: North America Wind Power Equipment Market Revenue Share (%), by Country 2025 & 2033
- Figure 38: North America Wind Power Equipment Market Volume Share (%), by Country 2025 & 2033
- Figure 39: Europe Wind Power Equipment Market Revenue (Million), by Location 2025 & 2033
- Figure 40: Europe Wind Power Equipment Market Volume (K Units), by Location 2025 & 2033
- Figure 41: Europe Wind Power Equipment Market Revenue Share (%), by Location 2025 & 2033
- Figure 42: Europe Wind Power Equipment Market Volume Share (%), by Location 2025 & 2033
- Figure 43: Europe Wind Power Equipment Market Revenue (Million), by Equipment Type 2025 & 2033
- Figure 44: Europe Wind Power Equipment Market Volume (K Units), by Equipment Type 2025 & 2033
- Figure 45: Europe Wind Power Equipment Market Revenue Share (%), by Equipment Type 2025 & 2033
- Figure 46: Europe Wind Power Equipment Market Volume Share (%), by Equipment Type 2025 & 2033
- Figure 47: Europe Wind Power Equipment Market Revenue (Million), by Country 2025 & 2033
- Figure 48: Europe Wind Power Equipment Market Volume (K Units), by Country 2025 & 2033
- Figure 49: Europe Wind Power Equipment Market Revenue Share (%), by Country 2025 & 2033
- Figure 50: Europe Wind Power Equipment Market Volume Share (%), by Country 2025 & 2033
- Figure 51: Asia Pacific Wind Power Equipment Market Revenue (Million), by Location 2025 & 2033
- Figure 52: Asia Pacific Wind Power Equipment Market Volume (K Units), by Location 2025 & 2033
- Figure 53: Asia Pacific Wind Power Equipment Market Revenue Share (%), by Location 2025 & 2033
- Figure 54: Asia Pacific Wind Power Equipment Market Volume Share (%), by Location 2025 & 2033
- Figure 55: Asia Pacific Wind Power Equipment Market Revenue (Million), by Equipment Type 2025 & 2033
- Figure 56: Asia Pacific Wind Power Equipment Market Volume (K Units), by Equipment Type 2025 & 2033
- Figure 57: Asia Pacific Wind Power Equipment Market Revenue Share (%), by Equipment Type 2025 & 2033
- Figure 58: Asia Pacific Wind Power Equipment Market Volume Share (%), by Equipment Type 2025 & 2033
- Figure 59: Asia Pacific Wind Power Equipment Market Revenue (Million), by Country 2025 & 2033
- Figure 60: Asia Pacific Wind Power Equipment Market Volume (K Units), by Country 2025 & 2033
- Figure 61: Asia Pacific Wind Power Equipment Market Revenue Share (%), by Country 2025 & 2033
- Figure 62: Asia Pacific Wind Power Equipment Market Volume Share (%), by Country 2025 & 2033
- Figure 63: Middle East and Africa Wind Power Equipment Market Revenue (Million), by Location 2025 & 2033
- Figure 64: Middle East and Africa Wind Power Equipment Market Volume (K Units), by Location 2025 & 2033
- Figure 65: Middle East and Africa Wind Power Equipment Market Revenue Share (%), by Location 2025 & 2033
- Figure 66: Middle East and Africa Wind Power Equipment Market Volume Share (%), by Location 2025 & 2033
- Figure 67: Middle East and Africa Wind Power Equipment Market Revenue (Million), by Equipment Type 2025 & 2033
- Figure 68: Middle East and Africa Wind Power Equipment Market Volume (K Units), by Equipment Type 2025 & 2033
- Figure 69: Middle East and Africa Wind Power Equipment Market Revenue Share (%), by Equipment Type 2025 & 2033
- Figure 70: Middle East and Africa Wind Power Equipment Market Volume Share (%), by Equipment Type 2025 & 2033
- Figure 71: Middle East and Africa Wind Power Equipment Market Revenue (Million), by Country 2025 & 2033
- Figure 72: Middle East and Africa Wind Power Equipment Market Volume (K Units), by Country 2025 & 2033
- Figure 73: Middle East and Africa Wind Power Equipment Market Revenue Share (%), by Country 2025 & 2033
- Figure 74: Middle East and Africa Wind Power Equipment Market Volume Share (%), by Country 2025 & 2033
- Figure 75: South America Wind Power Equipment Market Revenue (Million), by Location 2025 & 2033
- Figure 76: South America Wind Power Equipment Market Volume (K Units), by Location 2025 & 2033
- Figure 77: South America Wind Power Equipment Market Revenue Share (%), by Location 2025 & 2033
- Figure 78: South America Wind Power Equipment Market Volume Share (%), by Location 2025 & 2033
- Figure 79: South America Wind Power Equipment Market Revenue (Million), by Equipment Type 2025 & 2033
- Figure 80: South America Wind Power Equipment Market Volume (K Units), by Equipment Type 2025 & 2033
- Figure 81: South America Wind Power Equipment Market Revenue Share (%), by Equipment Type 2025 & 2033
- Figure 82: South America Wind Power Equipment Market Volume Share (%), by Equipment Type 2025 & 2033
- Figure 83: South America Wind Power Equipment Market Revenue (Million), by Country 2025 & 2033
- Figure 84: South America Wind Power Equipment Market Volume (K Units), by Country 2025 & 2033
- Figure 85: South America Wind Power Equipment Market Revenue Share (%), by Country 2025 & 2033
- Figure 86: South America Wind Power Equipment Market Volume Share (%), by Country 2025 & 2033
List of Tables
- Table 1: Global Wind Power Equipment Market Revenue Million Forecast, by Region 2020 & 2033
- Table 2: Global Wind Power Equipment Market Volume K Units Forecast, by Region 2020 & 2033
- Table 3: Global Wind Power Equipment Market Revenue Million Forecast, by Location 2020 & 2033
- Table 4: Global Wind Power Equipment Market Volume K Units Forecast, by Location 2020 & 2033
- Table 5: Global Wind Power Equipment Market Revenue Million Forecast, by Equipment Type 2020 & 2033
- Table 6: Global Wind Power Equipment Market Volume K Units Forecast, by Equipment Type 2020 & 2033
- Table 7: Global Wind Power Equipment Market Revenue Million Forecast, by Region 2020 & 2033
- Table 8: Global Wind Power Equipment Market Volume K Units Forecast, by Region 2020 & 2033
- Table 9: Global Wind Power Equipment Market Revenue Million Forecast, by Country 2020 & 2033
- Table 10: Global Wind Power Equipment Market Volume K Units Forecast, by Country 2020 & 2033
- Table 11: United States Wind Power Equipment Market Revenue (Million) Forecast, by Application 2020 & 2033
- Table 12: United States Wind Power Equipment Market Volume (K Units) Forecast, by Application 2020 & 2033
- Table 13: Canada Wind Power Equipment Market Revenue (Million) Forecast, by Application 2020 & 2033
- Table 14: Canada Wind Power Equipment Market Volume (K Units) Forecast, by Application 2020 & 2033
- Table 15: Mexico Wind Power Equipment Market Revenue (Million) Forecast, by Application 2020 & 2033
- Table 16: Mexico Wind Power Equipment Market Volume (K Units) Forecast, by Application 2020 & 2033
- Table 17: Global Wind Power Equipment Market Revenue Million Forecast, by Country 2020 & 2033
- Table 18: Global Wind Power Equipment Market Volume K Units Forecast, by Country 2020 & 2033
- Table 19: Germany Wind Power Equipment Market Revenue (Million) Forecast, by Application 2020 & 2033
- Table 20: Germany Wind Power Equipment Market Volume (K Units) Forecast, by Application 2020 & 2033
- Table 21: United Kingdom Wind Power Equipment Market Revenue (Million) Forecast, by Application 2020 & 2033
- Table 22: United Kingdom Wind Power Equipment Market Volume (K Units) Forecast, by Application 2020 & 2033
- Table 23: France Wind Power Equipment Market Revenue (Million) Forecast, by Application 2020 & 2033
- Table 24: France Wind Power Equipment Market Volume (K Units) Forecast, by Application 2020 & 2033
- Table 25: Spain Wind Power Equipment Market Revenue (Million) Forecast, by Application 2020 & 2033
- Table 26: Spain Wind Power Equipment Market Volume (K Units) Forecast, by Application 2020 & 2033
- Table 27: Italy Wind Power Equipment Market Revenue (Million) Forecast, by Application 2020 & 2033
- Table 28: Italy Wind Power Equipment Market Volume (K Units) Forecast, by Application 2020 & 2033
- Table 29: Spain Wind Power Equipment Market Revenue (Million) Forecast, by Application 2020 & 2033
- Table 30: Spain Wind Power Equipment Market Volume (K Units) Forecast, by Application 2020 & 2033
- Table 31: Belgium Wind Power Equipment Market Revenue (Million) Forecast, by Application 2020 & 2033
- Table 32: Belgium Wind Power Equipment Market Volume (K Units) Forecast, by Application 2020 & 2033
- Table 33: Netherland Wind Power Equipment Market Revenue (Million) Forecast, by Application 2020 & 2033
- Table 34: Netherland Wind Power Equipment Market Volume (K Units) Forecast, by Application 2020 & 2033
- Table 35: Nordics Wind Power Equipment Market Revenue (Million) Forecast, by Application 2020 & 2033
- Table 36: Nordics Wind Power Equipment Market Volume (K Units) Forecast, by Application 2020 & 2033
- Table 37: Rest of Europe Wind Power Equipment Market Revenue (Million) Forecast, by Application 2020 & 2033
- Table 38: Rest of Europe Wind Power Equipment Market Volume (K Units) Forecast, by Application 2020 & 2033
- Table 39: Global Wind Power Equipment Market Revenue Million Forecast, by Country 2020 & 2033
- Table 40: Global Wind Power Equipment Market Volume K Units Forecast, by Country 2020 & 2033
- Table 41: China Wind Power Equipment Market Revenue (Million) Forecast, by Application 2020 & 2033
- Table 42: China Wind Power Equipment Market Volume (K Units) Forecast, by Application 2020 & 2033
- Table 43: Japan Wind Power Equipment Market Revenue (Million) Forecast, by Application 2020 & 2033
- Table 44: Japan Wind Power Equipment Market Volume (K Units) Forecast, by Application 2020 & 2033
- Table 45: India Wind Power Equipment Market Revenue (Million) Forecast, by Application 2020 & 2033
- Table 46: India Wind Power Equipment Market Volume (K Units) Forecast, by Application 2020 & 2033
- Table 47: South Korea Wind Power Equipment Market Revenue (Million) Forecast, by Application 2020 & 2033
- Table 48: South Korea Wind Power Equipment Market Volume (K Units) Forecast, by Application 2020 & 2033
- Table 49: Southeast Asia Wind Power Equipment Market Revenue (Million) Forecast, by Application 2020 & 2033
- Table 50: Southeast Asia Wind Power Equipment Market Volume (K Units) Forecast, by Application 2020 & 2033
- Table 51: Australia Wind Power Equipment Market Revenue (Million) Forecast, by Application 2020 & 2033
- Table 52: Australia Wind Power Equipment Market Volume (K Units) Forecast, by Application 2020 & 2033
- Table 53: Indonesia Wind Power Equipment Market Revenue (Million) Forecast, by Application 2020 & 2033
- Table 54: Indonesia Wind Power Equipment Market Volume (K Units) Forecast, by Application 2020 & 2033
- Table 55: Phillipes Wind Power Equipment Market Revenue (Million) Forecast, by Application 2020 & 2033
- Table 56: Phillipes Wind Power Equipment Market Volume (K Units) Forecast, by Application 2020 & 2033
- Table 57: Singapore Wind Power Equipment Market Revenue (Million) Forecast, by Application 2020 & 2033
- Table 58: Singapore Wind Power Equipment Market Volume (K Units) Forecast, by Application 2020 & 2033
- Table 59: Thailandc Wind Power Equipment Market Revenue (Million) Forecast, by Application 2020 & 2033
- Table 60: Thailandc Wind Power Equipment Market Volume (K Units) Forecast, by Application 2020 & 2033
- Table 61: Rest of Asia Pacific Wind Power Equipment Market Revenue (Million) Forecast, by Application 2020 & 2033
- Table 62: Rest of Asia Pacific Wind Power Equipment Market Volume (K Units) Forecast, by Application 2020 & 2033
- Table 63: Global Wind Power Equipment Market Revenue Million Forecast, by Country 2020 & 2033
- Table 64: Global Wind Power Equipment Market Volume K Units Forecast, by Country 2020 & 2033
- Table 65: Brazil Wind Power Equipment Market Revenue (Million) Forecast, by Application 2020 & 2033
- Table 66: Brazil Wind Power Equipment Market Volume (K Units) Forecast, by Application 2020 & 2033
- Table 67: Argentina Wind Power Equipment Market Revenue (Million) Forecast, by Application 2020 & 2033
- Table 68: Argentina Wind Power Equipment Market Volume (K Units) Forecast, by Application 2020 & 2033
- Table 69: Peru Wind Power Equipment Market Revenue (Million) Forecast, by Application 2020 & 2033
- Table 70: Peru Wind Power Equipment Market Volume (K Units) Forecast, by Application 2020 & 2033
- Table 71: Chile Wind Power Equipment Market Revenue (Million) Forecast, by Application 2020 & 2033
- Table 72: Chile Wind Power Equipment Market Volume (K Units) Forecast, by Application 2020 & 2033
- Table 73: Colombia Wind Power Equipment Market Revenue (Million) Forecast, by Application 2020 & 2033
- Table 74: Colombia Wind Power Equipment Market Volume (K Units) Forecast, by Application 2020 & 2033
- Table 75: Ecuador Wind Power Equipment Market Revenue (Million) Forecast, by Application 2020 & 2033
- Table 76: Ecuador Wind Power Equipment Market Volume (K Units) Forecast, by Application 2020 & 2033
- Table 77: Venezuela Wind Power Equipment Market Revenue (Million) Forecast, by Application 2020 & 2033
- Table 78: Venezuela Wind Power Equipment Market Volume (K Units) Forecast, by Application 2020 & 2033
- Table 79: Rest of South America Wind Power Equipment Market Revenue (Million) Forecast, by Application 2020 & 2033
- Table 80: Rest of South America Wind Power Equipment Market Volume (K Units) Forecast, by Application 2020 & 2033
- Table 81: Global Wind Power Equipment Market Revenue Million Forecast, by Country 2020 & 2033
- Table 82: Global Wind Power Equipment Market Volume K Units Forecast, by Country 2020 & 2033
- Table 83: United States Wind Power Equipment Market Revenue (Million) Forecast, by Application 2020 & 2033
- Table 84: United States Wind Power Equipment Market Volume (K Units) Forecast, by Application 2020 & 2033
- Table 85: Canada Wind Power Equipment Market Revenue (Million) Forecast, by Application 2020 & 2033
- Table 86: Canada Wind Power Equipment Market Volume (K Units) Forecast, by Application 2020 & 2033
- Table 87: Mexico Wind Power Equipment Market Revenue (Million) Forecast, by Application 2020 & 2033
- Table 88: Mexico Wind Power Equipment Market Volume (K Units) Forecast, by Application 2020 & 2033
- Table 89: Global Wind Power Equipment Market Revenue Million Forecast, by Country 2020 & 2033
- Table 90: Global Wind Power Equipment Market Volume K Units Forecast, by Country 2020 & 2033
- Table 91: United Arab Emirates Wind Power Equipment Market Revenue (Million) Forecast, by Application 2020 & 2033
- Table 92: United Arab Emirates Wind Power Equipment Market Volume (K Units) Forecast, by Application 2020 & 2033
- Table 93: Saudi Arabia Wind Power Equipment Market Revenue (Million) Forecast, by Application 2020 & 2033
- Table 94: Saudi Arabia Wind Power Equipment Market Volume (K Units) Forecast, by Application 2020 & 2033
- Table 95: South Africa Wind Power Equipment Market Revenue (Million) Forecast, by Application 2020 & 2033
- Table 96: South Africa Wind Power Equipment Market Volume (K Units) Forecast, by Application 2020 & 2033
- Table 97: Rest of Middle East and Africa Wind Power Equipment Market Revenue (Million) Forecast, by Application 2020 & 2033
- Table 98: Rest of Middle East and Africa Wind Power Equipment Market Volume (K Units) Forecast, by Application 2020 & 2033
- Table 99: Global Wind Power Equipment Market Revenue Million Forecast, by Location 2020 & 2033
- Table 100: Global Wind Power Equipment Market Volume K Units Forecast, by Location 2020 & 2033
- Table 101: Global Wind Power Equipment Market Revenue Million Forecast, by Equipment Type 2020 & 2033
- Table 102: Global Wind Power Equipment Market Volume K Units Forecast, by Equipment Type 2020 & 2033
- Table 103: Global Wind Power Equipment Market Revenue Million Forecast, by Country 2020 & 2033
- Table 104: Global Wind Power Equipment Market Volume K Units Forecast, by Country 2020 & 2033
- Table 105: United States of America Wind Power Equipment Market Revenue (Million) Forecast, by Application 2020 & 2033
- Table 106: United States of America Wind Power Equipment Market Volume (K Units) Forecast, by Application 2020 & 2033
- Table 107: Canada Wind Power Equipment Market Revenue (Million) Forecast, by Application 2020 & 2033
- Table 108: Canada Wind Power Equipment Market Volume (K Units) Forecast, by Application 2020 & 2033
- Table 109: Rest of the North America Wind Power Equipment Market Revenue (Million) Forecast, by Application 2020 & 2033
- Table 110: Rest of the North America Wind Power Equipment Market Volume (K Units) Forecast, by Application 2020 & 2033
- Table 111: Global Wind Power Equipment Market Revenue Million Forecast, by Location 2020 & 2033
- Table 112: Global Wind Power Equipment Market Volume K Units Forecast, by Location 2020 & 2033
- Table 113: Global Wind Power Equipment Market Revenue Million Forecast, by Equipment Type 2020 & 2033
- Table 114: Global Wind Power Equipment Market Volume K Units Forecast, by Equipment Type 2020 & 2033
- Table 115: Global Wind Power Equipment Market Revenue Million Forecast, by Country 2020 & 2033
- Table 116: Global Wind Power Equipment Market Volume K Units Forecast, by Country 2020 & 2033
- Table 117: United Kingdom Wind Power Equipment Market Revenue (Million) Forecast, by Application 2020 & 2033
- Table 118: United Kingdom Wind Power Equipment Market Volume (K Units) Forecast, by Application 2020 & 2033
- Table 119: France Wind Power Equipment Market Revenue (Million) Forecast, by Application 2020 & 2033
- Table 120: France Wind Power Equipment Market Volume (K Units) Forecast, by Application 2020 & 2033
- Table 121: Norway Wind Power Equipment Market Revenue (Million) Forecast, by Application 2020 & 2033
- Table 122: Norway Wind Power Equipment Market Volume (K Units) Forecast, by Application 2020 & 2033
- Table 123: Italy Wind Power Equipment Market Revenue (Million) Forecast, by Application 2020 & 2033
- Table 124: Italy Wind Power Equipment Market Volume (K Units) Forecast, by Application 2020 & 2033
- Table 125: Germany Wind Power Equipment Market Revenue (Million) Forecast, by Application 2020 & 2033
- Table 126: Germany Wind Power Equipment Market Volume (K Units) Forecast, by Application 2020 & 2033
- Table 127: Rest of the Europe Wind Power Equipment Market Revenue (Million) Forecast, by Application 2020 & 2033
- Table 128: Rest of the Europe Wind Power Equipment Market Volume (K Units) Forecast, by Application 2020 & 2033
- Table 129: Global Wind Power Equipment Market Revenue Million Forecast, by Location 2020 & 2033
- Table 130: Global Wind Power Equipment Market Volume K Units Forecast, by Location 2020 & 2033
- Table 131: Global Wind Power Equipment Market Revenue Million Forecast, by Equipment Type 2020 & 2033
- Table 132: Global Wind Power Equipment Market Volume K Units Forecast, by Equipment Type 2020 & 2033
- Table 133: Global Wind Power Equipment Market Revenue Million Forecast, by Country 2020 & 2033
- Table 134: Global Wind Power Equipment Market Volume K Units Forecast, by Country 2020 & 2033
- Table 135: China Wind Power Equipment Market Revenue (Million) Forecast, by Application 2020 & 2033
- Table 136: China Wind Power Equipment Market Volume (K Units) Forecast, by Application 2020 & 2033
- Table 137: India Wind Power Equipment Market Revenue (Million) Forecast, by Application 2020 & 2033
- Table 138: India Wind Power Equipment Market Volume (K Units) Forecast, by Application 2020 & 2033
- Table 139: Japan Wind Power Equipment Market Revenue (Million) Forecast, by Application 2020 & 2033
- Table 140: Japan Wind Power Equipment Market Volume (K Units) Forecast, by Application 2020 & 2033
- Table 141: Rest of the Asia Pacific Wind Power Equipment Market Revenue (Million) Forecast, by Application 2020 & 2033
- Table 142: Rest of the Asia Pacific Wind Power Equipment Market Volume (K Units) Forecast, by Application 2020 & 2033
- Table 143: Global Wind Power Equipment Market Revenue Million Forecast, by Location 2020 & 2033
- Table 144: Global Wind Power Equipment Market Volume K Units Forecast, by Location 2020 & 2033
- Table 145: Global Wind Power Equipment Market Revenue Million Forecast, by Equipment Type 2020 & 2033
- Table 146: Global Wind Power Equipment Market Volume K Units Forecast, by Equipment Type 2020 & 2033
- Table 147: Global Wind Power Equipment Market Revenue Million Forecast, by Country 2020 & 2033
- Table 148: Global Wind Power Equipment Market Volume K Units Forecast, by Country 2020 & 2033
- Table 149: United Arab Emirates Wind Power Equipment Market Revenue (Million) Forecast, by Application 2020 & 2033
- Table 150: United Arab Emirates Wind Power Equipment Market Volume (K Units) Forecast, by Application 2020 & 2033
- Table 151: Saudi Arabia Wind Power Equipment Market Revenue (Million) Forecast, by Application 2020 & 2033
- Table 152: Saudi Arabia Wind Power Equipment Market Volume (K Units) Forecast, by Application 2020 & 2033
- Table 153: South Africa Wind Power Equipment Market Revenue (Million) Forecast, by Application 2020 & 2033
- Table 154: South Africa Wind Power Equipment Market Volume (K Units) Forecast, by Application 2020 & 2033
- Table 155: Rest of the Middle East and Africa Wind Power Equipment Market Revenue (Million) Forecast, by Application 2020 & 2033
- Table 156: Rest of the Middle East and Africa Wind Power Equipment Market Volume (K Units) Forecast, by Application 2020 & 2033
- Table 157: Global Wind Power Equipment Market Revenue Million Forecast, by Location 2020 & 2033
- Table 158: Global Wind Power Equipment Market Volume K Units Forecast, by Location 2020 & 2033
- Table 159: Global Wind Power Equipment Market Revenue Million Forecast, by Equipment Type 2020 & 2033
- Table 160: Global Wind Power Equipment Market Volume K Units Forecast, by Equipment Type 2020 & 2033
- Table 161: Global Wind Power Equipment Market Revenue Million Forecast, by Country 2020 & 2033
- Table 162: Global Wind Power Equipment Market Volume K Units Forecast, by Country 2020 & 2033
- Table 163: Brazil Wind Power Equipment Market Revenue (Million) Forecast, by Application 2020 & 2033
- Table 164: Brazil Wind Power Equipment Market Volume (K Units) Forecast, by Application 2020 & 2033
- Table 165: Argentina Wind Power Equipment Market Revenue (Million) Forecast, by Application 2020 & 2033
- Table 166: Argentina Wind Power Equipment Market Volume (K Units) Forecast, by Application 2020 & 2033
- Table 167: Rest of the South America Wind Power Equipment Market Revenue (Million) Forecast, by Application 2020 & 2033
- Table 168: Rest of the South America Wind Power Equipment Market Volume (K Units) Forecast, by Application 2020 & 2033
Frequently Asked Questions
1. What is the projected Compound Annual Growth Rate (CAGR) of the Wind Power Equipment Market?
The projected CAGR is approximately 9.12%.
2. Which companies are prominent players in the Wind Power Equipment Market?
Key companies in the market include Guodian United Power Technology Company Limited, Xinjiang Goldwind Science & Technology Co Ltd *List Not Exhaustive, Siemens Gamesa Renewable Energy, Envision Energy, Senvion SA, Vestas Wind Systems AS, General Electric Company, Enercon GmbH, Ming Yang Wind Power Group Limited, Nordex SE.
3. What are the main segments of the Wind Power Equipment Market?
The market segments include Location, Equipment Type.
4. Can you provide details about the market size?
The market size is estimated to be USD XX Million as of 2022.
5. What are some drivers contributing to market growth?
4.; The Declining Cost of Wind Energy4.; Increasing Investments in the Wind Power Sector.
6. What are the notable trends driving market growth?
Increasing Demand from Onshore Wind Power Industry.
7. Are there any restraints impacting market growth?
4.; Substitution From Solar Energy and Gas-Fired Power Plants.
8. Can you provide examples of recent developments in the market?
May 2023: Suzlon, a developer of renewable energy solutions, has received a 69 MW wind energy order from the Indian division of a renowned Nordic Energy Company. Suzlon will deploy 23 wind turbine generators (WTGs) with 3 MW rated capacity and a Hybrid Lattice Tubular (HLT) tower.
9. What pricing options are available for accessing the report?
Pricing options include single-user, multi-user, and enterprise licenses priced at USD 4750, USD 5250, and USD 8750 respectively.
10. Is the market size provided in terms of value or volume?
The market size is provided in terms of value, measured in Million and volume, measured in K Units.
11. Are there any specific market keywords associated with the report?
Yes, the market keyword associated with the report is "Wind Power Equipment Market," which aids in identifying and referencing the specific market segment covered.
12. How do I determine which pricing option suits my needs best?
The pricing options vary based on user requirements and access needs. Individual users may opt for single-user licenses, while businesses requiring broader access may choose multi-user or enterprise licenses for cost-effective access to the report.
13. Are there any additional resources or data provided in the Wind Power Equipment Market report?
While the report offers comprehensive insights, it's advisable to review the specific contents or supplementary materials provided to ascertain if additional resources or data are available.
14. How can I stay updated on further developments or reports in the Wind Power Equipment Market?
To stay informed about further developments, trends, and reports in the Wind Power Equipment Market, consider subscribing to industry newsletters, following relevant companies and organizations, or regularly checking reputable industry news sources and publications.
Methodology
Step 1 - Identification of Relevant Samples Size from Population Database


Step 2 - Approaches for Defining Global Market Size (Value, Volume* & Price*)

Note*: In applicable scenarios
Step 3 - Data Sources
Primary Research
- Web Analytics
- Survey Reports
- Research Institute
- Latest Research Reports
- Opinion Leaders
Secondary Research
- Annual Reports
- White Paper
- Latest Press Release
- Industry Association
- Paid Database
- Investor Presentations

Step 4 - Data Triangulation
Involves using different sources of information in order to increase the validity of a study
These sources are likely to be stakeholders in a program - participants, other researchers, program staff, other community members, and so on.
Then we put all data in single framework & apply various statistical tools to find out the dynamic on the market.
During the analysis stage, feedback from the stakeholder groups would be compared to determine areas of agreement as well as areas of divergence
