

Key Insights
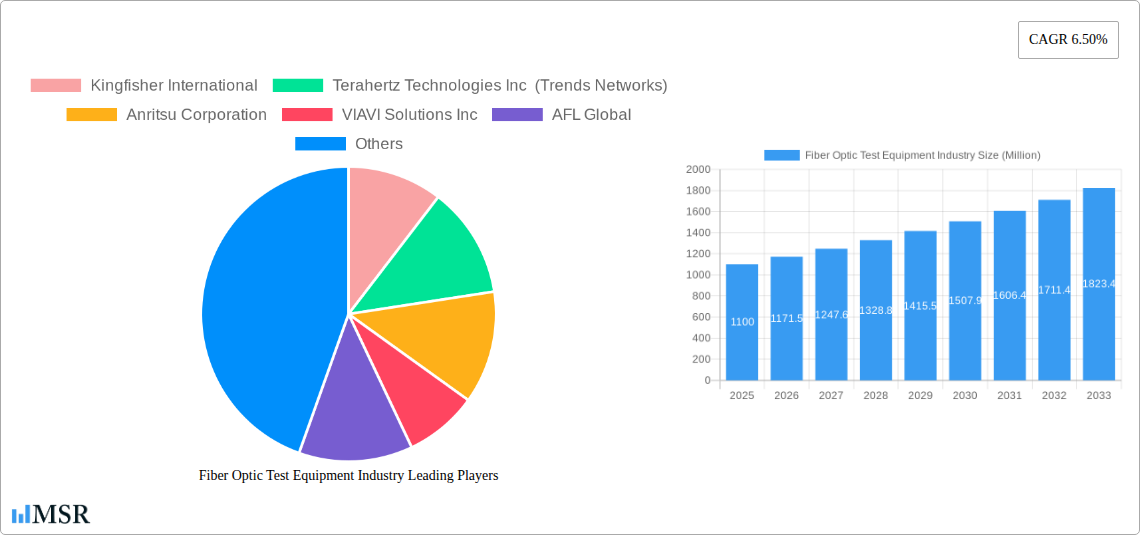
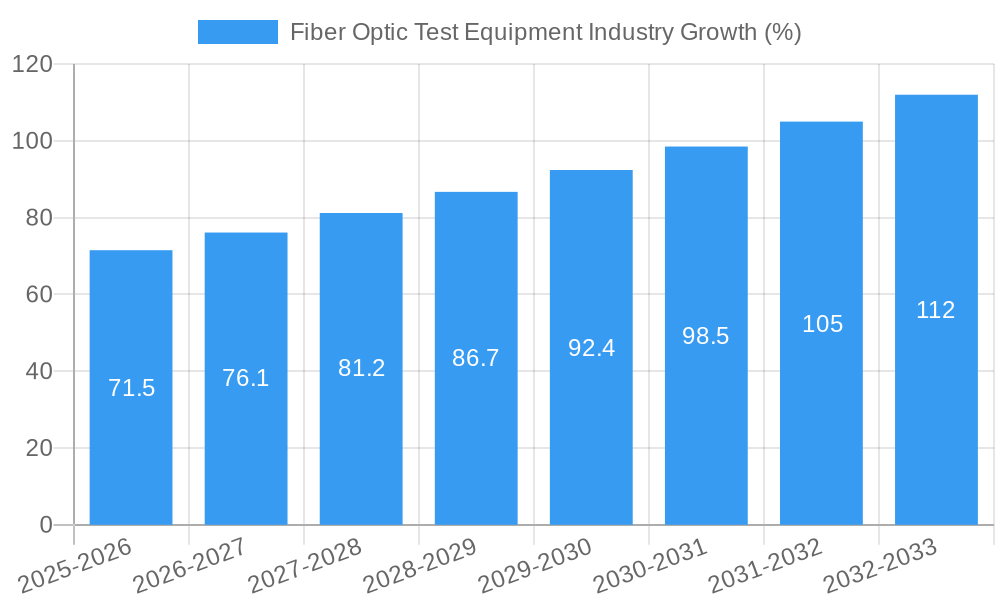
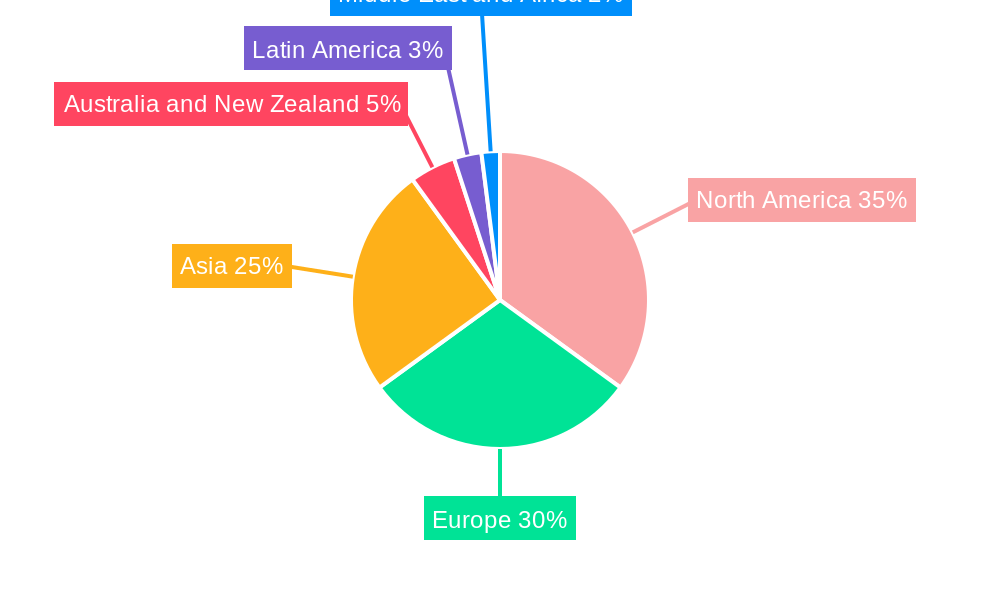
The Fiber Optic Test Equipment market, valued at approximately $1.10 billion in 2025, is projected to experience robust growth, driven by the escalating demand for high-speed internet connectivity, expanding data centers, and the proliferation of 5G networks. The market's Compound Annual Growth Rate (CAGR) of 6.50% from 2025 to 2033 indicates a significant expansion in market size over the forecast period. Key growth drivers include the increasing need for reliable and efficient network infrastructure testing, the adoption of advanced technologies like OTN and coherent optical systems, and the growing demand for improved network performance and availability across various sectors, including telecommunications, data centers, and industries. The market is segmented by equipment type (Optical Light Sources, Optical Power and Loss Meters, Optical Time Domain Reflectometer (OTDR), Optical Spectrum Analyzers, Remote Fiber Test Systems, and other equipment) and end-user application (Telecommunications, Data Centers, Industries, and other applications). North America and Europe currently hold significant market shares, but the Asia-Pacific region is expected to witness substantial growth, fueled by rapid infrastructure development and increasing digitalization. Competitive pressures among major players like VIAVI Solutions, Anritsu, and Fluke Networks are shaping market strategies, including product innovation and strategic partnerships.
The restraints on market growth primarily involve the high initial investment costs associated with purchasing advanced fiber optic test equipment. This can be a barrier to entry for smaller companies and limit widespread adoption, particularly in developing economies. However, advancements in technology are leading to more cost-effective solutions, making the equipment more accessible. Furthermore, the increasing demand for high-bandwidth applications is outweighing the cost concerns, ultimately driving market growth. The continuous evolution of fiber optic technologies and the need for specialized testing equipment for each new generation necessitates ongoing investments in research and development by manufacturers to maintain market competitiveness and cater to evolving industry needs. The adoption of cloud-based solutions for remote testing and monitoring is expected to reshape the market landscape by offering flexible and cost-effective alternatives.
Fiber Optic Test Equipment Industry Market Report: 2019-2033
This comprehensive report provides a detailed analysis of the Fiber Optic Test Equipment industry, covering market size, growth drivers, key players, and future trends. With a study period spanning 2019-2033, a base year of 2025, and a forecast period of 2025-2033, this report offers invaluable insights for industry stakeholders, investors, and businesses seeking to understand this dynamic market. The global market valuation reached xx Million in 2024 and is projected to reach xx Million by 2033, exhibiting a CAGR of xx%.
Fiber Optic Test Equipment Industry Market Concentration & Dynamics
The Fiber Optic Test Equipment market exhibits a moderately concentrated landscape, with several key players holding significant market share. While precise market share figures for each company require further dedicated research and analysis (data not currently available and therefore estimated), companies such as VIAVI Solutions Inc, Anritsu Corporation, and Fluke Networks are major players. The industry's innovation ecosystem is robust, driven by the continuous advancement of fiber optic technologies and the growing demand for higher bandwidths. Regulatory frameworks, particularly those related to safety and interoperability standards, influence market dynamics. Substitute products, while limited, include traditional copper-based testing methods, but their relevance is diminishing due to fiber optic's superior performance. End-user trends strongly favor higher speed and capacity fiber optic networks, fueling demand for advanced testing equipment. M&A activities in the recent past (2019-2024) have seen approximately xx deals, primarily focused on consolidating market share and expanding technological capabilities, influencing competition and market concentration. The landscape shows continuous development and evolution as the market expands.
Fiber Optic Test Equipment Industry Industry Insights & Trends
The global fiber optic test equipment market is experiencing robust growth, driven by the expanding global fiber optic infrastructure. The increasing adoption of 5G and high-speed internet services is a major catalyst, creating significant demand for advanced testing solutions. Data center expansion and the growth of cloud computing are also contributing significantly to market expansion. Technological disruptions, such as the development of 800G technology and beyond, are driving the need for faster and more versatile testing equipment. Evolving consumer behaviors, particularly the increasing demand for high-bandwidth applications like streaming video and online gaming, are fueling the growth of fiber optic networks and consequently the demand for testing equipment. The market is also seeing an increase in demand for portable and user-friendly testing solutions to meet the needs of field technicians. This increase in demand is also driving the development of advanced functionalities in testing equipment, such as the integration of AI and machine learning capabilities for automated testing and analysis. Over the forecast period, the market is anticipated to experience consistent growth driven by the continuous expansion of 5G and data center network deployment, alongside the technological advancements that meet the demands of the ever-evolving needs of this industry.
Key Markets & Segments Leading Fiber Optic Test Equipment Industry
The telecommunications sector is the dominant end-user application segment within the fiber optic test equipment industry, accounting for approximately xx% of the market. This is followed by data centers (xx%) and industrial applications (xx%). North America and Asia-Pacific are currently leading regions in terms of market share due to significant investments in fiber optic infrastructure, particularly in 5G deployments and data center expansions.
By Equipment Type:
- Optical Time Domain Reflectometer (OTDR): This segment holds a substantial share of the market due to its critical role in testing the integrity and performance of fiber optic cables.
- Optical Power and Loss Meters: High demand due to routine testing and maintenance requirements across various fiber optic networks.
- Optical Spectrum Analyzers: Growing demand driven by the need for precise spectral analysis to guarantee network performance.
- Optical Light Sources: Essential for numerous tests and maintenance operations within fiber optic networks and systems.
Drivers for Key Segments:
- Telecommunications: Expansion of 5G networks, increasing broadband penetration, and network upgrades.
- Data Centers: Growth of cloud computing, Big Data analytics, and the need for high-capacity data transmission.
- Industries: Adoption of Industrial IoT (IIoT) and automation, requiring robust and reliable communication networks.
The dominance of specific segments and geographic regions is mainly attributed to substantial infrastructure investments, the accelerating adoption of high-speed technologies, and the growing reliance on fiber optics in critical applications.
Fiber Optic Test Equipment Industry Product Developments
Recent product innovations focus on increased speed and functionality, reflecting the industry's rapid advancement in supporting faster and higher-capacity fiber optic networks. The introduction of 800G compatible test modules and the integration of sophisticated analysis tools within test equipment signify a shift toward improved network monitoring and troubleshooting. Companies are actively working on improving the portability and user-friendliness of their products to cater to the needs of field technicians. These advancements deliver competitive advantages by providing quicker, more efficient and accurate testing solutions for complex modern fiber optic networks.
Challenges in the Fiber Optic Test Equipment Industry Market
The Fiber Optic Test Equipment market faces challenges such as maintaining pace with rapid technological advancements, managing supply chain disruptions impacting component availability and costs, and intense competition among established players. These factors exert pressure on pricing and profit margins, demanding continuous innovation and adaptation. Further, regulatory compliance requirements for specific technologies add complexity and cost. The estimated impact on the market's overall growth due to these challenges is approximately xx% reduction in CAGR over the forecast period.
Forces Driving Fiber Optic Test Equipment Industry Growth
Technological advancements in fiber optic technologies are pushing continuous innovation in testing solutions. The expanding global fiber optic infrastructure, driven by the deployment of 5G and increased data center capacity, significantly fuels market demand. Favorable regulatory policies that promote digital infrastructure expansion act as a further catalyst for market growth. The ongoing expansion and continuous refinement of testing tools and techniques will further accelerate growth.
Long-Term Growth Catalysts in the Fiber Optic Test Equipment Industry
Long-term growth is driven by the continual development of higher speed and higher capacity fiber optic technologies. Strategic partnerships among equipment manufacturers and network operators will drive innovation and broader market adoption of these advanced testing solutions. Expansion into new markets, particularly developing economies with growing infrastructure investments, offers significant growth opportunities. Innovation in testing methodologies and software platforms provide lasting positive impacts.
Emerging Opportunities in Fiber Optic Test Equipment Industry
Emerging opportunities include the development of testing solutions for next-generation fiber optic networks beyond 800G, software-defined testing platforms, and integrated solutions combining testing with network monitoring and management tools. Expansion into niche markets, such as submarine cable testing and specialized industrial applications, presents further potential for market growth. The incorporation of AI and machine learning capabilities in testing equipment unlocks opportunities for automated fault diagnosis and enhanced testing efficiency.
Leading Players in the Fiber Optic Test Equipment Industry Sector
- Kingfisher International
- Terahertz Technologies Inc (Trends Networks)
- Anritsu Corporation
- VIAVI Solutions Inc
- AFL Global
- Pelorus Technologies Pvt Ltd
- EXFO Inc
- Yokogawa Electric Corporation
- AMS Technologies A
- Deviser Instruments
- Fluke Networks
- VeEX Inc
Key Milestones in Fiber Optic Test Equipment Industry Industry
- February 2024: Anritsu Corporation and MediaTek validated advanced 3TX technology in MediaTek's M80 5G modem using Anritsu's MT8000A test station. This significantly bolstered the capabilities and market relevance of 5G testing.
- March 2024: VeEX Inc. launched the RXT-6800 800G multiservice test module, setting a new standard for compact and versatile 800G field testing solutions. This highlights the industry's rapid advancements in high-speed testing capabilities.
Strategic Outlook for Fiber Optic Test Equipment Industry Market
The fiber optic test equipment market is poised for continued strong growth, driven by the expansion of high-speed networks and data centers globally. Strategic opportunities lie in developing innovative testing solutions that address the challenges posed by emerging fiber optic technologies and meet the evolving needs of end-users. Focusing on advancements in software and AI integration, as well as expanding into new markets, will be crucial for success in this rapidly evolving landscape.
Fiber Optic Test Equipment Industry Segmentation
-
1. Equipment Type
- 1.1. Optical Light Sources
- 1.2. Optical Power and Loss Meters
- 1.3. Optical Time Domain Reflectometer
- 1.4. Optical Spectrum Analyzers
- 1.5. Remote Fiber Test System
- 1.6. Other Equipment Types
-
2. End-user Application
- 2.1. Telecommunications
- 2.2. Data Centers
- 2.3. Industries
- 2.4. Other End-user Applications
Fiber Optic Test Equipment Industry Segmentation By Geography
-
1. North America
- 1.1. United States
- 1.2. Canada
-
2. Europe
- 2.1. Germany
- 2.2. United Kingdom
- 2.3. France
-
3. Asia
- 3.1. China
- 3.2. Japan
- 3.3. India
- 4. Australia and New Zealand
-
5. Latin America
- 5.1. Brazil
- 5.2. Argentina
- 5.3. Mexico
-
6. Middle East and Africa
- 6.1. United Arab Emirates
- 6.2. South Africa
Fiber Optic Test Equipment Industry REPORT HIGHLIGHTS
| Aspects | Details |
|---|---|
| Study Period | 2019-2033 |
| Base Year | 2024 |
| Estimated Year | 2025 |
| Forecast Period | 2025-2033 |
| Historical Period | 2019-2024 |
| Growth Rate | CAGR of 6.50% from 2019-2033 |
| Segmentation |
|
Table of Contents
- 1. Introduction
- 1.1. Research Scope
- 1.2. Market Segmentation
- 1.3. Research Methodology
- 1.4. Definitions and Assumptions
- 2. Executive Summary
- 2.1. Introduction
- 3. Market Dynamics
- 3.1. Introduction
- 3.2. Market Drivers
- 3.2.1 Increasing Penetration of 5G/LTE Networks and Fixed Broadband Subscription; Growing Adoption of fiber optic networks for power and utility management
- 3.2.2 Security
- 3.2.3 and Communication
- 3.3. Market Restrains
- 3.3.1. High Cost of Testers and Fiber Optic Test Equipment; Lack of Awareness and Technical Knowledge
- 3.4. Market Trends
- 3.4.1. Telecommunications to Witness Significant Growth
- 4. Market Factor Analysis
- 4.1. Porters Five Forces
- 4.2. Supply/Value Chain
- 4.3. PESTEL analysis
- 4.4. Market Entropy
- 4.5. Patent/Trademark Analysis
- 5. Global Fiber Optic Test Equipment Industry Analysis, Insights and Forecast, 2019-2031
- 5.1. Market Analysis, Insights and Forecast - by Equipment Type
- 5.1.1. Optical Light Sources
- 5.1.2. Optical Power and Loss Meters
- 5.1.3. Optical Time Domain Reflectometer
- 5.1.4. Optical Spectrum Analyzers
- 5.1.5. Remote Fiber Test System
- 5.1.6. Other Equipment Types
- 5.2. Market Analysis, Insights and Forecast - by End-user Application
- 5.2.1. Telecommunications
- 5.2.2. Data Centers
- 5.2.3. Industries
- 5.2.4. Other End-user Applications
- 5.3. Market Analysis, Insights and Forecast - by Region
- 5.3.1. North America
- 5.3.2. Europe
- 5.3.3. Asia
- 5.3.4. Australia and New Zealand
- 5.3.5. Latin America
- 5.3.6. Middle East and Africa
- 5.1. Market Analysis, Insights and Forecast - by Equipment Type
- 6. North America Fiber Optic Test Equipment Industry Analysis, Insights and Forecast, 2019-2031
- 6.1. Market Analysis, Insights and Forecast - by Equipment Type
- 6.1.1. Optical Light Sources
- 6.1.2. Optical Power and Loss Meters
- 6.1.3. Optical Time Domain Reflectometer
- 6.1.4. Optical Spectrum Analyzers
- 6.1.5. Remote Fiber Test System
- 6.1.6. Other Equipment Types
- 6.2. Market Analysis, Insights and Forecast - by End-user Application
- 6.2.1. Telecommunications
- 6.2.2. Data Centers
- 6.2.3. Industries
- 6.2.4. Other End-user Applications
- 6.1. Market Analysis, Insights and Forecast - by Equipment Type
- 7. Europe Fiber Optic Test Equipment Industry Analysis, Insights and Forecast, 2019-2031
- 7.1. Market Analysis, Insights and Forecast - by Equipment Type
- 7.1.1. Optical Light Sources
- 7.1.2. Optical Power and Loss Meters
- 7.1.3. Optical Time Domain Reflectometer
- 7.1.4. Optical Spectrum Analyzers
- 7.1.5. Remote Fiber Test System
- 7.1.6. Other Equipment Types
- 7.2. Market Analysis, Insights and Forecast - by End-user Application
- 7.2.1. Telecommunications
- 7.2.2. Data Centers
- 7.2.3. Industries
- 7.2.4. Other End-user Applications
- 7.1. Market Analysis, Insights and Forecast - by Equipment Type
- 8. Asia Fiber Optic Test Equipment Industry Analysis, Insights and Forecast, 2019-2031
- 8.1. Market Analysis, Insights and Forecast - by Equipment Type
- 8.1.1. Optical Light Sources
- 8.1.2. Optical Power and Loss Meters
- 8.1.3. Optical Time Domain Reflectometer
- 8.1.4. Optical Spectrum Analyzers
- 8.1.5. Remote Fiber Test System
- 8.1.6. Other Equipment Types
- 8.2. Market Analysis, Insights and Forecast - by End-user Application
- 8.2.1. Telecommunications
- 8.2.2. Data Centers
- 8.2.3. Industries
- 8.2.4. Other End-user Applications
- 8.1. Market Analysis, Insights and Forecast - by Equipment Type
- 9. Australia and New Zealand Fiber Optic Test Equipment Industry Analysis, Insights and Forecast, 2019-2031
- 9.1. Market Analysis, Insights and Forecast - by Equipment Type
- 9.1.1. Optical Light Sources
- 9.1.2. Optical Power and Loss Meters
- 9.1.3. Optical Time Domain Reflectometer
- 9.1.4. Optical Spectrum Analyzers
- 9.1.5. Remote Fiber Test System
- 9.1.6. Other Equipment Types
- 9.2. Market Analysis, Insights and Forecast - by End-user Application
- 9.2.1. Telecommunications
- 9.2.2. Data Centers
- 9.2.3. Industries
- 9.2.4. Other End-user Applications
- 9.1. Market Analysis, Insights and Forecast - by Equipment Type
- 10. Latin America Fiber Optic Test Equipment Industry Analysis, Insights and Forecast, 2019-2031
- 10.1. Market Analysis, Insights and Forecast - by Equipment Type
- 10.1.1. Optical Light Sources
- 10.1.2. Optical Power and Loss Meters
- 10.1.3. Optical Time Domain Reflectometer
- 10.1.4. Optical Spectrum Analyzers
- 10.1.5. Remote Fiber Test System
- 10.1.6. Other Equipment Types
- 10.2. Market Analysis, Insights and Forecast - by End-user Application
- 10.2.1. Telecommunications
- 10.2.2. Data Centers
- 10.2.3. Industries
- 10.2.4. Other End-user Applications
- 10.1. Market Analysis, Insights and Forecast - by Equipment Type
- 11. Middle East and Africa Fiber Optic Test Equipment Industry Analysis, Insights and Forecast, 2019-2031
- 11.1. Market Analysis, Insights and Forecast - by Equipment Type
- 11.1.1. Optical Light Sources
- 11.1.2. Optical Power and Loss Meters
- 11.1.3. Optical Time Domain Reflectometer
- 11.1.4. Optical Spectrum Analyzers
- 11.1.5. Remote Fiber Test System
- 11.1.6. Other Equipment Types
- 11.2. Market Analysis, Insights and Forecast - by End-user Application
- 11.2.1. Telecommunications
- 11.2.2. Data Centers
- 11.2.3. Industries
- 11.2.4. Other End-user Applications
- 11.1. Market Analysis, Insights and Forecast - by Equipment Type
- 12. North America Fiber Optic Test Equipment Industry Analysis, Insights and Forecast, 2019-2031
- 12.1. Market Analysis, Insights and Forecast - By Country/Sub-region
- 12.1.1 United States
- 12.1.2 Canada
- 13. Europe Fiber Optic Test Equipment Industry Analysis, Insights and Forecast, 2019-2031
- 13.1. Market Analysis, Insights and Forecast - By Country/Sub-region
- 13.1.1 Germany
- 13.1.2 United Kingdom
- 13.1.3 France
- 14. Asia Fiber Optic Test Equipment Industry Analysis, Insights and Forecast, 2019-2031
- 14.1. Market Analysis, Insights and Forecast - By Country/Sub-region
- 14.1.1 China
- 14.1.2 Japan
- 14.1.3 India
- 15. Australia and New Zealand Fiber Optic Test Equipment Industry Analysis, Insights and Forecast, 2019-2031
- 15.1. Market Analysis, Insights and Forecast - By Country/Sub-region
- 15.1.1.
- 16. Latin America Fiber Optic Test Equipment Industry Analysis, Insights and Forecast, 2019-2031
- 16.1. Market Analysis, Insights and Forecast - By Country/Sub-region
- 16.1.1 Brazil
- 16.1.2 Argentina
- 16.1.3 Mexico
- 17. Middle East and Africa Fiber Optic Test Equipment Industry Analysis, Insights and Forecast, 2019-2031
- 17.1. Market Analysis, Insights and Forecast - By Country/Sub-region
- 17.1.1 United Arab Emirates
- 17.1.2 South Africa
- 18. Competitive Analysis
- 18.1. Global Market Share Analysis 2024
- 18.2. Company Profiles
- 18.2.1 Kingfisher International
- 18.2.1.1. Overview
- 18.2.1.2. Products
- 18.2.1.3. SWOT Analysis
- 18.2.1.4. Recent Developments
- 18.2.1.5. Financials (Based on Availability)
- 18.2.2 Terahertz Technologies Inc (Trends Networks)
- 18.2.2.1. Overview
- 18.2.2.2. Products
- 18.2.2.3. SWOT Analysis
- 18.2.2.4. Recent Developments
- 18.2.2.5. Financials (Based on Availability)
- 18.2.3 Anritsu Corporation
- 18.2.3.1. Overview
- 18.2.3.2. Products
- 18.2.3.3. SWOT Analysis
- 18.2.3.4. Recent Developments
- 18.2.3.5. Financials (Based on Availability)
- 18.2.4 VIAVI Solutions Inc
- 18.2.4.1. Overview
- 18.2.4.2. Products
- 18.2.4.3. SWOT Analysis
- 18.2.4.4. Recent Developments
- 18.2.4.5. Financials (Based on Availability)
- 18.2.5 AFL Global
- 18.2.5.1. Overview
- 18.2.5.2. Products
- 18.2.5.3. SWOT Analysis
- 18.2.5.4. Recent Developments
- 18.2.5.5. Financials (Based on Availability)
- 18.2.6 Pelorus Technologies Pvt Ltd
- 18.2.6.1. Overview
- 18.2.6.2. Products
- 18.2.6.3. SWOT Analysis
- 18.2.6.4. Recent Developments
- 18.2.6.5. Financials (Based on Availability)
- 18.2.7 EXFO Inc
- 18.2.7.1. Overview
- 18.2.7.2. Products
- 18.2.7.3. SWOT Analysis
- 18.2.7.4. Recent Developments
- 18.2.7.5. Financials (Based on Availability)
- 18.2.8 Yokogawa Electric Corporation
- 18.2.8.1. Overview
- 18.2.8.2. Products
- 18.2.8.3. SWOT Analysis
- 18.2.8.4. Recent Developments
- 18.2.8.5. Financials (Based on Availability)
- 18.2.9 AMS Technologies A
- 18.2.9.1. Overview
- 18.2.9.2. Products
- 18.2.9.3. SWOT Analysis
- 18.2.9.4. Recent Developments
- 18.2.9.5. Financials (Based on Availability)
- 18.2.10 Deviser Instruments
- 18.2.10.1. Overview
- 18.2.10.2. Products
- 18.2.10.3. SWOT Analysis
- 18.2.10.4. Recent Developments
- 18.2.10.5. Financials (Based on Availability)
- 18.2.11 Fluke Networks
- 18.2.11.1. Overview
- 18.2.11.2. Products
- 18.2.11.3. SWOT Analysis
- 18.2.11.4. Recent Developments
- 18.2.11.5. Financials (Based on Availability)
- 18.2.12 VeEX Inc
- 18.2.12.1. Overview
- 18.2.12.2. Products
- 18.2.12.3. SWOT Analysis
- 18.2.12.4. Recent Developments
- 18.2.12.5. Financials (Based on Availability)
- 18.2.1 Kingfisher International
List of Figures
- Figure 1: Global Fiber Optic Test Equipment Industry Revenue Breakdown (Million, %) by Region 2024 & 2032
- Figure 2: Global Fiber Optic Test Equipment Industry Volume Breakdown (K Unit, %) by Region 2024 & 2032
- Figure 3: North America Fiber Optic Test Equipment Industry Revenue (Million), by Country 2024 & 2032
- Figure 4: North America Fiber Optic Test Equipment Industry Volume (K Unit), by Country 2024 & 2032
- Figure 5: North America Fiber Optic Test Equipment Industry Revenue Share (%), by Country 2024 & 2032
- Figure 6: North America Fiber Optic Test Equipment Industry Volume Share (%), by Country 2024 & 2032
- Figure 7: Europe Fiber Optic Test Equipment Industry Revenue (Million), by Country 2024 & 2032
- Figure 8: Europe Fiber Optic Test Equipment Industry Volume (K Unit), by Country 2024 & 2032
- Figure 9: Europe Fiber Optic Test Equipment Industry Revenue Share (%), by Country 2024 & 2032
- Figure 10: Europe Fiber Optic Test Equipment Industry Volume Share (%), by Country 2024 & 2032
- Figure 11: Asia Fiber Optic Test Equipment Industry Revenue (Million), by Country 2024 & 2032
- Figure 12: Asia Fiber Optic Test Equipment Industry Volume (K Unit), by Country 2024 & 2032
- Figure 13: Asia Fiber Optic Test Equipment Industry Revenue Share (%), by Country 2024 & 2032
- Figure 14: Asia Fiber Optic Test Equipment Industry Volume Share (%), by Country 2024 & 2032
- Figure 15: Australia and New Zealand Fiber Optic Test Equipment Industry Revenue (Million), by Country 2024 & 2032
- Figure 16: Australia and New Zealand Fiber Optic Test Equipment Industry Volume (K Unit), by Country 2024 & 2032
- Figure 17: Australia and New Zealand Fiber Optic Test Equipment Industry Revenue Share (%), by Country 2024 & 2032
- Figure 18: Australia and New Zealand Fiber Optic Test Equipment Industry Volume Share (%), by Country 2024 & 2032
- Figure 19: Latin America Fiber Optic Test Equipment Industry Revenue (Million), by Country 2024 & 2032
- Figure 20: Latin America Fiber Optic Test Equipment Industry Volume (K Unit), by Country 2024 & 2032
- Figure 21: Latin America Fiber Optic Test Equipment Industry Revenue Share (%), by Country 2024 & 2032
- Figure 22: Latin America Fiber Optic Test Equipment Industry Volume Share (%), by Country 2024 & 2032
- Figure 23: Middle East and Africa Fiber Optic Test Equipment Industry Revenue (Million), by Country 2024 & 2032
- Figure 24: Middle East and Africa Fiber Optic Test Equipment Industry Volume (K Unit), by Country 2024 & 2032
- Figure 25: Middle East and Africa Fiber Optic Test Equipment Industry Revenue Share (%), by Country 2024 & 2032
- Figure 26: Middle East and Africa Fiber Optic Test Equipment Industry Volume Share (%), by Country 2024 & 2032
- Figure 27: North America Fiber Optic Test Equipment Industry Revenue (Million), by Equipment Type 2024 & 2032
- Figure 28: North America Fiber Optic Test Equipment Industry Volume (K Unit), by Equipment Type 2024 & 2032
- Figure 29: North America Fiber Optic Test Equipment Industry Revenue Share (%), by Equipment Type 2024 & 2032
- Figure 30: North America Fiber Optic Test Equipment Industry Volume Share (%), by Equipment Type 2024 & 2032
- Figure 31: North America Fiber Optic Test Equipment Industry Revenue (Million), by End-user Application 2024 & 2032
- Figure 32: North America Fiber Optic Test Equipment Industry Volume (K Unit), by End-user Application 2024 & 2032
- Figure 33: North America Fiber Optic Test Equipment Industry Revenue Share (%), by End-user Application 2024 & 2032
- Figure 34: North America Fiber Optic Test Equipment Industry Volume Share (%), by End-user Application 2024 & 2032
- Figure 35: North America Fiber Optic Test Equipment Industry Revenue (Million), by Country 2024 & 2032
- Figure 36: North America Fiber Optic Test Equipment Industry Volume (K Unit), by Country 2024 & 2032
- Figure 37: North America Fiber Optic Test Equipment Industry Revenue Share (%), by Country 2024 & 2032
- Figure 38: North America Fiber Optic Test Equipment Industry Volume Share (%), by Country 2024 & 2032
- Figure 39: Europe Fiber Optic Test Equipment Industry Revenue (Million), by Equipment Type 2024 & 2032
- Figure 40: Europe Fiber Optic Test Equipment Industry Volume (K Unit), by Equipment Type 2024 & 2032
- Figure 41: Europe Fiber Optic Test Equipment Industry Revenue Share (%), by Equipment Type 2024 & 2032
- Figure 42: Europe Fiber Optic Test Equipment Industry Volume Share (%), by Equipment Type 2024 & 2032
- Figure 43: Europe Fiber Optic Test Equipment Industry Revenue (Million), by End-user Application 2024 & 2032
- Figure 44: Europe Fiber Optic Test Equipment Industry Volume (K Unit), by End-user Application 2024 & 2032
- Figure 45: Europe Fiber Optic Test Equipment Industry Revenue Share (%), by End-user Application 2024 & 2032
- Figure 46: Europe Fiber Optic Test Equipment Industry Volume Share (%), by End-user Application 2024 & 2032
- Figure 47: Europe Fiber Optic Test Equipment Industry Revenue (Million), by Country 2024 & 2032
- Figure 48: Europe Fiber Optic Test Equipment Industry Volume (K Unit), by Country 2024 & 2032
- Figure 49: Europe Fiber Optic Test Equipment Industry Revenue Share (%), by Country 2024 & 2032
- Figure 50: Europe Fiber Optic Test Equipment Industry Volume Share (%), by Country 2024 & 2032
- Figure 51: Asia Fiber Optic Test Equipment Industry Revenue (Million), by Equipment Type 2024 & 2032
- Figure 52: Asia Fiber Optic Test Equipment Industry Volume (K Unit), by Equipment Type 2024 & 2032
- Figure 53: Asia Fiber Optic Test Equipment Industry Revenue Share (%), by Equipment Type 2024 & 2032
- Figure 54: Asia Fiber Optic Test Equipment Industry Volume Share (%), by Equipment Type 2024 & 2032
- Figure 55: Asia Fiber Optic Test Equipment Industry Revenue (Million), by End-user Application 2024 & 2032
- Figure 56: Asia Fiber Optic Test Equipment Industry Volume (K Unit), by End-user Application 2024 & 2032
- Figure 57: Asia Fiber Optic Test Equipment Industry Revenue Share (%), by End-user Application 2024 & 2032
- Figure 58: Asia Fiber Optic Test Equipment Industry Volume Share (%), by End-user Application 2024 & 2032
- Figure 59: Asia Fiber Optic Test Equipment Industry Revenue (Million), by Country 2024 & 2032
- Figure 60: Asia Fiber Optic Test Equipment Industry Volume (K Unit), by Country 2024 & 2032
- Figure 61: Asia Fiber Optic Test Equipment Industry Revenue Share (%), by Country 2024 & 2032
- Figure 62: Asia Fiber Optic Test Equipment Industry Volume Share (%), by Country 2024 & 2032
- Figure 63: Australia and New Zealand Fiber Optic Test Equipment Industry Revenue (Million), by Equipment Type 2024 & 2032
- Figure 64: Australia and New Zealand Fiber Optic Test Equipment Industry Volume (K Unit), by Equipment Type 2024 & 2032
- Figure 65: Australia and New Zealand Fiber Optic Test Equipment Industry Revenue Share (%), by Equipment Type 2024 & 2032
- Figure 66: Australia and New Zealand Fiber Optic Test Equipment Industry Volume Share (%), by Equipment Type 2024 & 2032
- Figure 67: Australia and New Zealand Fiber Optic Test Equipment Industry Revenue (Million), by End-user Application 2024 & 2032
- Figure 68: Australia and New Zealand Fiber Optic Test Equipment Industry Volume (K Unit), by End-user Application 2024 & 2032
- Figure 69: Australia and New Zealand Fiber Optic Test Equipment Industry Revenue Share (%), by End-user Application 2024 & 2032
- Figure 70: Australia and New Zealand Fiber Optic Test Equipment Industry Volume Share (%), by End-user Application 2024 & 2032
- Figure 71: Australia and New Zealand Fiber Optic Test Equipment Industry Revenue (Million), by Country 2024 & 2032
- Figure 72: Australia and New Zealand Fiber Optic Test Equipment Industry Volume (K Unit), by Country 2024 & 2032
- Figure 73: Australia and New Zealand Fiber Optic Test Equipment Industry Revenue Share (%), by Country 2024 & 2032
- Figure 74: Australia and New Zealand Fiber Optic Test Equipment Industry Volume Share (%), by Country 2024 & 2032
- Figure 75: Latin America Fiber Optic Test Equipment Industry Revenue (Million), by Equipment Type 2024 & 2032
- Figure 76: Latin America Fiber Optic Test Equipment Industry Volume (K Unit), by Equipment Type 2024 & 2032
- Figure 77: Latin America Fiber Optic Test Equipment Industry Revenue Share (%), by Equipment Type 2024 & 2032
- Figure 78: Latin America Fiber Optic Test Equipment Industry Volume Share (%), by Equipment Type 2024 & 2032
- Figure 79: Latin America Fiber Optic Test Equipment Industry Revenue (Million), by End-user Application 2024 & 2032
- Figure 80: Latin America Fiber Optic Test Equipment Industry Volume (K Unit), by End-user Application 2024 & 2032
- Figure 81: Latin America Fiber Optic Test Equipment Industry Revenue Share (%), by End-user Application 2024 & 2032
- Figure 82: Latin America Fiber Optic Test Equipment Industry Volume Share (%), by End-user Application 2024 & 2032
- Figure 83: Latin America Fiber Optic Test Equipment Industry Revenue (Million), by Country 2024 & 2032
- Figure 84: Latin America Fiber Optic Test Equipment Industry Volume (K Unit), by Country 2024 & 2032
- Figure 85: Latin America Fiber Optic Test Equipment Industry Revenue Share (%), by Country 2024 & 2032
- Figure 86: Latin America Fiber Optic Test Equipment Industry Volume Share (%), by Country 2024 & 2032
- Figure 87: Middle East and Africa Fiber Optic Test Equipment Industry Revenue (Million), by Equipment Type 2024 & 2032
- Figure 88: Middle East and Africa Fiber Optic Test Equipment Industry Volume (K Unit), by Equipment Type 2024 & 2032
- Figure 89: Middle East and Africa Fiber Optic Test Equipment Industry Revenue Share (%), by Equipment Type 2024 & 2032
- Figure 90: Middle East and Africa Fiber Optic Test Equipment Industry Volume Share (%), by Equipment Type 2024 & 2032
- Figure 91: Middle East and Africa Fiber Optic Test Equipment Industry Revenue (Million), by End-user Application 2024 & 2032
- Figure 92: Middle East and Africa Fiber Optic Test Equipment Industry Volume (K Unit), by End-user Application 2024 & 2032
- Figure 93: Middle East and Africa Fiber Optic Test Equipment Industry Revenue Share (%), by End-user Application 2024 & 2032
- Figure 94: Middle East and Africa Fiber Optic Test Equipment Industry Volume Share (%), by End-user Application 2024 & 2032
- Figure 95: Middle East and Africa Fiber Optic Test Equipment Industry Revenue (Million), by Country 2024 & 2032
- Figure 96: Middle East and Africa Fiber Optic Test Equipment Industry Volume (K Unit), by Country 2024 & 2032
- Figure 97: Middle East and Africa Fiber Optic Test Equipment Industry Revenue Share (%), by Country 2024 & 2032
- Figure 98: Middle East and Africa Fiber Optic Test Equipment Industry Volume Share (%), by Country 2024 & 2032
List of Tables
- Table 1: Global Fiber Optic Test Equipment Industry Revenue Million Forecast, by Region 2019 & 2032
- Table 2: Global Fiber Optic Test Equipment Industry Volume K Unit Forecast, by Region 2019 & 2032
- Table 3: Global Fiber Optic Test Equipment Industry Revenue Million Forecast, by Equipment Type 2019 & 2032
- Table 4: Global Fiber Optic Test Equipment Industry Volume K Unit Forecast, by Equipment Type 2019 & 2032
- Table 5: Global Fiber Optic Test Equipment Industry Revenue Million Forecast, by End-user Application 2019 & 2032
- Table 6: Global Fiber Optic Test Equipment Industry Volume K Unit Forecast, by End-user Application 2019 & 2032
- Table 7: Global Fiber Optic Test Equipment Industry Revenue Million Forecast, by Region 2019 & 2032
- Table 8: Global Fiber Optic Test Equipment Industry Volume K Unit Forecast, by Region 2019 & 2032
- Table 9: Global Fiber Optic Test Equipment Industry Revenue Million Forecast, by Country 2019 & 2032
- Table 10: Global Fiber Optic Test Equipment Industry Volume K Unit Forecast, by Country 2019 & 2032
- Table 11: United States Fiber Optic Test Equipment Industry Revenue (Million) Forecast, by Application 2019 & 2032
- Table 12: United States Fiber Optic Test Equipment Industry Volume (K Unit) Forecast, by Application 2019 & 2032
- Table 13: Canada Fiber Optic Test Equipment Industry Revenue (Million) Forecast, by Application 2019 & 2032
- Table 14: Canada Fiber Optic Test Equipment Industry Volume (K Unit) Forecast, by Application 2019 & 2032
- Table 15: Global Fiber Optic Test Equipment Industry Revenue Million Forecast, by Country 2019 & 2032
- Table 16: Global Fiber Optic Test Equipment Industry Volume K Unit Forecast, by Country 2019 & 2032
- Table 17: Germany Fiber Optic Test Equipment Industry Revenue (Million) Forecast, by Application 2019 & 2032
- Table 18: Germany Fiber Optic Test Equipment Industry Volume (K Unit) Forecast, by Application 2019 & 2032
- Table 19: United Kingdom Fiber Optic Test Equipment Industry Revenue (Million) Forecast, by Application 2019 & 2032
- Table 20: United Kingdom Fiber Optic Test Equipment Industry Volume (K Unit) Forecast, by Application 2019 & 2032
- Table 21: France Fiber Optic Test Equipment Industry Revenue (Million) Forecast, by Application 2019 & 2032
- Table 22: France Fiber Optic Test Equipment Industry Volume (K Unit) Forecast, by Application 2019 & 2032
- Table 23: Global Fiber Optic Test Equipment Industry Revenue Million Forecast, by Country 2019 & 2032
- Table 24: Global Fiber Optic Test Equipment Industry Volume K Unit Forecast, by Country 2019 & 2032
- Table 25: China Fiber Optic Test Equipment Industry Revenue (Million) Forecast, by Application 2019 & 2032
- Table 26: China Fiber Optic Test Equipment Industry Volume (K Unit) Forecast, by Application 2019 & 2032
- Table 27: Japan Fiber Optic Test Equipment Industry Revenue (Million) Forecast, by Application 2019 & 2032
- Table 28: Japan Fiber Optic Test Equipment Industry Volume (K Unit) Forecast, by Application 2019 & 2032
- Table 29: India Fiber Optic Test Equipment Industry Revenue (Million) Forecast, by Application 2019 & 2032
- Table 30: India Fiber Optic Test Equipment Industry Volume (K Unit) Forecast, by Application 2019 & 2032
- Table 31: Global Fiber Optic Test Equipment Industry Revenue Million Forecast, by Country 2019 & 2032
- Table 32: Global Fiber Optic Test Equipment Industry Volume K Unit Forecast, by Country 2019 & 2032
- Table 33: Fiber Optic Test Equipment Industry Revenue (Million) Forecast, by Application 2019 & 2032
- Table 34: Fiber Optic Test Equipment Industry Volume (K Unit) Forecast, by Application 2019 & 2032
- Table 35: Global Fiber Optic Test Equipment Industry Revenue Million Forecast, by Country 2019 & 2032
- Table 36: Global Fiber Optic Test Equipment Industry Volume K Unit Forecast, by Country 2019 & 2032
- Table 37: Brazil Fiber Optic Test Equipment Industry Revenue (Million) Forecast, by Application 2019 & 2032
- Table 38: Brazil Fiber Optic Test Equipment Industry Volume (K Unit) Forecast, by Application 2019 & 2032
- Table 39: Argentina Fiber Optic Test Equipment Industry Revenue (Million) Forecast, by Application 2019 & 2032
- Table 40: Argentina Fiber Optic Test Equipment Industry Volume (K Unit) Forecast, by Application 2019 & 2032
- Table 41: Mexico Fiber Optic Test Equipment Industry Revenue (Million) Forecast, by Application 2019 & 2032
- Table 42: Mexico Fiber Optic Test Equipment Industry Volume (K Unit) Forecast, by Application 2019 & 2032
- Table 43: Global Fiber Optic Test Equipment Industry Revenue Million Forecast, by Country 2019 & 2032
- Table 44: Global Fiber Optic Test Equipment Industry Volume K Unit Forecast, by Country 2019 & 2032
- Table 45: United Arab Emirates Fiber Optic Test Equipment Industry Revenue (Million) Forecast, by Application 2019 & 2032
- Table 46: United Arab Emirates Fiber Optic Test Equipment Industry Volume (K Unit) Forecast, by Application 2019 & 2032
- Table 47: South Africa Fiber Optic Test Equipment Industry Revenue (Million) Forecast, by Application 2019 & 2032
- Table 48: South Africa Fiber Optic Test Equipment Industry Volume (K Unit) Forecast, by Application 2019 & 2032
- Table 49: Global Fiber Optic Test Equipment Industry Revenue Million Forecast, by Equipment Type 2019 & 2032
- Table 50: Global Fiber Optic Test Equipment Industry Volume K Unit Forecast, by Equipment Type 2019 & 2032
- Table 51: Global Fiber Optic Test Equipment Industry Revenue Million Forecast, by End-user Application 2019 & 2032
- Table 52: Global Fiber Optic Test Equipment Industry Volume K Unit Forecast, by End-user Application 2019 & 2032
- Table 53: Global Fiber Optic Test Equipment Industry Revenue Million Forecast, by Country 2019 & 2032
- Table 54: Global Fiber Optic Test Equipment Industry Volume K Unit Forecast, by Country 2019 & 2032
- Table 55: United States Fiber Optic Test Equipment Industry Revenue (Million) Forecast, by Application 2019 & 2032
- Table 56: United States Fiber Optic Test Equipment Industry Volume (K Unit) Forecast, by Application 2019 & 2032
- Table 57: Canada Fiber Optic Test Equipment Industry Revenue (Million) Forecast, by Application 2019 & 2032
- Table 58: Canada Fiber Optic Test Equipment Industry Volume (K Unit) Forecast, by Application 2019 & 2032
- Table 59: Global Fiber Optic Test Equipment Industry Revenue Million Forecast, by Equipment Type 2019 & 2032
- Table 60: Global Fiber Optic Test Equipment Industry Volume K Unit Forecast, by Equipment Type 2019 & 2032
- Table 61: Global Fiber Optic Test Equipment Industry Revenue Million Forecast, by End-user Application 2019 & 2032
- Table 62: Global Fiber Optic Test Equipment Industry Volume K Unit Forecast, by End-user Application 2019 & 2032
- Table 63: Global Fiber Optic Test Equipment Industry Revenue Million Forecast, by Country 2019 & 2032
- Table 64: Global Fiber Optic Test Equipment Industry Volume K Unit Forecast, by Country 2019 & 2032
- Table 65: Germany Fiber Optic Test Equipment Industry Revenue (Million) Forecast, by Application 2019 & 2032
- Table 66: Germany Fiber Optic Test Equipment Industry Volume (K Unit) Forecast, by Application 2019 & 2032
- Table 67: United Kingdom Fiber Optic Test Equipment Industry Revenue (Million) Forecast, by Application 2019 & 2032
- Table 68: United Kingdom Fiber Optic Test Equipment Industry Volume (K Unit) Forecast, by Application 2019 & 2032
- Table 69: France Fiber Optic Test Equipment Industry Revenue (Million) Forecast, by Application 2019 & 2032
- Table 70: France Fiber Optic Test Equipment Industry Volume (K Unit) Forecast, by Application 2019 & 2032
- Table 71: Global Fiber Optic Test Equipment Industry Revenue Million Forecast, by Equipment Type 2019 & 2032
- Table 72: Global Fiber Optic Test Equipment Industry Volume K Unit Forecast, by Equipment Type 2019 & 2032
- Table 73: Global Fiber Optic Test Equipment Industry Revenue Million Forecast, by End-user Application 2019 & 2032
- Table 74: Global Fiber Optic Test Equipment Industry Volume K Unit Forecast, by End-user Application 2019 & 2032
- Table 75: Global Fiber Optic Test Equipment Industry Revenue Million Forecast, by Country 2019 & 2032
- Table 76: Global Fiber Optic Test Equipment Industry Volume K Unit Forecast, by Country 2019 & 2032
- Table 77: China Fiber Optic Test Equipment Industry Revenue (Million) Forecast, by Application 2019 & 2032
- Table 78: China Fiber Optic Test Equipment Industry Volume (K Unit) Forecast, by Application 2019 & 2032
- Table 79: Japan Fiber Optic Test Equipment Industry Revenue (Million) Forecast, by Application 2019 & 2032
- Table 80: Japan Fiber Optic Test Equipment Industry Volume (K Unit) Forecast, by Application 2019 & 2032
- Table 81: India Fiber Optic Test Equipment Industry Revenue (Million) Forecast, by Application 2019 & 2032
- Table 82: India Fiber Optic Test Equipment Industry Volume (K Unit) Forecast, by Application 2019 & 2032
- Table 83: Global Fiber Optic Test Equipment Industry Revenue Million Forecast, by Equipment Type 2019 & 2032
- Table 84: Global Fiber Optic Test Equipment Industry Volume K Unit Forecast, by Equipment Type 2019 & 2032
- Table 85: Global Fiber Optic Test Equipment Industry Revenue Million Forecast, by End-user Application 2019 & 2032
- Table 86: Global Fiber Optic Test Equipment Industry Volume K Unit Forecast, by End-user Application 2019 & 2032
- Table 87: Global Fiber Optic Test Equipment Industry Revenue Million Forecast, by Country 2019 & 2032
- Table 88: Global Fiber Optic Test Equipment Industry Volume K Unit Forecast, by Country 2019 & 2032
- Table 89: Global Fiber Optic Test Equipment Industry Revenue Million Forecast, by Equipment Type 2019 & 2032
- Table 90: Global Fiber Optic Test Equipment Industry Volume K Unit Forecast, by Equipment Type 2019 & 2032
- Table 91: Global Fiber Optic Test Equipment Industry Revenue Million Forecast, by End-user Application 2019 & 2032
- Table 92: Global Fiber Optic Test Equipment Industry Volume K Unit Forecast, by End-user Application 2019 & 2032
- Table 93: Global Fiber Optic Test Equipment Industry Revenue Million Forecast, by Country 2019 & 2032
- Table 94: Global Fiber Optic Test Equipment Industry Volume K Unit Forecast, by Country 2019 & 2032
- Table 95: Brazil Fiber Optic Test Equipment Industry Revenue (Million) Forecast, by Application 2019 & 2032
- Table 96: Brazil Fiber Optic Test Equipment Industry Volume (K Unit) Forecast, by Application 2019 & 2032
- Table 97: Argentina Fiber Optic Test Equipment Industry Revenue (Million) Forecast, by Application 2019 & 2032
- Table 98: Argentina Fiber Optic Test Equipment Industry Volume (K Unit) Forecast, by Application 2019 & 2032
- Table 99: Mexico Fiber Optic Test Equipment Industry Revenue (Million) Forecast, by Application 2019 & 2032
- Table 100: Mexico Fiber Optic Test Equipment Industry Volume (K Unit) Forecast, by Application 2019 & 2032
- Table 101: Global Fiber Optic Test Equipment Industry Revenue Million Forecast, by Equipment Type 2019 & 2032
- Table 102: Global Fiber Optic Test Equipment Industry Volume K Unit Forecast, by Equipment Type 2019 & 2032
- Table 103: Global Fiber Optic Test Equipment Industry Revenue Million Forecast, by End-user Application 2019 & 2032
- Table 104: Global Fiber Optic Test Equipment Industry Volume K Unit Forecast, by End-user Application 2019 & 2032
- Table 105: Global Fiber Optic Test Equipment Industry Revenue Million Forecast, by Country 2019 & 2032
- Table 106: Global Fiber Optic Test Equipment Industry Volume K Unit Forecast, by Country 2019 & 2032
- Table 107: United Arab Emirates Fiber Optic Test Equipment Industry Revenue (Million) Forecast, by Application 2019 & 2032
- Table 108: United Arab Emirates Fiber Optic Test Equipment Industry Volume (K Unit) Forecast, by Application 2019 & 2032
- Table 109: South Africa Fiber Optic Test Equipment Industry Revenue (Million) Forecast, by Application 2019 & 2032
- Table 110: South Africa Fiber Optic Test Equipment Industry Volume (K Unit) Forecast, by Application 2019 & 2032
Frequently Asked Questions
1. What is the projected Compound Annual Growth Rate (CAGR) of the Fiber Optic Test Equipment Industry?
The projected CAGR is approximately 6.50%.
2. Which companies are prominent players in the Fiber Optic Test Equipment Industry?
Key companies in the market include Kingfisher International, Terahertz Technologies Inc (Trends Networks), Anritsu Corporation, VIAVI Solutions Inc, AFL Global, Pelorus Technologies Pvt Ltd, EXFO Inc, Yokogawa Electric Corporation, AMS Technologies A, Deviser Instruments, Fluke Networks, VeEX Inc.
3. What are the main segments of the Fiber Optic Test Equipment Industry?
The market segments include Equipment Type, End-user Application.
4. Can you provide details about the market size?
The market size is estimated to be USD 1.10 Million as of 2022.
5. What are some drivers contributing to market growth?
Increasing Penetration of 5G/LTE Networks and Fixed Broadband Subscription; Growing Adoption of fiber optic networks for power and utility management. Security. and Communication.
6. What are the notable trends driving market growth?
Telecommunications to Witness Significant Growth.
7. Are there any restraints impacting market growth?
High Cost of Testers and Fiber Optic Test Equipment; Lack of Awareness and Technical Knowledge.
8. Can you provide examples of recent developments in the market?
March 2024 - VeEX Inc. unveiled the RXT- 6800 Advanced 800G Multiservice test module. Based on the RXT-6400400G high-speed test module, the RXT6800 provides the flexibility to test existing interfaces up to a maximum of 800G. This new module is the industry's smallest, most versatile, and most portable 800G field test solution.
9. What pricing options are available for accessing the report?
Pricing options include single-user, multi-user, and enterprise licenses priced at USD 4750, USD 5250, and USD 8750 respectively.
10. Is the market size provided in terms of value or volume?
The market size is provided in terms of value, measured in Million and volume, measured in K Unit.
11. Are there any specific market keywords associated with the report?
Yes, the market keyword associated with the report is "Fiber Optic Test Equipment Industry," which aids in identifying and referencing the specific market segment covered.
12. How do I determine which pricing option suits my needs best?
The pricing options vary based on user requirements and access needs. Individual users may opt for single-user licenses, while businesses requiring broader access may choose multi-user or enterprise licenses for cost-effective access to the report.
13. Are there any additional resources or data provided in the Fiber Optic Test Equipment Industry report?
While the report offers comprehensive insights, it's advisable to review the specific contents or supplementary materials provided to ascertain if additional resources or data are available.
14. How can I stay updated on further developments or reports in the Fiber Optic Test Equipment Industry?
To stay informed about further developments, trends, and reports in the Fiber Optic Test Equipment Industry, consider subscribing to industry newsletters, following relevant companies and organizations, or regularly checking reputable industry news sources and publications.
Methodology
Step 1 - Identification of Relevant Samples Size from Population Database


Step 2 - Approaches for Defining Global Market Size (Value, Volume* & Price*)

Note*: In applicable scenarios
Step 3 - Data Sources
Primary Research
- Web Analytics
- Survey Reports
- Research Institute
- Latest Research Reports
- Opinion Leaders
Secondary Research
- Annual Reports
- White Paper
- Latest Press Release
- Industry Association
- Paid Database
- Investor Presentations

Step 4 - Data Triangulation
Involves using different sources of information in order to increase the validity of a study
These sources are likely to be stakeholders in a program - participants, other researchers, program staff, other community members, and so on.
Then we put all data in single framework & apply various statistical tools to find out the dynamic on the market.
During the analysis stage, feedback from the stakeholder groups would be compared to determine areas of agreement as well as areas of divergence
