

Key Insights
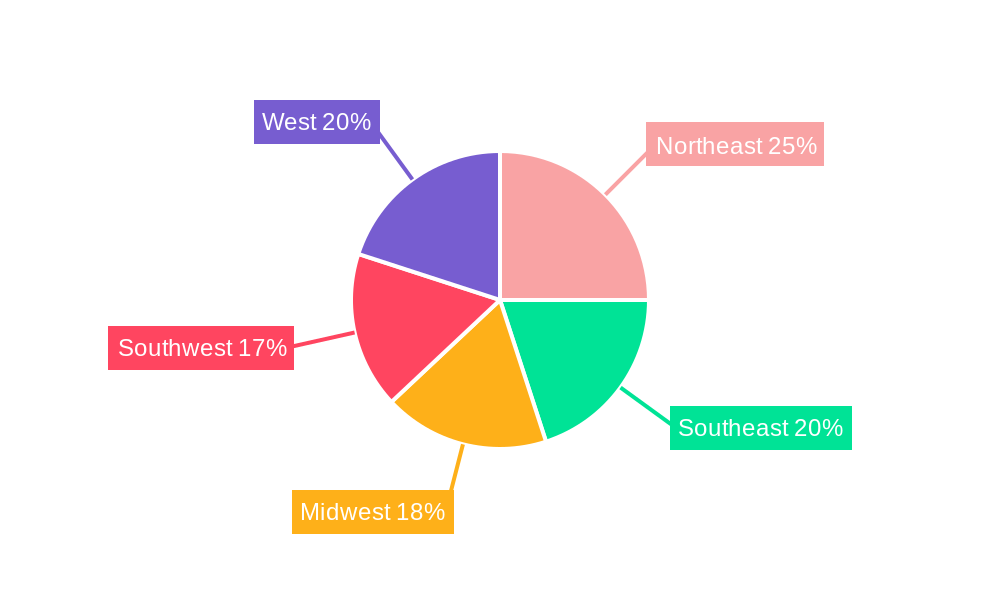
The US wireless telecom tower industry, currently experiencing robust growth, is projected to maintain a significant upward trajectory. Driven by increasing data consumption fueled by the proliferation of 5G technology and the rising demand for improved network coverage and capacity, the market is poised for expansion. The industry's segmentation reveals a diverse landscape, with renewable energy sources increasingly powering towers, reflecting a growing focus on sustainability. Rooftop installations continue to be a popular choice for deployment, offering cost-effective solutions, especially in urban areas. Meanwhile, ground-based installations, crucial for broader coverage and higher power output, remain a vital component of the infrastructure. Ownership structures are varied, encompassing operator-owned, joint venture, private-owned, and MNO captive models, each contributing to the overall market dynamism. Competition among major players like SBA Communications Corporation, Crown Castle International Corp, and American Tower Corporation (a major player not explicitly listed but highly relevant to the US market) drives innovation and efficiency. Growth is expected to be particularly strong in regions with high population density and expanding 5G deployments, such as the Northeast and West Coast regions of the United States. However, regulatory hurdles and the considerable capital investment required for tower construction and maintenance present ongoing challenges.
The forecast period of 2025-2033 anticipates a substantial increase in market value, driven by ongoing 5G network expansion and the increasing demand for reliable wireless connectivity. The industry's evolution is intertwined with technological advancements, with innovations in tower design, materials, and energy efficiency further shaping its trajectory. While factors such as land acquisition costs and permitting processes can impede growth, the overarching trend points to a continued expansion of the US wireless telecom tower market. The diversification across fuel types, installation methods, and ownership structures suggests a resilient and adaptable industry capable of navigating the complexities of the evolving technological and regulatory landscape. Continued investment in infrastructure upgrades and network modernization, particularly in underserved areas, will be a major catalyst for future growth.
US Wireless Telecom Tower Industry: Market Report 2019-2033
This comprehensive report provides a detailed analysis of the US Wireless Telecom Tower Industry, covering market dynamics, key segments, leading players, and future growth prospects. The report uses data from 2019-2024 (historical period), with the base year being 2025 and forecasts extending to 2033. This in-depth analysis will be invaluable for industry stakeholders, investors, and anyone seeking to understand this dynamic market. The US$ xx Million market is poised for significant growth, driven by 5G deployment and increasing data consumption.
US Wireless Telecom Tower Industry Market Concentration & Dynamics
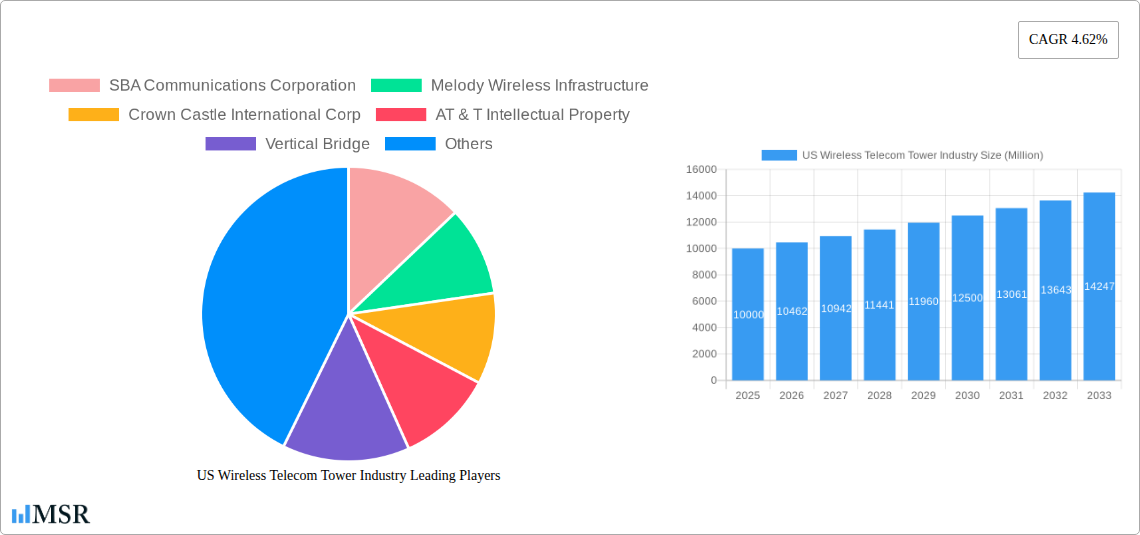
The US wireless telecom tower industry exhibits moderate concentration, with a few dominant players holding significant market share. SBA Communications Corporation, Crown Castle International Corp, and American Tower Corporation (ATC) are key players, controlling a combined xx% of the market in 2025. However, the presence of numerous smaller players, including Vertical Bridge, Tillman Infrastructure LLC, and Insite Wireless Group, ensures a competitive landscape. The market is characterized by continuous mergers and acquisitions (M&A) activity, with xx major deals recorded between 2019 and 2024. These activities shape market consolidation and drive innovation.
- Market Share (2025): SBA Communications: xx%; Crown Castle International Corp: xx%; American Tower Corporation: xx%; Others: xx%
- M&A Activity (2019-2024): xx deals, primarily focused on expanding network infrastructure and consolidating market share.
- Innovation Ecosystems: Significant investment in 5G technology and small cell deployment is driving innovation in tower design, construction, and management.
- Regulatory Frameworks: FCC regulations regarding tower siting, environmental impact assessments, and spectrum allocation heavily influence market dynamics.
- Substitute Products: Fiber optic cables and alternative communication technologies offer some level of substitution, though tower infrastructure remains crucial for widespread wireless coverage.
- End-User Trends: Increasing mobile data consumption and the proliferation of IoT devices fuel demand for additional tower capacity.
US Wireless Telecom Tower Industry Industry Insights & Trends
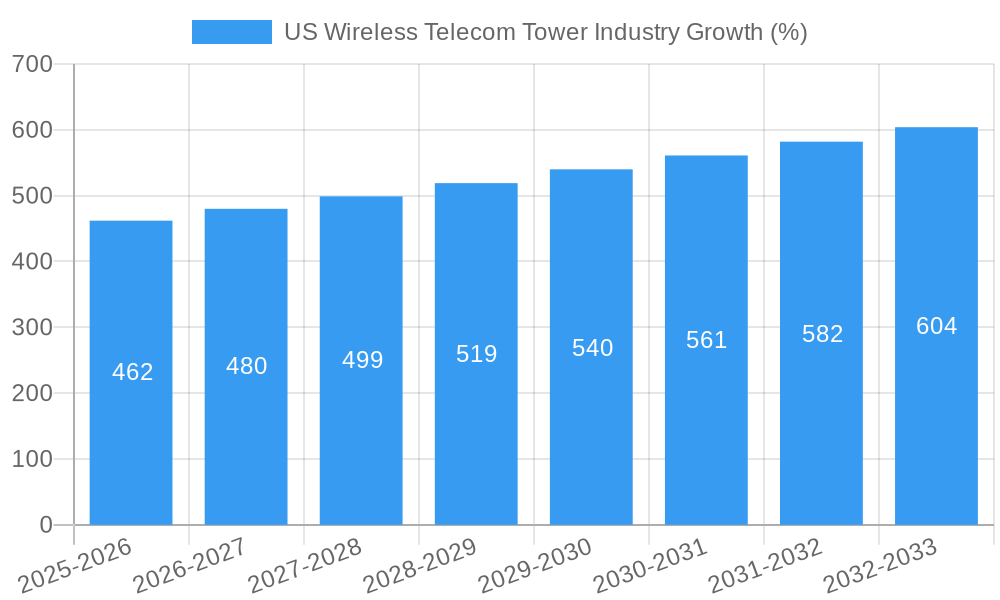
The US wireless telecom tower market is experiencing robust growth, driven by the expanding 5G network deployment. The market size reached US$ xx Million in 2025, and is projected to expand at a Compound Annual Growth Rate (CAGR) of xx% from 2025 to 2033, reaching US$ xx Million by 2033. This growth is fueled by the rising adoption of 5G technology requiring denser networks, the increasing demand for high-speed data, and the expanding IoT market. Technological advancements, such as the use of AI and machine learning for predictive maintenance and network optimization, are further transforming the industry. Consumer demand for seamless connectivity and reliable mobile services is a key driver for this growth.
Key Markets & Segments Leading US Wireless Telecom Tower Industry
The US wireless telecom tower industry is geographically diverse, with significant activity across all regions. However, densely populated areas and major metropolitan centers demonstrate higher concentration of towers and deployment activity.
By Fuel Type: The industry is gradually shifting towards renewable energy sources for powering towers, driven by environmental concerns and cost savings. However, non-renewable sources currently dominate.
- Renewable Energy: Growth is driven by regulatory incentives and corporate sustainability initiatives. Expected market share in 2025: xx%.
- Non-Renewable Energy: Remains the dominant source due to established infrastructure and cost-effectiveness. Expected market share in 2025: xx%.
By Installation: Ground-based installations remain the most prevalent, but rooftop installations are gaining traction in urban areas for improved coverage and reduced land acquisition challenges.
- Rooftop: Driven by land scarcity and urban densification. Expected market share in 2025: xx%.
- Ground-based: The dominant installation type due to space availability and capacity. Expected market share in 2025: xx%.
By Ownership: The market is characterized by a mix of ownership structures.
- Operator-owned: MNOs (Mobile Network Operators) such as AT&T and Verizon own a significant portion of towers to maintain control over network infrastructure. Expected market share in 2025: xx%.
- Joint Venture: Joint ventures between tower companies and MNOs are common, enabling shared resources and risk mitigation. Expected market share in 2025: xx%.
- Private-owned: Independent tower companies like SBA Communications and Crown Castle dominate this segment, providing leasing services to MNOs. Expected market share in 2025: xx%.
- MNO Captive: Towers directly owned and operated by MNOs for their exclusive use. Expected market share in 2025: xx%.
US Wireless Telecom Tower Industry Product Developments
Recent innovations focus on enhancing tower capacity, improving energy efficiency, and streamlining deployment. Smart towers, incorporating advanced technologies like AI for predictive maintenance and optimized network management, are gaining prominence. These advancements improve network performance, reduce operational costs, and enhance network resilience. The development of smaller, more efficient cells and the integration of multiple technologies on a single tower contribute to improved spectrum utilization and overall network optimization.
Challenges in the US Wireless Telecom Tower Industry Market
The industry faces challenges such as securing permits and navigating complex regulatory approvals for new tower installations. Supply chain disruptions and rising material costs impact construction timelines and profitability. Intense competition among tower companies and the pressure to provide cost-effective solutions pose further challenges. These factors can delay projects and increase operational costs. The cost of land acquisition for ground-based towers can be significant, especially in urban areas.
Forces Driving US Wireless Telecom Tower Industry Growth
The primary drivers for growth are the expansion of 5G networks, the increasing demand for mobile data, and the proliferation of IoT devices. Government initiatives promoting digital infrastructure and investments in broadband expansion further fuel market growth. Technological advancements like smart towers and small cell deployments are also key growth catalysts. The growing need for reliable and high-speed internet access across rural and urban areas presents significant opportunities.
Long-Term Growth Catalysts in the US Wireless Telecom Tower Industry
Long-term growth is driven by ongoing 5G network buildouts and the adoption of advanced technologies like private 5G networks for enterprise use. Strategic partnerships and M&A activities are instrumental in driving expansion and consolidation. The growing demand for data centers co-located on tower sites to reduce latency and improve network efficiency presents further opportunities.
Emerging Opportunities in US Wireless Telecom Tower Industry
Emerging opportunities include the integration of edge computing capabilities within towers, creating a distributed network architecture for faster data processing. The increasing demand for private 5G networks presents a significant growth opportunity, with industries like manufacturing and healthcare increasingly adopting this technology. The development of sustainable and environmentally friendly tower solutions is also gaining momentum.
Leading Players in the US Wireless Telecom Tower Industry Sector
- SBA Communications Corporation
- Melody Wireless Infrastructure
- Crown Castle International Corp
- AT&T Intellectual Property
- Vertical Bridge
- Helios Towers plc
- Tillman Infrastructure LLC
- United States Cellular Co
- ATC IP LLC
- Insite Wireless Group
- BNSF Railroad
Key Milestones in US Wireless Telecom Tower Industry Industry
- January 2022: T-Mobile US, Inc. and Crown Castle International Corp. announce a 12-year collaboration to expand T-Mobile's 5G network access. This significantly boosted Crown Castle's growth and strengthened T-Mobile's 5G infrastructure.
- January 2022: American Tower Corporation acquires CoreSite Realty Corporation, expanding its data center capabilities and creating opportunities for growth in the cloud computing sector. This acquisition highlighted the convergence of tower and data center infrastructure.
Strategic Outlook for US Wireless Telecom Tower Industry Market
The US wireless telecom tower industry is poised for sustained growth, driven by 5G rollout, increasing data demand, and technological advancements. Strategic partnerships and investments in innovative technologies like smart towers and edge computing will be crucial for future success. The industry's long-term growth will be shaped by the effective management of regulatory hurdles, supply chain dynamics, and competitive pressures. Companies focused on sustainable practices and efficient network operations are best positioned for long-term success.
US Wireless Telecom Tower Industry Segmentation
-
1. Fuel Type
- 1.1. Renewable
- 1.2. Non-renewable
-
2. Installation
- 2.1. Rooftop
- 2.2. Ground-based
-
3. Ownership
- 3.1. Operator-owned
- 3.2. Joint Venture
- 3.3. Private-owned
- 3.4. MNO Captive
US Wireless Telecom Tower Industry Segmentation By Geography
-
1. North America
- 1.1. United States
- 1.2. Canada
- 1.3. Mexico
-
2. South America
- 2.1. Brazil
- 2.2. Argentina
- 2.3. Rest of South America
-
3. Europe
- 3.1. United Kingdom
- 3.2. Germany
- 3.3. France
- 3.4. Italy
- 3.5. Spain
- 3.6. Russia
- 3.7. Benelux
- 3.8. Nordics
- 3.9. Rest of Europe
-
4. Middle East & Africa
- 4.1. Turkey
- 4.2. Israel
- 4.3. GCC
- 4.4. North Africa
- 4.5. South Africa
- 4.6. Rest of Middle East & Africa
-
5. Asia Pacific
- 5.1. China
- 5.2. India
- 5.3. Japan
- 5.4. South Korea
- 5.5. ASEAN
- 5.6. Oceania
- 5.7. Rest of Asia Pacific
US Wireless Telecom Tower Industry REPORT HIGHLIGHTS
| Aspects | Details |
|---|---|
| Study Period | 2019-2033 |
| Base Year | 2024 |
| Estimated Year | 2025 |
| Forecast Period | 2025-2033 |
| Historical Period | 2019-2024 |
| Growth Rate | CAGR of 4.62% from 2019-2033 |
| Segmentation |
|
Table of Contents
- 1. Introduction
- 1.1. Research Scope
- 1.2. Market Segmentation
- 1.3. Research Methodology
- 1.4. Definitions and Assumptions
- 2. Executive Summary
- 2.1. Introduction
- 3. Market Dynamics
- 3.1. Introduction
- 3.2. Market Drivers
- 3.2.1. 5G deployments are a major catalyst for growth in the cell-tower leasing environment
- 3.3. Market Restrains
- 3.3.1. Availability of Limited Spectrum
- 3.4. Market Trends
- 3.4.1. Adoption of 5G to Drive the Market
- 4. Market Factor Analysis
- 4.1. Porters Five Forces
- 4.2. Supply/Value Chain
- 4.3. PESTEL analysis
- 4.4. Market Entropy
- 4.5. Patent/Trademark Analysis
- 5. Global US Wireless Telecom Tower Industry Analysis, Insights and Forecast, 2019-2031
- 5.1. Market Analysis, Insights and Forecast - by Fuel Type
- 5.1.1. Renewable
- 5.1.2. Non-renewable
- 5.2. Market Analysis, Insights and Forecast - by Installation
- 5.2.1. Rooftop
- 5.2.2. Ground-based
- 5.3. Market Analysis, Insights and Forecast - by Ownership
- 5.3.1. Operator-owned
- 5.3.2. Joint Venture
- 5.3.3. Private-owned
- 5.3.4. MNO Captive
- 5.4. Market Analysis, Insights and Forecast - by Region
- 5.4.1. North America
- 5.4.2. South America
- 5.4.3. Europe
- 5.4.4. Middle East & Africa
- 5.4.5. Asia Pacific
- 5.1. Market Analysis, Insights and Forecast - by Fuel Type
- 6. North America US Wireless Telecom Tower Industry Analysis, Insights and Forecast, 2019-2031
- 6.1. Market Analysis, Insights and Forecast - by Fuel Type
- 6.1.1. Renewable
- 6.1.2. Non-renewable
- 6.2. Market Analysis, Insights and Forecast - by Installation
- 6.2.1. Rooftop
- 6.2.2. Ground-based
- 6.3. Market Analysis, Insights and Forecast - by Ownership
- 6.3.1. Operator-owned
- 6.3.2. Joint Venture
- 6.3.3. Private-owned
- 6.3.4. MNO Captive
- 6.1. Market Analysis, Insights and Forecast - by Fuel Type
- 7. South America US Wireless Telecom Tower Industry Analysis, Insights and Forecast, 2019-2031
- 7.1. Market Analysis, Insights and Forecast - by Fuel Type
- 7.1.1. Renewable
- 7.1.2. Non-renewable
- 7.2. Market Analysis, Insights and Forecast - by Installation
- 7.2.1. Rooftop
- 7.2.2. Ground-based
- 7.3. Market Analysis, Insights and Forecast - by Ownership
- 7.3.1. Operator-owned
- 7.3.2. Joint Venture
- 7.3.3. Private-owned
- 7.3.4. MNO Captive
- 7.1. Market Analysis, Insights and Forecast - by Fuel Type
- 8. Europe US Wireless Telecom Tower Industry Analysis, Insights and Forecast, 2019-2031
- 8.1. Market Analysis, Insights and Forecast - by Fuel Type
- 8.1.1. Renewable
- 8.1.2. Non-renewable
- 8.2. Market Analysis, Insights and Forecast - by Installation
- 8.2.1. Rooftop
- 8.2.2. Ground-based
- 8.3. Market Analysis, Insights and Forecast - by Ownership
- 8.3.1. Operator-owned
- 8.3.2. Joint Venture
- 8.3.3. Private-owned
- 8.3.4. MNO Captive
- 8.1. Market Analysis, Insights and Forecast - by Fuel Type
- 9. Middle East & Africa US Wireless Telecom Tower Industry Analysis, Insights and Forecast, 2019-2031
- 9.1. Market Analysis, Insights and Forecast - by Fuel Type
- 9.1.1. Renewable
- 9.1.2. Non-renewable
- 9.2. Market Analysis, Insights and Forecast - by Installation
- 9.2.1. Rooftop
- 9.2.2. Ground-based
- 9.3. Market Analysis, Insights and Forecast - by Ownership
- 9.3.1. Operator-owned
- 9.3.2. Joint Venture
- 9.3.3. Private-owned
- 9.3.4. MNO Captive
- 9.1. Market Analysis, Insights and Forecast - by Fuel Type
- 10. Asia Pacific US Wireless Telecom Tower Industry Analysis, Insights and Forecast, 2019-2031
- 10.1. Market Analysis, Insights and Forecast - by Fuel Type
- 10.1.1. Renewable
- 10.1.2. Non-renewable
- 10.2. Market Analysis, Insights and Forecast - by Installation
- 10.2.1. Rooftop
- 10.2.2. Ground-based
- 10.3. Market Analysis, Insights and Forecast - by Ownership
- 10.3.1. Operator-owned
- 10.3.2. Joint Venture
- 10.3.3. Private-owned
- 10.3.4. MNO Captive
- 10.1. Market Analysis, Insights and Forecast - by Fuel Type
- 11. Northeast US Wireless Telecom Tower Industry Analysis, Insights and Forecast, 2019-2031
- 12. Southeast US Wireless Telecom Tower Industry Analysis, Insights and Forecast, 2019-2031
- 13. Midwest US Wireless Telecom Tower Industry Analysis, Insights and Forecast, 2019-2031
- 14. Southwest US Wireless Telecom Tower Industry Analysis, Insights and Forecast, 2019-2031
- 15. West US Wireless Telecom Tower Industry Analysis, Insights and Forecast, 2019-2031
- 16. Competitive Analysis
- 16.1. Global Market Share Analysis 2024
- 16.2. Company Profiles
- 16.2.1 SBA Communications Corporation
- 16.2.1.1. Overview
- 16.2.1.2. Products
- 16.2.1.3. SWOT Analysis
- 16.2.1.4. Recent Developments
- 16.2.1.5. Financials (Based on Availability)
- 16.2.2 Melody Wireless Infrastructure
- 16.2.2.1. Overview
- 16.2.2.2. Products
- 16.2.2.3. SWOT Analysis
- 16.2.2.4. Recent Developments
- 16.2.2.5. Financials (Based on Availability)
- 16.2.3 Crown Castle International Corp
- 16.2.3.1. Overview
- 16.2.3.2. Products
- 16.2.3.3. SWOT Analysis
- 16.2.3.4. Recent Developments
- 16.2.3.5. Financials (Based on Availability)
- 16.2.4 AT & T Intellectual Property
- 16.2.4.1. Overview
- 16.2.4.2. Products
- 16.2.4.3. SWOT Analysis
- 16.2.4.4. Recent Developments
- 16.2.4.5. Financials (Based on Availability)
- 16.2.5 Vertical Bridge
- 16.2.5.1. Overview
- 16.2.5.2. Products
- 16.2.5.3. SWOT Analysis
- 16.2.5.4. Recent Developments
- 16.2.5.5. Financials (Based on Availability)
- 16.2.6 Helios Towers plc
- 16.2.6.1. Overview
- 16.2.6.2. Products
- 16.2.6.3. SWOT Analysis
- 16.2.6.4. Recent Developments
- 16.2.6.5. Financials (Based on Availability)
- 16.2.7 Tillman Infrastructure LLC
- 16.2.7.1. Overview
- 16.2.7.2. Products
- 16.2.7.3. SWOT Analysis
- 16.2.7.4. Recent Developments
- 16.2.7.5. Financials (Based on Availability)
- 16.2.8 United States Cellular Co
- 16.2.8.1. Overview
- 16.2.8.2. Products
- 16.2.8.3. SWOT Analysis
- 16.2.8.4. Recent Developments
- 16.2.8.5. Financials (Based on Availability)
- 16.2.9 ATC IP LLC
- 16.2.9.1. Overview
- 16.2.9.2. Products
- 16.2.9.3. SWOT Analysis
- 16.2.9.4. Recent Developments
- 16.2.9.5. Financials (Based on Availability)
- 16.2.10 Insite Wireless Group
- 16.2.10.1. Overview
- 16.2.10.2. Products
- 16.2.10.3. SWOT Analysis
- 16.2.10.4. Recent Developments
- 16.2.10.5. Financials (Based on Availability)
- 16.2.11 BNSF Railroad
- 16.2.11.1. Overview
- 16.2.11.2. Products
- 16.2.11.3. SWOT Analysis
- 16.2.11.4. Recent Developments
- 16.2.11.5. Financials (Based on Availability)
- 16.2.1 SBA Communications Corporation
List of Figures
- Figure 1: Global US Wireless Telecom Tower Industry Revenue Breakdown (Million, %) by Region 2024 & 2032
- Figure 2: Global US Wireless Telecom Tower Industry Volume Breakdown (K Unit, %) by Region 2024 & 2032
- Figure 3: United states US Wireless Telecom Tower Industry Revenue (Million), by Country 2024 & 2032
- Figure 4: United states US Wireless Telecom Tower Industry Volume (K Unit), by Country 2024 & 2032
- Figure 5: United states US Wireless Telecom Tower Industry Revenue Share (%), by Country 2024 & 2032
- Figure 6: United states US Wireless Telecom Tower Industry Volume Share (%), by Country 2024 & 2032
- Figure 7: North America US Wireless Telecom Tower Industry Revenue (Million), by Fuel Type 2024 & 2032
- Figure 8: North America US Wireless Telecom Tower Industry Volume (K Unit), by Fuel Type 2024 & 2032
- Figure 9: North America US Wireless Telecom Tower Industry Revenue Share (%), by Fuel Type 2024 & 2032
- Figure 10: North America US Wireless Telecom Tower Industry Volume Share (%), by Fuel Type 2024 & 2032
- Figure 11: North America US Wireless Telecom Tower Industry Revenue (Million), by Installation 2024 & 2032
- Figure 12: North America US Wireless Telecom Tower Industry Volume (K Unit), by Installation 2024 & 2032
- Figure 13: North America US Wireless Telecom Tower Industry Revenue Share (%), by Installation 2024 & 2032
- Figure 14: North America US Wireless Telecom Tower Industry Volume Share (%), by Installation 2024 & 2032
- Figure 15: North America US Wireless Telecom Tower Industry Revenue (Million), by Ownership 2024 & 2032
- Figure 16: North America US Wireless Telecom Tower Industry Volume (K Unit), by Ownership 2024 & 2032
- Figure 17: North America US Wireless Telecom Tower Industry Revenue Share (%), by Ownership 2024 & 2032
- Figure 18: North America US Wireless Telecom Tower Industry Volume Share (%), by Ownership 2024 & 2032
- Figure 19: North America US Wireless Telecom Tower Industry Revenue (Million), by Country 2024 & 2032
- Figure 20: North America US Wireless Telecom Tower Industry Volume (K Unit), by Country 2024 & 2032
- Figure 21: North America US Wireless Telecom Tower Industry Revenue Share (%), by Country 2024 & 2032
- Figure 22: North America US Wireless Telecom Tower Industry Volume Share (%), by Country 2024 & 2032
- Figure 23: South America US Wireless Telecom Tower Industry Revenue (Million), by Fuel Type 2024 & 2032
- Figure 24: South America US Wireless Telecom Tower Industry Volume (K Unit), by Fuel Type 2024 & 2032
- Figure 25: South America US Wireless Telecom Tower Industry Revenue Share (%), by Fuel Type 2024 & 2032
- Figure 26: South America US Wireless Telecom Tower Industry Volume Share (%), by Fuel Type 2024 & 2032
- Figure 27: South America US Wireless Telecom Tower Industry Revenue (Million), by Installation 2024 & 2032
- Figure 28: South America US Wireless Telecom Tower Industry Volume (K Unit), by Installation 2024 & 2032
- Figure 29: South America US Wireless Telecom Tower Industry Revenue Share (%), by Installation 2024 & 2032
- Figure 30: South America US Wireless Telecom Tower Industry Volume Share (%), by Installation 2024 & 2032
- Figure 31: South America US Wireless Telecom Tower Industry Revenue (Million), by Ownership 2024 & 2032
- Figure 32: South America US Wireless Telecom Tower Industry Volume (K Unit), by Ownership 2024 & 2032
- Figure 33: South America US Wireless Telecom Tower Industry Revenue Share (%), by Ownership 2024 & 2032
- Figure 34: South America US Wireless Telecom Tower Industry Volume Share (%), by Ownership 2024 & 2032
- Figure 35: South America US Wireless Telecom Tower Industry Revenue (Million), by Country 2024 & 2032
- Figure 36: South America US Wireless Telecom Tower Industry Volume (K Unit), by Country 2024 & 2032
- Figure 37: South America US Wireless Telecom Tower Industry Revenue Share (%), by Country 2024 & 2032
- Figure 38: South America US Wireless Telecom Tower Industry Volume Share (%), by Country 2024 & 2032
- Figure 39: Europe US Wireless Telecom Tower Industry Revenue (Million), by Fuel Type 2024 & 2032
- Figure 40: Europe US Wireless Telecom Tower Industry Volume (K Unit), by Fuel Type 2024 & 2032
- Figure 41: Europe US Wireless Telecom Tower Industry Revenue Share (%), by Fuel Type 2024 & 2032
- Figure 42: Europe US Wireless Telecom Tower Industry Volume Share (%), by Fuel Type 2024 & 2032
- Figure 43: Europe US Wireless Telecom Tower Industry Revenue (Million), by Installation 2024 & 2032
- Figure 44: Europe US Wireless Telecom Tower Industry Volume (K Unit), by Installation 2024 & 2032
- Figure 45: Europe US Wireless Telecom Tower Industry Revenue Share (%), by Installation 2024 & 2032
- Figure 46: Europe US Wireless Telecom Tower Industry Volume Share (%), by Installation 2024 & 2032
- Figure 47: Europe US Wireless Telecom Tower Industry Revenue (Million), by Ownership 2024 & 2032
- Figure 48: Europe US Wireless Telecom Tower Industry Volume (K Unit), by Ownership 2024 & 2032
- Figure 49: Europe US Wireless Telecom Tower Industry Revenue Share (%), by Ownership 2024 & 2032
- Figure 50: Europe US Wireless Telecom Tower Industry Volume Share (%), by Ownership 2024 & 2032
- Figure 51: Europe US Wireless Telecom Tower Industry Revenue (Million), by Country 2024 & 2032
- Figure 52: Europe US Wireless Telecom Tower Industry Volume (K Unit), by Country 2024 & 2032
- Figure 53: Europe US Wireless Telecom Tower Industry Revenue Share (%), by Country 2024 & 2032
- Figure 54: Europe US Wireless Telecom Tower Industry Volume Share (%), by Country 2024 & 2032
- Figure 55: Middle East & Africa US Wireless Telecom Tower Industry Revenue (Million), by Fuel Type 2024 & 2032
- Figure 56: Middle East & Africa US Wireless Telecom Tower Industry Volume (K Unit), by Fuel Type 2024 & 2032
- Figure 57: Middle East & Africa US Wireless Telecom Tower Industry Revenue Share (%), by Fuel Type 2024 & 2032
- Figure 58: Middle East & Africa US Wireless Telecom Tower Industry Volume Share (%), by Fuel Type 2024 & 2032
- Figure 59: Middle East & Africa US Wireless Telecom Tower Industry Revenue (Million), by Installation 2024 & 2032
- Figure 60: Middle East & Africa US Wireless Telecom Tower Industry Volume (K Unit), by Installation 2024 & 2032
- Figure 61: Middle East & Africa US Wireless Telecom Tower Industry Revenue Share (%), by Installation 2024 & 2032
- Figure 62: Middle East & Africa US Wireless Telecom Tower Industry Volume Share (%), by Installation 2024 & 2032
- Figure 63: Middle East & Africa US Wireless Telecom Tower Industry Revenue (Million), by Ownership 2024 & 2032
- Figure 64: Middle East & Africa US Wireless Telecom Tower Industry Volume (K Unit), by Ownership 2024 & 2032
- Figure 65: Middle East & Africa US Wireless Telecom Tower Industry Revenue Share (%), by Ownership 2024 & 2032
- Figure 66: Middle East & Africa US Wireless Telecom Tower Industry Volume Share (%), by Ownership 2024 & 2032
- Figure 67: Middle East & Africa US Wireless Telecom Tower Industry Revenue (Million), by Country 2024 & 2032
- Figure 68: Middle East & Africa US Wireless Telecom Tower Industry Volume (K Unit), by Country 2024 & 2032
- Figure 69: Middle East & Africa US Wireless Telecom Tower Industry Revenue Share (%), by Country 2024 & 2032
- Figure 70: Middle East & Africa US Wireless Telecom Tower Industry Volume Share (%), by Country 2024 & 2032
- Figure 71: Asia Pacific US Wireless Telecom Tower Industry Revenue (Million), by Fuel Type 2024 & 2032
- Figure 72: Asia Pacific US Wireless Telecom Tower Industry Volume (K Unit), by Fuel Type 2024 & 2032
- Figure 73: Asia Pacific US Wireless Telecom Tower Industry Revenue Share (%), by Fuel Type 2024 & 2032
- Figure 74: Asia Pacific US Wireless Telecom Tower Industry Volume Share (%), by Fuel Type 2024 & 2032
- Figure 75: Asia Pacific US Wireless Telecom Tower Industry Revenue (Million), by Installation 2024 & 2032
- Figure 76: Asia Pacific US Wireless Telecom Tower Industry Volume (K Unit), by Installation 2024 & 2032
- Figure 77: Asia Pacific US Wireless Telecom Tower Industry Revenue Share (%), by Installation 2024 & 2032
- Figure 78: Asia Pacific US Wireless Telecom Tower Industry Volume Share (%), by Installation 2024 & 2032
- Figure 79: Asia Pacific US Wireless Telecom Tower Industry Revenue (Million), by Ownership 2024 & 2032
- Figure 80: Asia Pacific US Wireless Telecom Tower Industry Volume (K Unit), by Ownership 2024 & 2032
- Figure 81: Asia Pacific US Wireless Telecom Tower Industry Revenue Share (%), by Ownership 2024 & 2032
- Figure 82: Asia Pacific US Wireless Telecom Tower Industry Volume Share (%), by Ownership 2024 & 2032
- Figure 83: Asia Pacific US Wireless Telecom Tower Industry Revenue (Million), by Country 2024 & 2032
- Figure 84: Asia Pacific US Wireless Telecom Tower Industry Volume (K Unit), by Country 2024 & 2032
- Figure 85: Asia Pacific US Wireless Telecom Tower Industry Revenue Share (%), by Country 2024 & 2032
- Figure 86: Asia Pacific US Wireless Telecom Tower Industry Volume Share (%), by Country 2024 & 2032
List of Tables
- Table 1: Global US Wireless Telecom Tower Industry Revenue Million Forecast, by Region 2019 & 2032
- Table 2: Global US Wireless Telecom Tower Industry Volume K Unit Forecast, by Region 2019 & 2032
- Table 3: Global US Wireless Telecom Tower Industry Revenue Million Forecast, by Fuel Type 2019 & 2032
- Table 4: Global US Wireless Telecom Tower Industry Volume K Unit Forecast, by Fuel Type 2019 & 2032
- Table 5: Global US Wireless Telecom Tower Industry Revenue Million Forecast, by Installation 2019 & 2032
- Table 6: Global US Wireless Telecom Tower Industry Volume K Unit Forecast, by Installation 2019 & 2032
- Table 7: Global US Wireless Telecom Tower Industry Revenue Million Forecast, by Ownership 2019 & 2032
- Table 8: Global US Wireless Telecom Tower Industry Volume K Unit Forecast, by Ownership 2019 & 2032
- Table 9: Global US Wireless Telecom Tower Industry Revenue Million Forecast, by Region 2019 & 2032
- Table 10: Global US Wireless Telecom Tower Industry Volume K Unit Forecast, by Region 2019 & 2032
- Table 11: Global US Wireless Telecom Tower Industry Revenue Million Forecast, by Country 2019 & 2032
- Table 12: Global US Wireless Telecom Tower Industry Volume K Unit Forecast, by Country 2019 & 2032
- Table 13: Northeast US Wireless Telecom Tower Industry Revenue (Million) Forecast, by Application 2019 & 2032
- Table 14: Northeast US Wireless Telecom Tower Industry Volume (K Unit) Forecast, by Application 2019 & 2032
- Table 15: Southeast US Wireless Telecom Tower Industry Revenue (Million) Forecast, by Application 2019 & 2032
- Table 16: Southeast US Wireless Telecom Tower Industry Volume (K Unit) Forecast, by Application 2019 & 2032
- Table 17: Midwest US Wireless Telecom Tower Industry Revenue (Million) Forecast, by Application 2019 & 2032
- Table 18: Midwest US Wireless Telecom Tower Industry Volume (K Unit) Forecast, by Application 2019 & 2032
- Table 19: Southwest US Wireless Telecom Tower Industry Revenue (Million) Forecast, by Application 2019 & 2032
- Table 20: Southwest US Wireless Telecom Tower Industry Volume (K Unit) Forecast, by Application 2019 & 2032
- Table 21: West US Wireless Telecom Tower Industry Revenue (Million) Forecast, by Application 2019 & 2032
- Table 22: West US Wireless Telecom Tower Industry Volume (K Unit) Forecast, by Application 2019 & 2032
- Table 23: Global US Wireless Telecom Tower Industry Revenue Million Forecast, by Fuel Type 2019 & 2032
- Table 24: Global US Wireless Telecom Tower Industry Volume K Unit Forecast, by Fuel Type 2019 & 2032
- Table 25: Global US Wireless Telecom Tower Industry Revenue Million Forecast, by Installation 2019 & 2032
- Table 26: Global US Wireless Telecom Tower Industry Volume K Unit Forecast, by Installation 2019 & 2032
- Table 27: Global US Wireless Telecom Tower Industry Revenue Million Forecast, by Ownership 2019 & 2032
- Table 28: Global US Wireless Telecom Tower Industry Volume K Unit Forecast, by Ownership 2019 & 2032
- Table 29: Global US Wireless Telecom Tower Industry Revenue Million Forecast, by Country 2019 & 2032
- Table 30: Global US Wireless Telecom Tower Industry Volume K Unit Forecast, by Country 2019 & 2032
- Table 31: United States US Wireless Telecom Tower Industry Revenue (Million) Forecast, by Application 2019 & 2032
- Table 32: United States US Wireless Telecom Tower Industry Volume (K Unit) Forecast, by Application 2019 & 2032
- Table 33: Canada US Wireless Telecom Tower Industry Revenue (Million) Forecast, by Application 2019 & 2032
- Table 34: Canada US Wireless Telecom Tower Industry Volume (K Unit) Forecast, by Application 2019 & 2032
- Table 35: Mexico US Wireless Telecom Tower Industry Revenue (Million) Forecast, by Application 2019 & 2032
- Table 36: Mexico US Wireless Telecom Tower Industry Volume (K Unit) Forecast, by Application 2019 & 2032
- Table 37: Global US Wireless Telecom Tower Industry Revenue Million Forecast, by Fuel Type 2019 & 2032
- Table 38: Global US Wireless Telecom Tower Industry Volume K Unit Forecast, by Fuel Type 2019 & 2032
- Table 39: Global US Wireless Telecom Tower Industry Revenue Million Forecast, by Installation 2019 & 2032
- Table 40: Global US Wireless Telecom Tower Industry Volume K Unit Forecast, by Installation 2019 & 2032
- Table 41: Global US Wireless Telecom Tower Industry Revenue Million Forecast, by Ownership 2019 & 2032
- Table 42: Global US Wireless Telecom Tower Industry Volume K Unit Forecast, by Ownership 2019 & 2032
- Table 43: Global US Wireless Telecom Tower Industry Revenue Million Forecast, by Country 2019 & 2032
- Table 44: Global US Wireless Telecom Tower Industry Volume K Unit Forecast, by Country 2019 & 2032
- Table 45: Brazil US Wireless Telecom Tower Industry Revenue (Million) Forecast, by Application 2019 & 2032
- Table 46: Brazil US Wireless Telecom Tower Industry Volume (K Unit) Forecast, by Application 2019 & 2032
- Table 47: Argentina US Wireless Telecom Tower Industry Revenue (Million) Forecast, by Application 2019 & 2032
- Table 48: Argentina US Wireless Telecom Tower Industry Volume (K Unit) Forecast, by Application 2019 & 2032
- Table 49: Rest of South America US Wireless Telecom Tower Industry Revenue (Million) Forecast, by Application 2019 & 2032
- Table 50: Rest of South America US Wireless Telecom Tower Industry Volume (K Unit) Forecast, by Application 2019 & 2032
- Table 51: Global US Wireless Telecom Tower Industry Revenue Million Forecast, by Fuel Type 2019 & 2032
- Table 52: Global US Wireless Telecom Tower Industry Volume K Unit Forecast, by Fuel Type 2019 & 2032
- Table 53: Global US Wireless Telecom Tower Industry Revenue Million Forecast, by Installation 2019 & 2032
- Table 54: Global US Wireless Telecom Tower Industry Volume K Unit Forecast, by Installation 2019 & 2032
- Table 55: Global US Wireless Telecom Tower Industry Revenue Million Forecast, by Ownership 2019 & 2032
- Table 56: Global US Wireless Telecom Tower Industry Volume K Unit Forecast, by Ownership 2019 & 2032
- Table 57: Global US Wireless Telecom Tower Industry Revenue Million Forecast, by Country 2019 & 2032
- Table 58: Global US Wireless Telecom Tower Industry Volume K Unit Forecast, by Country 2019 & 2032
- Table 59: United Kingdom US Wireless Telecom Tower Industry Revenue (Million) Forecast, by Application 2019 & 2032
- Table 60: United Kingdom US Wireless Telecom Tower Industry Volume (K Unit) Forecast, by Application 2019 & 2032
- Table 61: Germany US Wireless Telecom Tower Industry Revenue (Million) Forecast, by Application 2019 & 2032
- Table 62: Germany US Wireless Telecom Tower Industry Volume (K Unit) Forecast, by Application 2019 & 2032
- Table 63: France US Wireless Telecom Tower Industry Revenue (Million) Forecast, by Application 2019 & 2032
- Table 64: France US Wireless Telecom Tower Industry Volume (K Unit) Forecast, by Application 2019 & 2032
- Table 65: Italy US Wireless Telecom Tower Industry Revenue (Million) Forecast, by Application 2019 & 2032
- Table 66: Italy US Wireless Telecom Tower Industry Volume (K Unit) Forecast, by Application 2019 & 2032
- Table 67: Spain US Wireless Telecom Tower Industry Revenue (Million) Forecast, by Application 2019 & 2032
- Table 68: Spain US Wireless Telecom Tower Industry Volume (K Unit) Forecast, by Application 2019 & 2032
- Table 69: Russia US Wireless Telecom Tower Industry Revenue (Million) Forecast, by Application 2019 & 2032
- Table 70: Russia US Wireless Telecom Tower Industry Volume (K Unit) Forecast, by Application 2019 & 2032
- Table 71: Benelux US Wireless Telecom Tower Industry Revenue (Million) Forecast, by Application 2019 & 2032
- Table 72: Benelux US Wireless Telecom Tower Industry Volume (K Unit) Forecast, by Application 2019 & 2032
- Table 73: Nordics US Wireless Telecom Tower Industry Revenue (Million) Forecast, by Application 2019 & 2032
- Table 74: Nordics US Wireless Telecom Tower Industry Volume (K Unit) Forecast, by Application 2019 & 2032
- Table 75: Rest of Europe US Wireless Telecom Tower Industry Revenue (Million) Forecast, by Application 2019 & 2032
- Table 76: Rest of Europe US Wireless Telecom Tower Industry Volume (K Unit) Forecast, by Application 2019 & 2032
- Table 77: Global US Wireless Telecom Tower Industry Revenue Million Forecast, by Fuel Type 2019 & 2032
- Table 78: Global US Wireless Telecom Tower Industry Volume K Unit Forecast, by Fuel Type 2019 & 2032
- Table 79: Global US Wireless Telecom Tower Industry Revenue Million Forecast, by Installation 2019 & 2032
- Table 80: Global US Wireless Telecom Tower Industry Volume K Unit Forecast, by Installation 2019 & 2032
- Table 81: Global US Wireless Telecom Tower Industry Revenue Million Forecast, by Ownership 2019 & 2032
- Table 82: Global US Wireless Telecom Tower Industry Volume K Unit Forecast, by Ownership 2019 & 2032
- Table 83: Global US Wireless Telecom Tower Industry Revenue Million Forecast, by Country 2019 & 2032
- Table 84: Global US Wireless Telecom Tower Industry Volume K Unit Forecast, by Country 2019 & 2032
- Table 85: Turkey US Wireless Telecom Tower Industry Revenue (Million) Forecast, by Application 2019 & 2032
- Table 86: Turkey US Wireless Telecom Tower Industry Volume (K Unit) Forecast, by Application 2019 & 2032
- Table 87: Israel US Wireless Telecom Tower Industry Revenue (Million) Forecast, by Application 2019 & 2032
- Table 88: Israel US Wireless Telecom Tower Industry Volume (K Unit) Forecast, by Application 2019 & 2032
- Table 89: GCC US Wireless Telecom Tower Industry Revenue (Million) Forecast, by Application 2019 & 2032
- Table 90: GCC US Wireless Telecom Tower Industry Volume (K Unit) Forecast, by Application 2019 & 2032
- Table 91: North Africa US Wireless Telecom Tower Industry Revenue (Million) Forecast, by Application 2019 & 2032
- Table 92: North Africa US Wireless Telecom Tower Industry Volume (K Unit) Forecast, by Application 2019 & 2032
- Table 93: South Africa US Wireless Telecom Tower Industry Revenue (Million) Forecast, by Application 2019 & 2032
- Table 94: South Africa US Wireless Telecom Tower Industry Volume (K Unit) Forecast, by Application 2019 & 2032
- Table 95: Rest of Middle East & Africa US Wireless Telecom Tower Industry Revenue (Million) Forecast, by Application 2019 & 2032
- Table 96: Rest of Middle East & Africa US Wireless Telecom Tower Industry Volume (K Unit) Forecast, by Application 2019 & 2032
- Table 97: Global US Wireless Telecom Tower Industry Revenue Million Forecast, by Fuel Type 2019 & 2032
- Table 98: Global US Wireless Telecom Tower Industry Volume K Unit Forecast, by Fuel Type 2019 & 2032
- Table 99: Global US Wireless Telecom Tower Industry Revenue Million Forecast, by Installation 2019 & 2032
- Table 100: Global US Wireless Telecom Tower Industry Volume K Unit Forecast, by Installation 2019 & 2032
- Table 101: Global US Wireless Telecom Tower Industry Revenue Million Forecast, by Ownership 2019 & 2032
- Table 102: Global US Wireless Telecom Tower Industry Volume K Unit Forecast, by Ownership 2019 & 2032
- Table 103: Global US Wireless Telecom Tower Industry Revenue Million Forecast, by Country 2019 & 2032
- Table 104: Global US Wireless Telecom Tower Industry Volume K Unit Forecast, by Country 2019 & 2032
- Table 105: China US Wireless Telecom Tower Industry Revenue (Million) Forecast, by Application 2019 & 2032
- Table 106: China US Wireless Telecom Tower Industry Volume (K Unit) Forecast, by Application 2019 & 2032
- Table 107: India US Wireless Telecom Tower Industry Revenue (Million) Forecast, by Application 2019 & 2032
- Table 108: India US Wireless Telecom Tower Industry Volume (K Unit) Forecast, by Application 2019 & 2032
- Table 109: Japan US Wireless Telecom Tower Industry Revenue (Million) Forecast, by Application 2019 & 2032
- Table 110: Japan US Wireless Telecom Tower Industry Volume (K Unit) Forecast, by Application 2019 & 2032
- Table 111: South Korea US Wireless Telecom Tower Industry Revenue (Million) Forecast, by Application 2019 & 2032
- Table 112: South Korea US Wireless Telecom Tower Industry Volume (K Unit) Forecast, by Application 2019 & 2032
- Table 113: ASEAN US Wireless Telecom Tower Industry Revenue (Million) Forecast, by Application 2019 & 2032
- Table 114: ASEAN US Wireless Telecom Tower Industry Volume (K Unit) Forecast, by Application 2019 & 2032
- Table 115: Oceania US Wireless Telecom Tower Industry Revenue (Million) Forecast, by Application 2019 & 2032
- Table 116: Oceania US Wireless Telecom Tower Industry Volume (K Unit) Forecast, by Application 2019 & 2032
- Table 117: Rest of Asia Pacific US Wireless Telecom Tower Industry Revenue (Million) Forecast, by Application 2019 & 2032
- Table 118: Rest of Asia Pacific US Wireless Telecom Tower Industry Volume (K Unit) Forecast, by Application 2019 & 2032
Frequently Asked Questions
1. What is the projected Compound Annual Growth Rate (CAGR) of the US Wireless Telecom Tower Industry?
The projected CAGR is approximately 4.62%.
2. Which companies are prominent players in the US Wireless Telecom Tower Industry?
Key companies in the market include SBA Communications Corporation, Melody Wireless Infrastructure, Crown Castle International Corp, AT & T Intellectual Property, Vertical Bridge, Helios Towers plc, Tillman Infrastructure LLC, United States Cellular Co, ATC IP LLC, Insite Wireless Group, BNSF Railroad.
3. What are the main segments of the US Wireless Telecom Tower Industry?
The market segments include Fuel Type, Installation, Ownership.
4. Can you provide details about the market size?
The market size is estimated to be USD XX Million as of 2022.
5. What are some drivers contributing to market growth?
5G deployments are a major catalyst for growth in the cell-tower leasing environment.
6. What are the notable trends driving market growth?
Adoption of 5G to Drive the Market.
7. Are there any restraints impacting market growth?
Availability of Limited Spectrum.
8. Can you provide examples of recent developments in the market?
January 2022 - The announcement of a new 12-year collaboration between T-Mobile US, Inc. and Crown Castle International Corp. would enable T-Mobile to have more access to Crown Castle's towers and small cell sites as the company expands its national 5G network. With the help of the deal, the Un-carrier may serve customers across the United States by further extending and broadening the coverage of the company's 5G network and generating financial synergies after its merger. Additionally, the deal assists Crown Castle in developing long-term income development from small cells and towers.
9. What pricing options are available for accessing the report?
Pricing options include single-user, multi-user, and enterprise licenses priced at USD 3800, USD 4500, and USD 5800 respectively.
10. Is the market size provided in terms of value or volume?
The market size is provided in terms of value, measured in Million and volume, measured in K Unit.
11. Are there any specific market keywords associated with the report?
Yes, the market keyword associated with the report is "US Wireless Telecom Tower Industry," which aids in identifying and referencing the specific market segment covered.
12. How do I determine which pricing option suits my needs best?
The pricing options vary based on user requirements and access needs. Individual users may opt for single-user licenses, while businesses requiring broader access may choose multi-user or enterprise licenses for cost-effective access to the report.
13. Are there any additional resources or data provided in the US Wireless Telecom Tower Industry report?
While the report offers comprehensive insights, it's advisable to review the specific contents or supplementary materials provided to ascertain if additional resources or data are available.
14. How can I stay updated on further developments or reports in the US Wireless Telecom Tower Industry?
To stay informed about further developments, trends, and reports in the US Wireless Telecom Tower Industry, consider subscribing to industry newsletters, following relevant companies and organizations, or regularly checking reputable industry news sources and publications.
Methodology
Step 1 - Identification of Relevant Samples Size from Population Database


Step 2 - Approaches for Defining Global Market Size (Value, Volume* & Price*)

Note*: In applicable scenarios
Step 3 - Data Sources
Primary Research
- Web Analytics
- Survey Reports
- Research Institute
- Latest Research Reports
- Opinion Leaders
Secondary Research
- Annual Reports
- White Paper
- Latest Press Release
- Industry Association
- Paid Database
- Investor Presentations

Step 4 - Data Triangulation
Involves using different sources of information in order to increase the validity of a study
These sources are likely to be stakeholders in a program - participants, other researchers, program staff, other community members, and so on.
Then we put all data in single framework & apply various statistical tools to find out the dynamic on the market.
During the analysis stage, feedback from the stakeholder groups would be compared to determine areas of agreement as well as areas of divergence
