

Key Insights
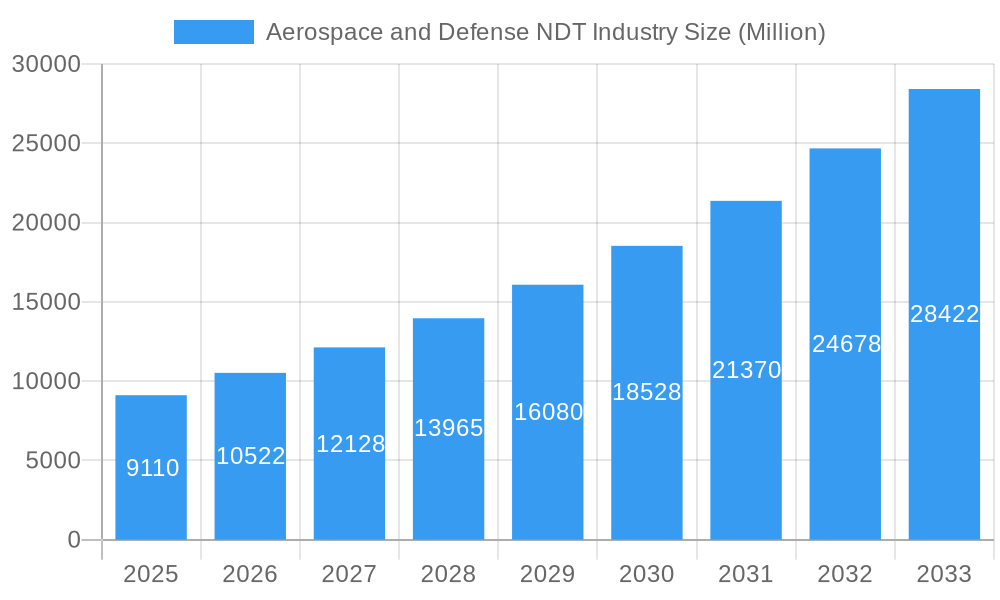
The Aerospace and Defense Non-Destructive Testing (NDT) market, valued at $9.11 billion in 2025, is poised for robust growth, projected to expand at a Compound Annual Growth Rate (CAGR) of 15.74% from 2025 to 2033. This significant expansion is driven by several factors. Firstly, the increasing demand for enhanced aircraft safety and reliability necessitates rigorous inspection procedures, fueling the adoption of advanced NDT technologies. Secondly, stringent regulatory compliance standards within the aerospace and defense sectors mandate thorough quality control, further propelling market growth. Thirdly, technological advancements in NDT methods, such as the integration of automation and artificial intelligence, are improving efficiency and accuracy, leading to wider acceptance across the industry. Finally, the rising global defense spending and increasing aircraft production contribute to a positive outlook for market expansion.
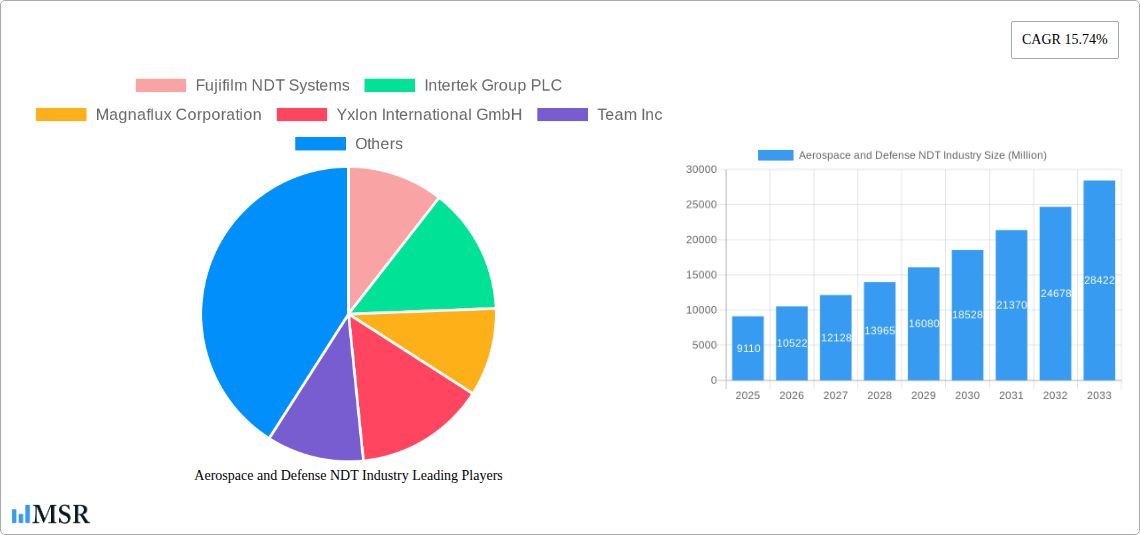
Aerospace and Defense NDT Industry Market Size (In Billion)
Growth within the market is segmented across various NDT methods including radiography, ultrasonic, magnetic particle, electromagnetic, liquid penetrant testing, visual inspection, and eddy current techniques. Service providers constitute a major segment, offering comprehensive inspection and analysis services. Equipment sales also represent a substantial portion of the market, with continued innovation in portable and high-resolution equipment driving segment growth. Geographically, North America and Europe are currently leading the market, due to the presence of major aerospace manufacturers and a well-established regulatory framework. However, Asia-Pacific is anticipated to witness significant growth over the forecast period, driven by increasing domestic manufacturing capacity and substantial investments in defense modernization. This projected growth signifies the increasing importance of ensuring the integrity and safety of aerospace and defense assets across the globe, solidifying the NDT market’s position as a crucial component of the industry's continued expansion and innovation.
Aerospace and Defense NDT Industry Company Market Share
Aerospace and Defense NDT Industry Market Report: 2019-2033
This comprehensive report provides a detailed analysis of the Aerospace and Defense Non-Destructive Testing (NDT) industry, offering invaluable insights for stakeholders, investors, and industry professionals. With a study period spanning 2019-2033, a base year of 2025, and a forecast period of 2025-2033, this report meticulously examines market dynamics, key players, technological advancements, and future growth prospects. The market size is estimated at xx Million in 2025, with a Compound Annual Growth Rate (CAGR) of xx% projected for the forecast period.
Aerospace and Defense NDT Industry Market Concentration & Dynamics
The Aerospace and Defense NDT market exhibits a moderately concentrated landscape, with key players such as Fujifilm NDT Systems, Intertek Group PLC, Magnaflux Corporation, and Olympus Corporation holding significant market share. However, a considerable number of smaller, specialized companies also contribute significantly, particularly in niche technologies. The market is characterized by ongoing innovation, driven by advancements in NDT technologies such as advanced radiography, phased array ultrasonics, and electromagnetic testing. Stringent regulatory frameworks, particularly within the aerospace sector, necessitate high-quality NDT services and equipment, shaping industry practices and investment decisions. Substitute products are limited, with NDT remaining the primary method for detecting internal flaws in critical aerospace and defense components. End-user trends highlight increasing demand for faster, more efficient, and automated NDT solutions, driving the adoption of advanced technologies and data analytics.
- Market Concentration: Top 5 players hold approximately xx% of the market share in 2025.
- M&A Activity: The historical period (2019-2024) witnessed approximately xx M&A deals, indicating a consolidating market.
- Innovation Ecosystems: Significant investment in R&D focused on improving accuracy, speed, and automation of NDT processes.
- Regulatory Frameworks: Stringent quality control standards like those imposed by the FAA and similar international organizations.
Aerospace and Defense NDT Industry Industry Insights & Trends
The Aerospace and Defense NDT market is experiencing robust growth, propelled by several factors. The increasing demand for advanced aircraft and defense systems, coupled with the need for stringent quality control and safety standards, fuels the adoption of NDT technologies. Technological disruptions are reshaping the market, with advancements in AI-powered image analysis, robotic inspection systems, and portable, lightweight NDT equipment significantly improving efficiency and reducing inspection times. Consumer behavior within the industry reflects a growing preference for integrated NDT solutions, encompassing equipment, services, and data analysis, offering comprehensive quality assurance.
- Market Size (2025): Estimated at xx Million.
- CAGR (2025-2033): Projected at xx%.
- Growth Drivers: Increased aircraft production, stringent regulatory compliance, rising defense spending, and the demand for improved safety and reliability.
Key Markets & Segments Leading Aerospace and Defense NDT Industry
The North American region currently holds the largest market share, driven by significant aerospace and defense manufacturing activities and robust regulatory frameworks. Within segments, the Equipment segment holds a larger share than the Service segment, reflecting the high capital expenditure on advanced NDT equipment. Regarding technologies, Radiography Testing and Ultrasonic Testing remain dominant, though Eddy Current and Electromagnetic Testing are witnessing accelerated growth due to their suitability for specific applications.
- Dominant Region: North America
- Dominant Segment (By Type): Equipment
- Dominant Segment (By Technology): Radiography Testing and Ultrasonic Testing
- Drivers:
- Economic Growth: Strong economic performance in key regions drives investment in aerospace and defense.
- Infrastructure Development: Expansion of airports and defense facilities boosts demand for NDT services.
- Technological Advancements: Continuous innovations lead to adoption of newer technologies.
Aerospace and Defense NDT Industry Product Developments
Recent product innovations highlight a focus on enhanced automation, improved data analysis capabilities, and increased portability. Eddyfi Technologies' TubePro 6 software, launched in March 2024, exemplifies this trend by providing advanced pre-inspection and reporting capabilities for heat exchanger inspections, significantly improving efficiency and data interpretation. Rad Source NDT’s NDT 1000 X-ray Inspection System, launched in February 2024, demonstrates the ongoing development of more versatile and precise X-ray systems, especially suitable for materials like steel. These advancements offer significant competitive edges by streamlining workflows and enhancing the accuracy of NDT inspections.
Challenges in the Aerospace and Defense NDT Industry Market
The Aerospace and Defense NDT industry faces challenges including stringent regulatory compliance, supply chain disruptions impacting component availability, and intense competition among established players and emerging technologies. These factors can impact timelines, costs, and overall market growth, requiring continuous adaptation and innovation to mitigate negative impacts. The estimated impact on the market value due to these issues is predicted to be around xx Million annually.
Forces Driving Aerospace and Defense NDT Industry Growth
Several factors are driving market expansion. Technological advancements, including AI-powered systems and improved sensors, are enhancing accuracy and speed. Economic growth, particularly in emerging economies, increases demand for aircraft and defense systems. Stringent regulatory requirements reinforce the necessity of reliable NDT, pushing the adoption of advanced technologies.
Long-Term Growth Catalysts in the Aerospace and Defense NDT Industry
Long-term growth hinges on continuous innovation within NDT technologies, fostering strategic partnerships between equipment manufacturers and service providers. Expansion into new markets, particularly in emerging economies undergoing rapid industrialization, presents significant growth opportunities. Furthermore, the development of more integrated and data-driven solutions will be critical for sustaining growth.
Emerging Opportunities in Aerospace and Defense NDT Industry
Emerging opportunities include the integration of advanced data analytics and AI for improved decision-making, development of specialized NDT solutions for composite materials and additive manufacturing, and expansion into the burgeoning drone inspection market. Furthermore, the growing need for predictive maintenance and digital twin technologies presents considerable opportunities for NDT providers.
Leading Players in the Aerospace and Defense NDT Industry Sector
- Fujifilm NDT Systems
- Intertek Group PLC
- Magnaflux Corporation
- Yxlon International GmbH
- Team Inc
- SGS Group
- TUV Rheinland Ag
- Nikon Metrology Inc
- Mistras Group
- Olympus Corporation
- GE Measurement and Control
- Applus Services S A
- FLIR Systems Inc
- Gould-Bass Co
Key Milestones in Aerospace and Defense NDT Industry Industry
- March 2024: Eddyfi Technologies launches TubePro 6, advancing pre-inspection and reporting software, enhancing efficiency in heat exchanger inspections.
- February 2024: Rad Source NDT introduces the NDT 1000 X-ray Inspection System, improving precision and speed in material inspection, particularly for steel components up to 0.5 inches thick.
Strategic Outlook for Aerospace and Defense NDT Industry Market
The Aerospace and Defense NDT market exhibits strong growth potential, driven by continued technological advancements, increasing demand for high-quality inspection, and the growing adoption of data-driven approaches. Strategic opportunities lie in developing specialized solutions for emerging materials and manufacturing processes, expanding into new geographical markets, and forging strategic partnerships to enhance service offerings and market reach. The market is poised for substantial expansion throughout the forecast period, presenting significant opportunities for both established players and new entrants.
Aerospace and Defense NDT Industry Segmentation
-
1. Type
- 1.1. Service
- 1.2. Equipment
-
2. Technology
- 2.1. Radiography Testing
- 2.2. Ultrasonic Testing
- 2.3. Magnetic
- 2.4. Liquid Penetrant Testing
- 2.5. Visual Inspection
- 2.6. Eddy Current
Aerospace and Defense NDT Industry Segmentation By Geography
- 1. North America
- 2. Europe
- 3. Asia
- 4. Australia and New Zealand
- 5. Latin America
- 6. Middle East and Africa
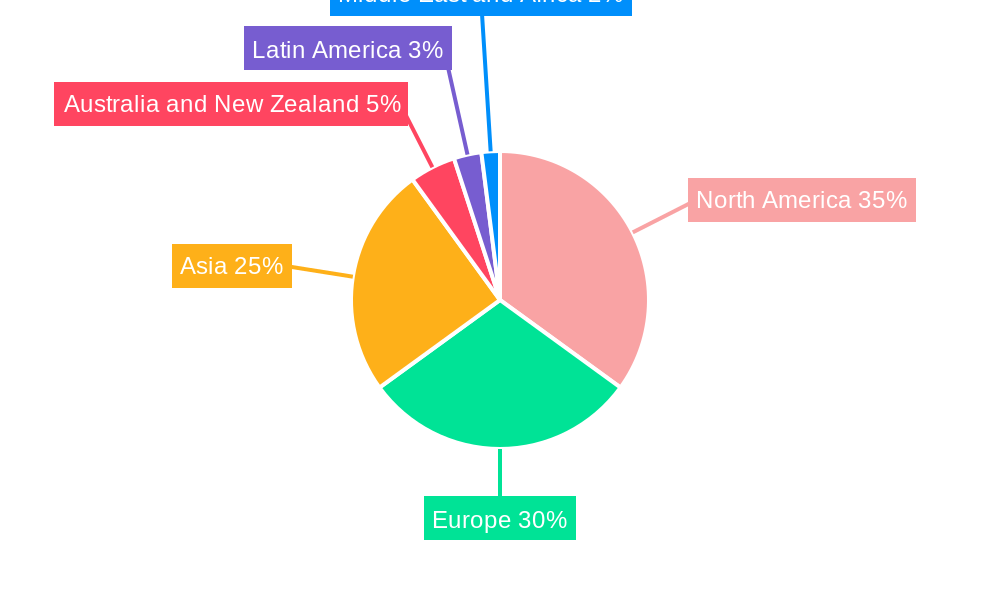
Aerospace and Defense NDT Industry Regional Market Share
Geographic Coverage of Aerospace and Defense NDT Industry
Aerospace and Defense NDT Industry REPORT HIGHLIGHTS
| Aspects | Details |
|---|---|
| Study Period | 2020-2034 |
| Base Year | 2025 |
| Estimated Year | 2026 |
| Forecast Period | 2026-2034 |
| Historical Period | 2020-2025 |
| Growth Rate | CAGR of 15.74% from 2020-2034 |
| Segmentation |
|
Table of Contents
- 1. Introduction
- 1.1. Research Scope
- 1.2. Market Segmentation
- 1.3. Research Objective
- 1.4. Definitions and Assumptions
- 2. Executive Summary
- 2.1. Market Snapshot
- 3. Market Dynamics
- 3.1. Market Drivers
- 3.2. Market Restrains
- 3.3. Market Trends
- 3.4. Market Opportunities
- 4. Market Factor Analysis
- 4.1. Porters Five Forces
- 4.1.1. Bargaining Power of Suppliers
- 4.1.2. Bargaining Power of Buyers
- 4.1.3. Threat of New Entrants
- 4.1.4. Threat of Substitutes
- 4.1.5. Competitive Rivalry
- 4.2. PESTEL analysis
- 4.3. BCG Analysis
- 4.3.1. Stars (High Growth, High Market Share)
- 4.3.2. Cash Cows (Low Growth, High Market Share)
- 4.3.3. Question Mark (High Growth, Low Market Share)
- 4.3.4. Dogs (Low Growth, Low Market Share)
- 4.4. Ansoff Matrix Analysis
- 4.5. Supply Chain Analysis
- 4.6. Regulatory Landscape
- 4.7. Current Market Potential and Opportunity Assessment (TAM–SAM–SOM Framework)
- 4.8. MSR Analyst Note
- 4.1. Porters Five Forces
- 5. Market Analysis, Insights and Forecast 2021-2033
- 5.1. Market Analysis, Insights and Forecast - by Type
- 5.1.1. Service
- 5.1.2. Equipment
- 5.2. Market Analysis, Insights and Forecast - by Technology
- 5.2.1. Radiography Testing
- 5.2.2. Ultrasonic Testing
- 5.2.3. Magnetic
- 5.2.4. Liquid Penetrant Testing
- 5.2.5. Visual Inspection
- 5.2.6. Eddy Current
- 5.3. Market Analysis, Insights and Forecast - by Region
- 5.3.1. North America
- 5.3.2. Europe
- 5.3.3. Asia
- 5.3.4. Australia and New Zealand
- 5.3.5. Latin America
- 5.3.6. Middle East and Africa
- 5.1. Market Analysis, Insights and Forecast - by Type
- 6. Global Aerospace and Defense NDT Industry Analysis, Insights and Forecast, 2021-2033
- 6.1. Market Analysis, Insights and Forecast - by Type
- 6.1.1. Service
- 6.1.2. Equipment
- 6.2. Market Analysis, Insights and Forecast - by Technology
- 6.2.1. Radiography Testing
- 6.2.2. Ultrasonic Testing
- 6.2.3. Magnetic
- 6.2.4. Liquid Penetrant Testing
- 6.2.5. Visual Inspection
- 6.2.6. Eddy Current
- 6.1. Market Analysis, Insights and Forecast - by Type
- 7. North America Aerospace and Defense NDT Industry Analysis, Insights and Forecast, 2020-2032
- 7.1. Market Analysis, Insights and Forecast - by Type
- 7.1.1. Service
- 7.1.2. Equipment
- 7.2. Market Analysis, Insights and Forecast - by Technology
- 7.2.1. Radiography Testing
- 7.2.2. Ultrasonic Testing
- 7.2.3. Magnetic
- 7.2.4. Liquid Penetrant Testing
- 7.2.5. Visual Inspection
- 7.2.6. Eddy Current
- 7.1. Market Analysis, Insights and Forecast - by Type
- 8. Europe Aerospace and Defense NDT Industry Analysis, Insights and Forecast, 2020-2032
- 8.1. Market Analysis, Insights and Forecast - by Type
- 8.1.1. Service
- 8.1.2. Equipment
- 8.2. Market Analysis, Insights and Forecast - by Technology
- 8.2.1. Radiography Testing
- 8.2.2. Ultrasonic Testing
- 8.2.3. Magnetic
- 8.2.4. Liquid Penetrant Testing
- 8.2.5. Visual Inspection
- 8.2.6. Eddy Current
- 8.1. Market Analysis, Insights and Forecast - by Type
- 9. Asia Aerospace and Defense NDT Industry Analysis, Insights and Forecast, 2020-2032
- 9.1. Market Analysis, Insights and Forecast - by Type
- 9.1.1. Service
- 9.1.2. Equipment
- 9.2. Market Analysis, Insights and Forecast - by Technology
- 9.2.1. Radiography Testing
- 9.2.2. Ultrasonic Testing
- 9.2.3. Magnetic
- 9.2.4. Liquid Penetrant Testing
- 9.2.5. Visual Inspection
- 9.2.6. Eddy Current
- 9.1. Market Analysis, Insights and Forecast - by Type
- 10. Australia and New Zealand Aerospace and Defense NDT Industry Analysis, Insights and Forecast, 2020-2032
- 10.1. Market Analysis, Insights and Forecast - by Type
- 10.1.1. Service
- 10.1.2. Equipment
- 10.2. Market Analysis, Insights and Forecast - by Technology
- 10.2.1. Radiography Testing
- 10.2.2. Ultrasonic Testing
- 10.2.3. Magnetic
- 10.2.4. Liquid Penetrant Testing
- 10.2.5. Visual Inspection
- 10.2.6. Eddy Current
- 10.1. Market Analysis, Insights and Forecast - by Type
- 11. Latin America Aerospace and Defense NDT Industry Analysis, Insights and Forecast, 2020-2032
- 11.1. Market Analysis, Insights and Forecast - by Type
- 11.1.1. Service
- 11.1.2. Equipment
- 11.2. Market Analysis, Insights and Forecast - by Technology
- 11.2.1. Radiography Testing
- 11.2.2. Ultrasonic Testing
- 11.2.3. Magnetic
- 11.2.4. Liquid Penetrant Testing
- 11.2.5. Visual Inspection
- 11.2.6. Eddy Current
- 11.1. Market Analysis, Insights and Forecast - by Type
- 12. Middle East and Africa Aerospace and Defense NDT Industry Analysis, Insights and Forecast, 2020-2032
- 12.1. Market Analysis, Insights and Forecast - by Type
- 12.1.1. Service
- 12.1.2. Equipment
- 12.2. Market Analysis, Insights and Forecast - by Technology
- 12.2.1. Radiography Testing
- 12.2.2. Ultrasonic Testing
- 12.2.3. Magnetic
- 12.2.4. Liquid Penetrant Testing
- 12.2.5. Visual Inspection
- 12.2.6. Eddy Current
- 12.1. Market Analysis, Insights and Forecast - by Type
- 13. Competitive Analysis
- 13.1. Company Profiles
- 13.1.1 Fujifilm NDT Systems
- 13.1.1.1. Company Overview
- 13.1.1.2. Products
- 13.1.1.3. Company Financials
- 13.1.1.4. SWOT Analysis
- 13.1.2 Intertek Group PLC
- 13.1.2.1. Company Overview
- 13.1.2.2. Products
- 13.1.2.3. Company Financials
- 13.1.2.4. SWOT Analysis
- 13.1.3 Magnaflux Corporation
- 13.1.3.1. Company Overview
- 13.1.3.2. Products
- 13.1.3.3. Company Financials
- 13.1.3.4. SWOT Analysis
- 13.1.4 Yxlon International GmbH
- 13.1.4.1. Company Overview
- 13.1.4.2. Products
- 13.1.4.3. Company Financials
- 13.1.4.4. SWOT Analysis
- 13.1.5 Team Inc
- 13.1.5.1. Company Overview
- 13.1.5.2. Products
- 13.1.5.3. Company Financials
- 13.1.5.4. SWOT Analysis
- 13.1.6 SGS Group
- 13.1.6.1. Company Overview
- 13.1.6.2. Products
- 13.1.6.3. Company Financials
- 13.1.6.4. SWOT Analysis
- 13.1.7 TUV Rheinland Ag
- 13.1.7.1. Company Overview
- 13.1.7.2. Products
- 13.1.7.3. Company Financials
- 13.1.7.4. SWOT Analysis
- 13.1.8 NikonMetrology Inc
- 13.1.8.1. Company Overview
- 13.1.8.2. Products
- 13.1.8.3. Company Financials
- 13.1.8.4. SWOT Analysis
- 13.1.9 Mistras Group
- 13.1.9.1. Company Overview
- 13.1.9.2. Products
- 13.1.9.3. Company Financials
- 13.1.9.4. SWOT Analysis
- 13.1.10 Olympus Corporation
- 13.1.10.1. Company Overview
- 13.1.10.2. Products
- 13.1.10.3. Company Financials
- 13.1.10.4. SWOT Analysis
- 13.1.11 GE Measurement and Control
- 13.1.11.1. Company Overview
- 13.1.11.2. Products
- 13.1.11.3. Company Financials
- 13.1.11.4. SWOT Analysis
- 13.1.12 Applus Services S A
- 13.1.12.1. Company Overview
- 13.1.12.2. Products
- 13.1.12.3. Company Financials
- 13.1.12.4. SWOT Analysis
- 13.1.13 FLIR Systems Inc *List Not Exhaustive
- 13.1.13.1. Company Overview
- 13.1.13.2. Products
- 13.1.13.3. Company Financials
- 13.1.13.4. SWOT Analysis
- 13.1.14 Gould-Bass Co
- 13.1.14.1. Company Overview
- 13.1.14.2. Products
- 13.1.14.3. Company Financials
- 13.1.14.4. SWOT Analysis
- 13.1.1 Fujifilm NDT Systems
- 13.2. Market Entropy
- 13.2.1 Company's Key Areas Served
- 13.2.2 Recent Developments
- 13.3. Company Market Share Analysis 2025
- 13.3.1 Top 5 Companies Market Share Analysis
- 13.3.2 Top 3 Companies Market Share Analysis
- 13.4. List of Potential Customers
- 14. Research Methodology
List of Figures
- Figure 1: Global Aerospace and Defense NDT Industry Revenue Breakdown (Million, %) by Region 2025 & 2033
- Figure 2: North America Aerospace and Defense NDT Industry Revenue (Million), by Type 2025 & 2033
- Figure 3: North America Aerospace and Defense NDT Industry Revenue Share (%), by Type 2025 & 2033
- Figure 4: North America Aerospace and Defense NDT Industry Revenue (Million), by Technology 2025 & 2033
- Figure 5: North America Aerospace and Defense NDT Industry Revenue Share (%), by Technology 2025 & 2033
- Figure 6: North America Aerospace and Defense NDT Industry Revenue (Million), by Country 2025 & 2033
- Figure 7: North America Aerospace and Defense NDT Industry Revenue Share (%), by Country 2025 & 2033
- Figure 8: Europe Aerospace and Defense NDT Industry Revenue (Million), by Type 2025 & 2033
- Figure 9: Europe Aerospace and Defense NDT Industry Revenue Share (%), by Type 2025 & 2033
- Figure 10: Europe Aerospace and Defense NDT Industry Revenue (Million), by Technology 2025 & 2033
- Figure 11: Europe Aerospace and Defense NDT Industry Revenue Share (%), by Technology 2025 & 2033
- Figure 12: Europe Aerospace and Defense NDT Industry Revenue (Million), by Country 2025 & 2033
- Figure 13: Europe Aerospace and Defense NDT Industry Revenue Share (%), by Country 2025 & 2033
- Figure 14: Asia Aerospace and Defense NDT Industry Revenue (Million), by Type 2025 & 2033
- Figure 15: Asia Aerospace and Defense NDT Industry Revenue Share (%), by Type 2025 & 2033
- Figure 16: Asia Aerospace and Defense NDT Industry Revenue (Million), by Technology 2025 & 2033
- Figure 17: Asia Aerospace and Defense NDT Industry Revenue Share (%), by Technology 2025 & 2033
- Figure 18: Asia Aerospace and Defense NDT Industry Revenue (Million), by Country 2025 & 2033
- Figure 19: Asia Aerospace and Defense NDT Industry Revenue Share (%), by Country 2025 & 2033
- Figure 20: Australia and New Zealand Aerospace and Defense NDT Industry Revenue (Million), by Type 2025 & 2033
- Figure 21: Australia and New Zealand Aerospace and Defense NDT Industry Revenue Share (%), by Type 2025 & 2033
- Figure 22: Australia and New Zealand Aerospace and Defense NDT Industry Revenue (Million), by Technology 2025 & 2033
- Figure 23: Australia and New Zealand Aerospace and Defense NDT Industry Revenue Share (%), by Technology 2025 & 2033
- Figure 24: Australia and New Zealand Aerospace and Defense NDT Industry Revenue (Million), by Country 2025 & 2033
- Figure 25: Australia and New Zealand Aerospace and Defense NDT Industry Revenue Share (%), by Country 2025 & 2033
- Figure 26: Latin America Aerospace and Defense NDT Industry Revenue (Million), by Type 2025 & 2033
- Figure 27: Latin America Aerospace and Defense NDT Industry Revenue Share (%), by Type 2025 & 2033
- Figure 28: Latin America Aerospace and Defense NDT Industry Revenue (Million), by Technology 2025 & 2033
- Figure 29: Latin America Aerospace and Defense NDT Industry Revenue Share (%), by Technology 2025 & 2033
- Figure 30: Latin America Aerospace and Defense NDT Industry Revenue (Million), by Country 2025 & 2033
- Figure 31: Latin America Aerospace and Defense NDT Industry Revenue Share (%), by Country 2025 & 2033
- Figure 32: Middle East and Africa Aerospace and Defense NDT Industry Revenue (Million), by Type 2025 & 2033
- Figure 33: Middle East and Africa Aerospace and Defense NDT Industry Revenue Share (%), by Type 2025 & 2033
- Figure 34: Middle East and Africa Aerospace and Defense NDT Industry Revenue (Million), by Technology 2025 & 2033
- Figure 35: Middle East and Africa Aerospace and Defense NDT Industry Revenue Share (%), by Technology 2025 & 2033
- Figure 36: Middle East and Africa Aerospace and Defense NDT Industry Revenue (Million), by Country 2025 & 2033
- Figure 37: Middle East and Africa Aerospace and Defense NDT Industry Revenue Share (%), by Country 2025 & 2033
List of Tables
- Table 1: Global Aerospace and Defense NDT Industry Revenue Million Forecast, by Type 2020 & 2033
- Table 2: Global Aerospace and Defense NDT Industry Revenue Million Forecast, by Technology 2020 & 2033
- Table 3: Global Aerospace and Defense NDT Industry Revenue Million Forecast, by Region 2020 & 2033
- Table 4: Global Aerospace and Defense NDT Industry Revenue Million Forecast, by Type 2020 & 2033
- Table 5: Global Aerospace and Defense NDT Industry Revenue Million Forecast, by Technology 2020 & 2033
- Table 6: Global Aerospace and Defense NDT Industry Revenue Million Forecast, by Country 2020 & 2033
- Table 7: Global Aerospace and Defense NDT Industry Revenue Million Forecast, by Type 2020 & 2033
- Table 8: Global Aerospace and Defense NDT Industry Revenue Million Forecast, by Technology 2020 & 2033
- Table 9: Global Aerospace and Defense NDT Industry Revenue Million Forecast, by Country 2020 & 2033
- Table 10: Global Aerospace and Defense NDT Industry Revenue Million Forecast, by Type 2020 & 2033
- Table 11: Global Aerospace and Defense NDT Industry Revenue Million Forecast, by Technology 2020 & 2033
- Table 12: Global Aerospace and Defense NDT Industry Revenue Million Forecast, by Country 2020 & 2033
- Table 13: Global Aerospace and Defense NDT Industry Revenue Million Forecast, by Type 2020 & 2033
- Table 14: Global Aerospace and Defense NDT Industry Revenue Million Forecast, by Technology 2020 & 2033
- Table 15: Global Aerospace and Defense NDT Industry Revenue Million Forecast, by Country 2020 & 2033
- Table 16: Global Aerospace and Defense NDT Industry Revenue Million Forecast, by Type 2020 & 2033
- Table 17: Global Aerospace and Defense NDT Industry Revenue Million Forecast, by Technology 2020 & 2033
- Table 18: Global Aerospace and Defense NDT Industry Revenue Million Forecast, by Country 2020 & 2033
- Table 19: Global Aerospace and Defense NDT Industry Revenue Million Forecast, by Type 2020 & 2033
- Table 20: Global Aerospace and Defense NDT Industry Revenue Million Forecast, by Technology 2020 & 2033
- Table 21: Global Aerospace and Defense NDT Industry Revenue Million Forecast, by Country 2020 & 2033
Frequently Asked Questions
1. What is the projected Compound Annual Growth Rate (CAGR) of the Aerospace and Defense NDT Industry?
The projected CAGR is approximately 15.74%.
2. Which companies are prominent players in the Aerospace and Defense NDT Industry?
Key companies in the market include Fujifilm NDT Systems, Intertek Group PLC, Magnaflux Corporation, Yxlon International GmbH, Team Inc, SGS Group, TUV Rheinland Ag, NikonMetrology Inc, Mistras Group, Olympus Corporation, GE Measurement and Control, Applus Services S A, FLIR Systems Inc *List Not Exhaustive, Gould-Bass Co.
3. What are the main segments of the Aerospace and Defense NDT Industry?
The market segments include Type, Technology.
4. Can you provide details about the market size?
The market size is estimated to be USD 9.11 Million as of 2022.
5. What are some drivers contributing to market growth?
Increasing Investments in Aerospace & Defense; Increasing Complexity of Machine and Infrastructure.
6. What are the notable trends driving market growth?
Radiography Testing Technology to Account for the Largest Share.
7. Are there any restraints impacting market growth?
Lack Of Technical Workforce; Relative Lack of Awareness.
8. Can you provide examples of recent developments in the market?
March 2024 – Eddyfi Technologies, a player in the global non-destructive testing (NDT) solutions market, unveils TubePro 6, its advanced pre-inspection and reporting software. TubePro 6 is equipping organizations with advanced tools. These features promise unmatched insights and operational efficiency, particularly in heat exchanger inspections.
9. What pricing options are available for accessing the report?
Pricing options include single-user, multi-user, and enterprise licenses priced at USD 4750, USD 5250, and USD 8750 respectively.
10. Is the market size provided in terms of value or volume?
The market size is provided in terms of value, measured in Million.
11. Are there any specific market keywords associated with the report?
Yes, the market keyword associated with the report is "Aerospace and Defense NDT Industry," which aids in identifying and referencing the specific market segment covered.
12. How do I determine which pricing option suits my needs best?
The pricing options vary based on user requirements and access needs. Individual users may opt for single-user licenses, while businesses requiring broader access may choose multi-user or enterprise licenses for cost-effective access to the report.
13. Are there any additional resources or data provided in the Aerospace and Defense NDT Industry report?
While the report offers comprehensive insights, it's advisable to review the specific contents or supplementary materials provided to ascertain if additional resources or data are available.
14. How can I stay updated on further developments or reports in the Aerospace and Defense NDT Industry?
To stay informed about further developments, trends, and reports in the Aerospace and Defense NDT Industry, consider subscribing to industry newsletters, following relevant companies and organizations, or regularly checking reputable industry news sources and publications.
Methodology
Step 1 - Identification of Relevant Samples Size from Population Database


Step 2 - Approaches for Defining Global Market Size (Value, Volume* & Price*)

Note*: In applicable scenarios
Step 3 - Data Sources
Primary Research
- Web Analytics
- Survey Reports
- Research Institute
- Latest Research Reports
- Opinion Leaders
Secondary Research
- Annual Reports
- White Paper
- Latest Press Release
- Industry Association
- Paid Database
- Investor Presentations

Step 4 - Data Triangulation
Involves using different sources of information in order to increase the validity of a study
These sources are likely to be stakeholders in a program - participants, other researchers, program staff, other community members, and so on.
Then we put all data in single framework & apply various statistical tools to find out the dynamic on the market.
During the analysis stage, feedback from the stakeholder groups would be compared to determine areas of agreement as well as areas of divergence