

Key Insights
The Secure Access Service Edge (SASE) market is experiencing robust growth, driven by the increasing adoption of cloud-based applications, remote workforces, and the need for enhanced cybersecurity in a distributed environment. The market's Compound Annual Growth Rate (CAGR) of 20.48% from 2019 to 2024 suggests a significant expansion, projecting substantial market size by 2033. Key drivers include the rising prevalence of cyber threats, the need for improved network security and performance, and the simplification of IT infrastructure management offered by SASE solutions. The BFSI, IT and Telecom, and Retail sectors are currently major adopters, but growth is expected across all verticals as organizations prioritize digital transformation and secure access. The Network as a Service (NaaS) and Security as a Service (SaaS) offerings within SASE are experiencing particularly strong demand, fueled by their scalability, flexibility, and cost-effectiveness. Large enterprises are currently leading adoption, but the market is expanding rapidly among Small and Medium Enterprises (SMEs) due to increasing awareness of cybersecurity risks and the availability of more accessible SASE solutions. North America currently holds a dominant market share, but significant growth is anticipated in the Asia Pacific region driven by increasing digitalization and investments in IT infrastructure.
The competitive landscape is highly dynamic, with established players like Cisco, Palo Alto Networks, and Fortinet competing alongside emerging vendors like Cato Networks and Cloudflare. Differentiation is occurring through advanced features, such as AI-powered threat detection, zero trust network access, and integrated SD-WAN capabilities. However, challenges remain, including the complexity of integrating SASE solutions with existing infrastructure, the potential for vendor lock-in, and the need for skilled professionals to manage and maintain these systems. Despite these hurdles, the long-term outlook for the SASE market remains exceptionally positive, with sustained growth expected throughout the forecast period (2025-2033) driven by ongoing technological advancements and the increasing reliance on secure, cloud-centric environments. The market is projected to continue its strong expansion trajectory, presenting lucrative opportunities for established and emerging vendors alike.
Secure Access Service Edge (SASE) Industry Report: A Comprehensive Market Analysis (2019-2033)
This comprehensive report provides an in-depth analysis of the Secure Access Service Edge (SASE) industry, offering actionable insights for stakeholders across the value chain. With a study period spanning 2019-2033, a base year of 2025, and a forecast period of 2025-2033, this report meticulously examines market dynamics, key players, emerging trends, and future growth prospects. The global SASE market is projected to reach xx Million by 2033, exhibiting a CAGR of xx% during the forecast period.
Secure Access Service Edge Industry Market Concentration & Dynamics
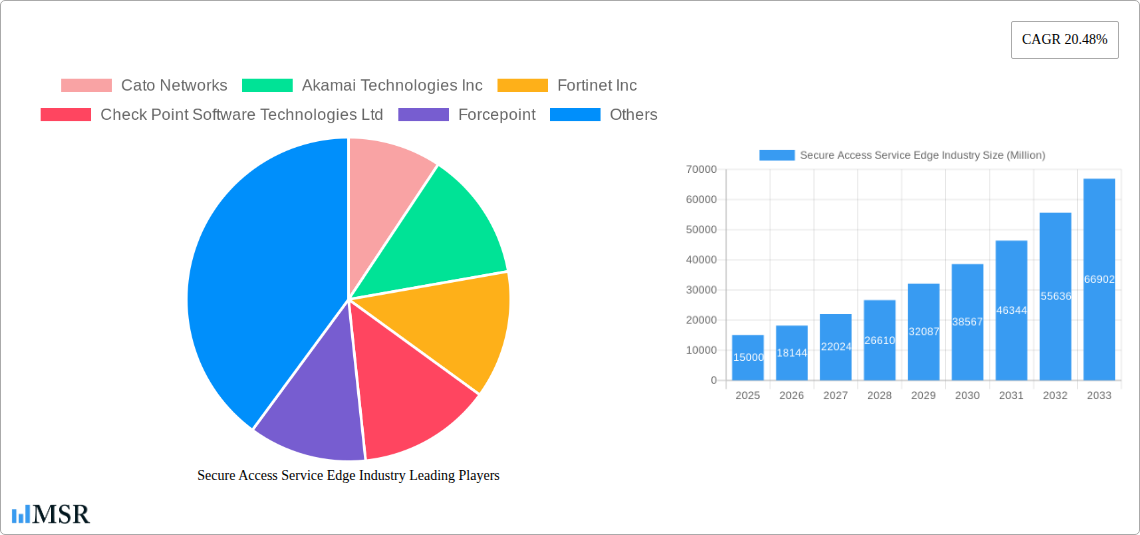
The SASE market exhibits a moderately concentrated landscape, with several major players vying for market share. However, the emergence of numerous niche players and innovative startups is gradually increasing competition. The market's dynamism is shaped by several factors including rapid technological advancements, evolving regulatory frameworks, and a growing demand for secure remote access solutions. Market share is currently dominated by established players like Cato Networks, Akamai Technologies Inc, and Fortinet Inc, each holding significant portions of the market. However, the exact percentages are constantly shifting due to intense competition and the rapid pace of innovation.
- Market Concentration: Moderately concentrated, with a few dominant players and many smaller competitors. The Herfindahl-Hirschman Index (HHI) is estimated to be around xx.
- Innovation Ecosystems: Highly dynamic, with ongoing R&D in areas like AI-driven security, Zero Trust Network Access (ZTNA), and cloud-native architectures.
- Regulatory Frameworks: Evolving data privacy regulations (like GDPR and CCPA) significantly influence SASE adoption and vendor strategies.
- Substitute Products: Traditional VPNs and on-premise security appliances are being gradually replaced by SASE solutions.
- End-User Trends: Growing adoption of remote work, cloud applications, and IoT devices are driving demand for SASE.
- M&A Activities: The number of M&A deals in the SASE space is expected to remain at xx Million during the forecast period, primarily driven by larger vendors acquiring smaller specialized companies.
Secure Access Service Edge Industry Insights & Trends
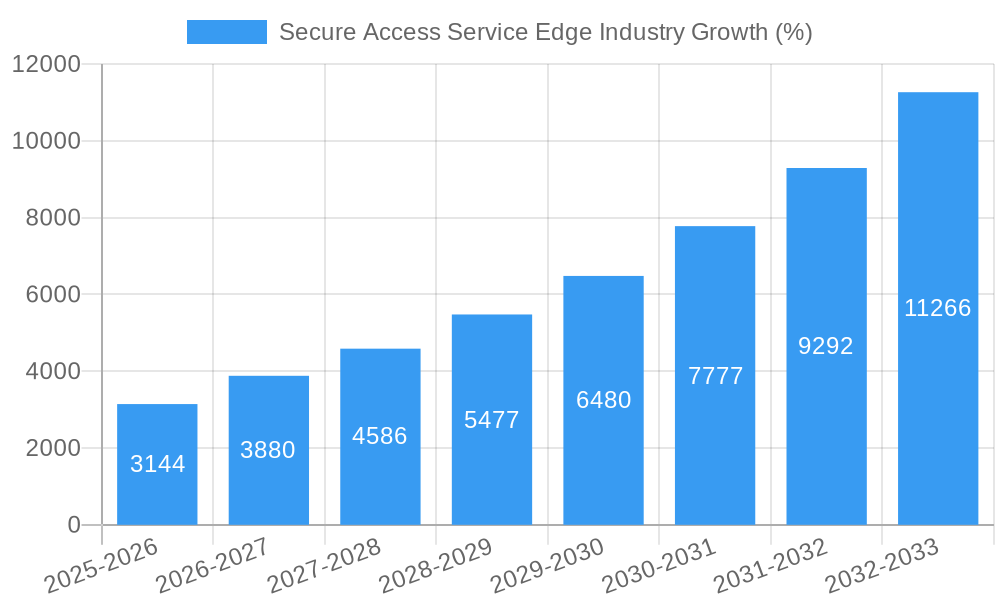
The SASE market is experiencing explosive growth, fueled by several key drivers. The increasing adoption of cloud-based applications, the rise of remote work, and the escalating need for robust security solutions are major catalysts. The market is witnessing technological disruptions as AI and machine learning are integrated into SASE platforms to enhance threat detection and response capabilities. The evolving consumer behaviors, particularly increased reliance on mobile devices and the demand for seamless and secure access across multiple platforms, further amplify market growth.
The global SASE market size reached xx Million in 2024 and is projected to reach xx Million by 2033, exhibiting a significant Compound Annual Growth Rate (CAGR) of xx%. This growth is primarily driven by the increasing adoption of cloud-based applications, the rise of remote work models, and the growing concerns around cybersecurity threats. Furthermore, the convergence of networking and security functionalities offered by SASE solutions is creating a streamlined approach to enterprise security, attracting a wider range of customers.
Key Markets & Segments Leading Secure Access Service Edge Industry
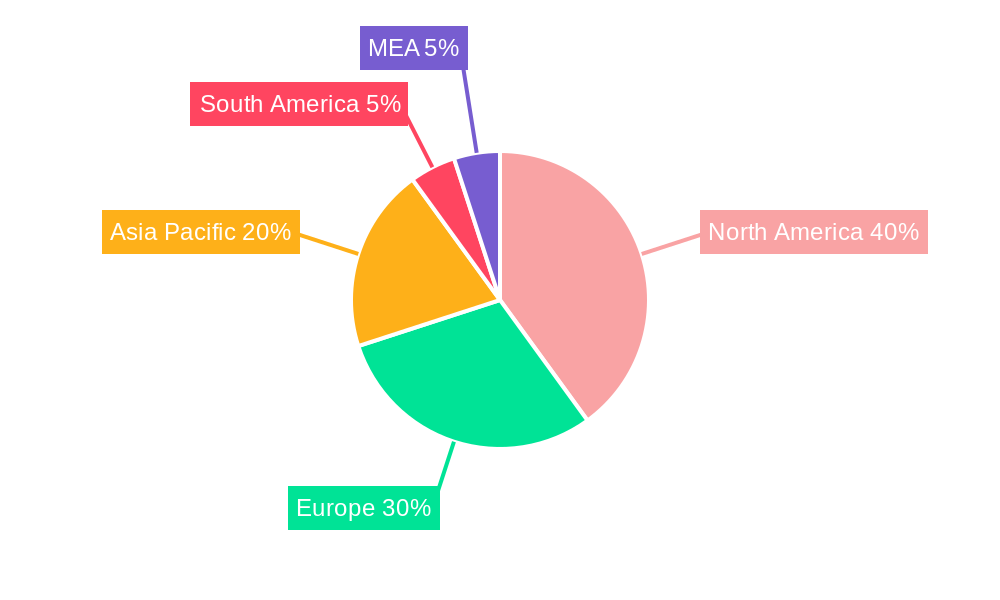
The North American region currently holds the largest market share in the SASE industry, driven by high technological advancements, strong government initiatives focused on cybersecurity, and a significant number of large enterprises adopting cloud-based applications. However, other regions, particularly Europe and Asia-Pacific, are witnessing rapid growth due to increasing digitalization and rising investments in cybersecurity infrastructure.
Key Market Drivers:
- By End-user Vertical: BFSI, IT and Telecom, and Government sectors are driving strong SASE adoption due to stringent regulatory requirements and critical data protection needs. Manufacturing and Healthcare are showing significant growth in SASE adoption.
- By Offering Type: Security as a Service (SECaaS) is currently leading the market, however, Network as a Service (NaaS) is witnessing substantial growth.
- By Organization Size: Large enterprises dominate SASE adoption, but there's significant potential in Small and Medium Enterprises (SMEs) as they increasingly adopt cloud solutions.
Dominance Analysis:
The dominance of North America in the SASE market stems from a strong tech ecosystem, high investment in cybersecurity, and mature cloud adoption rates within the enterprise sector.
Secure Access Service Edge Industry Product Developments
The SASE market is characterized by continuous product innovation, with vendors focusing on enhancing security features, improving scalability, and integrating advanced technologies like AI and machine learning. New offerings emphasize simplified deployment, improved user experience, and enhanced threat protection capabilities to maintain a competitive edge. Integration with other security tools and cloud platforms is also a critical focus.
Challenges in the Secure Access Service Edge Industry Market
The SASE market faces several challenges including integrating legacy systems with cloud-native SASE solutions, managing complex security policies across distributed environments, ensuring interoperability across different platforms, and addressing vendor lock-in concerns. The high initial investment costs can also hinder wider adoption, particularly among SMEs. Additionally, regulatory compliance complexities and the talent shortage in cybersecurity expertise pose further hurdles. These challenges could potentially slow the market growth rate by xx% in the next 5 years.
Forces Driving Secure Access Service Edge Industry Growth
The key growth drivers for the SASE market include the increasing adoption of cloud-based services, the rise of remote work, the proliferation of IoT devices, and a growing awareness of cybersecurity risks. Government initiatives promoting digital transformation and cybersecurity regulations further accelerate the market expansion. For instance, the increased emphasis on Zero Trust security architectures and the need for unified security and network management are pushing organizations towards adopting SASE solutions.
Long-Term Growth Catalysts in Secure Access Service Edge Industry
Long-term growth in the SASE market will be driven by continuous technological advancements, strategic partnerships between SASE vendors and cloud providers, and the expansion of SASE solutions into new markets and verticals. Innovation in areas such as AI-powered security analytics, enhanced threat detection, and improved user experience will remain crucial. Furthermore, collaborations with managed service providers to offer managed SASE services will expand market reach.
Emerging Opportunities in Secure Access Service Edge Industry
Emerging opportunities in the SASE industry include the integration of SASE with edge computing platforms, providing secure access to IoT devices and edge applications. The growing adoption of 5G networks opens opportunities for deploying SASE solutions in diverse environments, and developing SASE solutions tailored for specific industry verticals will fuel further growth. Furthermore, the adoption of SASE in smaller organizations will be a significant untapped market.
Leading Players in the Secure Access Service Edge Industry Sector
- Cato Networks
- Akamai Technologies Inc
- Fortinet Inc
- Check Point Software Technologies Ltd
- Forcepoint
- Cisco Systems Inc
- VMWare Inc
- Palo Alto Networks
- Versa Networks Inc
- Cloudflare Inc
Key Milestones in Secure Access Service Edge Industry
- August 2023: Carlsberg Group's selection of Cato Networks for a global SASE deployment, encompassing 200 locations and 25,000 remote users, highlights the increasing adoption of single-vendor SASE solutions by large enterprises. This underscores the market shift towards cloud-native security capabilities.
- May 2023: Kyndryl's launch of a managed SASE solution powered by Fortinet signifies the growing importance of managed services in the SASE market and highlights the increasing collaboration between IT infrastructure providers and SASE vendors.
Strategic Outlook for Secure Access Service Edge Industry Market
The SASE market holds immense potential for future growth, driven by continued technological advancements, increasing demand for secure remote access solutions, and the expansion into new markets and verticals. Strategic partnerships, acquisitions, and investments in R&D will shape the competitive landscape, and vendors focusing on innovation, scalability, and seamless integration will be best positioned for success. The convergence of networking and security will remain a key trend shaping the future of the SASE market.
Secure Access Service Edge Industry Segmentation
-
1. Offering Type
- 1.1. Network as a Service
- 1.2. Security as a Service
-
2. Organization Size
- 2.1. Large Enterprises
- 2.2. Small and Medium Enterprises
-
3. End-user Vertical
- 3.1. BFSI
- 3.2. IT and Telecom
- 3.3. Retail
- 3.4. Healthcare
- 3.5. Government
- 3.6. Manufacturing
- 3.7. Other End-user Verticals
Secure Access Service Edge Industry Segmentation By Geography
-
1. North America
- 1.1. United States
- 1.2. Canada
-
2. Europe
- 2.1. Germany
- 2.2. United Kingdom
- 2.3. France
- 2.4. Spain
- 2.5. Italy
- 2.6. Belgium
- 2.7. Netherlands
- 2.8. Luxembourg
- 2.9. Denmark
- 2.10. Finland
- 2.11. Norway
- 2.12. Sweden
- 2.13. Iceland
-
3. Asia
- 3.1. India
- 3.2. China
- 3.3. Japan
- 3.4. Taiwan
- 3.5. South Korea
- 3.6. Malaysia
- 3.7. Hong Kong
- 3.8. Australia and New Zealand
- 4. Latin America
- 5. Middle East and Africa
Secure Access Service Edge Industry REPORT HIGHLIGHTS
| Aspects | Details |
|---|---|
| Study Period | 2019-2033 |
| Base Year | 2024 |
| Estimated Year | 2025 |
| Forecast Period | 2025-2033 |
| Historical Period | 2019-2024 |
| Growth Rate | CAGR of 20.48% from 2019-2033 |
| Segmentation |
|
Table of Contents
- 1. Introduction
- 1.1. Research Scope
- 1.2. Market Segmentation
- 1.3. Research Methodology
- 1.4. Definitions and Assumptions
- 2. Executive Summary
- 2.1. Introduction
- 3. Market Dynamics
- 3.1. Introduction
- 3.2. Market Drivers
- 3.2.1 Growing Need For a Single Network Architecture that Combines SD-WAN
- 3.2.2 FWaaS
- 3.2.3 SWG
- 3.2.4 CASB
- 3.2.5 and ZTNA Capabilities; Lack of Security Procedures and Tools; Mandatory Compliance with Data Protection and Regulatory Legislation
- 3.3. Market Restrains
- 3.3.1 Lack of Knowledge of Cloud Resources
- 3.3.2 Cloud Security Architecture
- 3.3.3 and SD-WAN Strategy; High Upfront Implementation Costs and Lack of Standardization Around SASE Architecture and Its Components
- 3.4. Market Trends
- 3.4.1. Large Enterprises will Hold Major Market Shares
- 4. Market Factor Analysis
- 4.1. Porters Five Forces
- 4.2. Supply/Value Chain
- 4.3. PESTEL analysis
- 4.4. Market Entropy
- 4.5. Patent/Trademark Analysis
- 5. Global Secure Access Service Edge Industry Analysis, Insights and Forecast, 2019-2031
- 5.1. Market Analysis, Insights and Forecast - by Offering Type
- 5.1.1. Network as a Service
- 5.1.2. Security as a Service
- 5.2. Market Analysis, Insights and Forecast - by Organization Size
- 5.2.1. Large Enterprises
- 5.2.2. Small and Medium Enterprises
- 5.3. Market Analysis, Insights and Forecast - by End-user Vertical
- 5.3.1. BFSI
- 5.3.2. IT and Telecom
- 5.3.3. Retail
- 5.3.4. Healthcare
- 5.3.5. Government
- 5.3.6. Manufacturing
- 5.3.7. Other End-user Verticals
- 5.4. Market Analysis, Insights and Forecast - by Region
- 5.4.1. North America
- 5.4.2. Europe
- 5.4.3. Asia
- 5.4.4. Latin America
- 5.4.5. Middle East and Africa
- 5.1. Market Analysis, Insights and Forecast - by Offering Type
- 6. North America Secure Access Service Edge Industry Analysis, Insights and Forecast, 2019-2031
- 6.1. Market Analysis, Insights and Forecast - by Offering Type
- 6.1.1. Network as a Service
- 6.1.2. Security as a Service
- 6.2. Market Analysis, Insights and Forecast - by Organization Size
- 6.2.1. Large Enterprises
- 6.2.2. Small and Medium Enterprises
- 6.3. Market Analysis, Insights and Forecast - by End-user Vertical
- 6.3.1. BFSI
- 6.3.2. IT and Telecom
- 6.3.3. Retail
- 6.3.4. Healthcare
- 6.3.5. Government
- 6.3.6. Manufacturing
- 6.3.7. Other End-user Verticals
- 6.1. Market Analysis, Insights and Forecast - by Offering Type
- 7. Europe Secure Access Service Edge Industry Analysis, Insights and Forecast, 2019-2031
- 7.1. Market Analysis, Insights and Forecast - by Offering Type
- 7.1.1. Network as a Service
- 7.1.2. Security as a Service
- 7.2. Market Analysis, Insights and Forecast - by Organization Size
- 7.2.1. Large Enterprises
- 7.2.2. Small and Medium Enterprises
- 7.3. Market Analysis, Insights and Forecast - by End-user Vertical
- 7.3.1. BFSI
- 7.3.2. IT and Telecom
- 7.3.3. Retail
- 7.3.4. Healthcare
- 7.3.5. Government
- 7.3.6. Manufacturing
- 7.3.7. Other End-user Verticals
- 7.1. Market Analysis, Insights and Forecast - by Offering Type
- 8. Asia Secure Access Service Edge Industry Analysis, Insights and Forecast, 2019-2031
- 8.1. Market Analysis, Insights and Forecast - by Offering Type
- 8.1.1. Network as a Service
- 8.1.2. Security as a Service
- 8.2. Market Analysis, Insights and Forecast - by Organization Size
- 8.2.1. Large Enterprises
- 8.2.2. Small and Medium Enterprises
- 8.3. Market Analysis, Insights and Forecast - by End-user Vertical
- 8.3.1. BFSI
- 8.3.2. IT and Telecom
- 8.3.3. Retail
- 8.3.4. Healthcare
- 8.3.5. Government
- 8.3.6. Manufacturing
- 8.3.7. Other End-user Verticals
- 8.1. Market Analysis, Insights and Forecast - by Offering Type
- 9. Latin America Secure Access Service Edge Industry Analysis, Insights and Forecast, 2019-2031
- 9.1. Market Analysis, Insights and Forecast - by Offering Type
- 9.1.1. Network as a Service
- 9.1.2. Security as a Service
- 9.2. Market Analysis, Insights and Forecast - by Organization Size
- 9.2.1. Large Enterprises
- 9.2.2. Small and Medium Enterprises
- 9.3. Market Analysis, Insights and Forecast - by End-user Vertical
- 9.3.1. BFSI
- 9.3.2. IT and Telecom
- 9.3.3. Retail
- 9.3.4. Healthcare
- 9.3.5. Government
- 9.3.6. Manufacturing
- 9.3.7. Other End-user Verticals
- 9.1. Market Analysis, Insights and Forecast - by Offering Type
- 10. Middle East and Africa Secure Access Service Edge Industry Analysis, Insights and Forecast, 2019-2031
- 10.1. Market Analysis, Insights and Forecast - by Offering Type
- 10.1.1. Network as a Service
- 10.1.2. Security as a Service
- 10.2. Market Analysis, Insights and Forecast - by Organization Size
- 10.2.1. Large Enterprises
- 10.2.2. Small and Medium Enterprises
- 10.3. Market Analysis, Insights and Forecast - by End-user Vertical
- 10.3.1. BFSI
- 10.3.2. IT and Telecom
- 10.3.3. Retail
- 10.3.4. Healthcare
- 10.3.5. Government
- 10.3.6. Manufacturing
- 10.3.7. Other End-user Verticals
- 10.1. Market Analysis, Insights and Forecast - by Offering Type
- 11. North America Secure Access Service Edge Industry Analysis, Insights and Forecast, 2019-2031
- 11.1. Market Analysis, Insights and Forecast - By Country/Sub-region
- 11.1.1 United States
- 11.1.2 Canada
- 11.1.3 Mexico
- 12. Europe Secure Access Service Edge Industry Analysis, Insights and Forecast, 2019-2031
- 12.1. Market Analysis, Insights and Forecast - By Country/Sub-region
- 12.1.1 Germany
- 12.1.2 United Kingdom
- 12.1.3 France
- 12.1.4 Spain
- 12.1.5 Italy
- 12.1.6 Spain
- 12.1.7 Belgium
- 12.1.8 Netherland
- 12.1.9 Nordics
- 12.1.10 Rest of Europe
- 13. Asia Pacific Secure Access Service Edge Industry Analysis, Insights and Forecast, 2019-2031
- 13.1. Market Analysis, Insights and Forecast - By Country/Sub-region
- 13.1.1 China
- 13.1.2 Japan
- 13.1.3 India
- 13.1.4 South Korea
- 13.1.5 Southeast Asia
- 13.1.6 Australia
- 13.1.7 Indonesia
- 13.1.8 Phillipes
- 13.1.9 Singapore
- 13.1.10 Thailandc
- 13.1.11 Rest of Asia Pacific
- 14. South America Secure Access Service Edge Industry Analysis, Insights and Forecast, 2019-2031
- 14.1. Market Analysis, Insights and Forecast - By Country/Sub-region
- 14.1.1 Brazil
- 14.1.2 Argentina
- 14.1.3 Peru
- 14.1.4 Chile
- 14.1.5 Colombia
- 14.1.6 Ecuador
- 14.1.7 Venezuela
- 14.1.8 Rest of South America
- 15. North America Secure Access Service Edge Industry Analysis, Insights and Forecast, 2019-2031
- 15.1. Market Analysis, Insights and Forecast - By Country/Sub-region
- 15.1.1 United States
- 15.1.2 Canada
- 15.1.3 Mexico
- 16. MEA Secure Access Service Edge Industry Analysis, Insights and Forecast, 2019-2031
- 16.1. Market Analysis, Insights and Forecast - By Country/Sub-region
- 16.1.1 United Arab Emirates
- 16.1.2 Saudi Arabia
- 16.1.3 South Africa
- 16.1.4 Rest of Middle East and Africa
- 17. Competitive Analysis
- 17.1. Global Market Share Analysis 2024
- 17.2. Company Profiles
- 17.2.1 Cato Networks
- 17.2.1.1. Overview
- 17.2.1.2. Products
- 17.2.1.3. SWOT Analysis
- 17.2.1.4. Recent Developments
- 17.2.1.5. Financials (Based on Availability)
- 17.2.2 Akamai Technologies Inc
- 17.2.2.1. Overview
- 17.2.2.2. Products
- 17.2.2.3. SWOT Analysis
- 17.2.2.4. Recent Developments
- 17.2.2.5. Financials (Based on Availability)
- 17.2.3 Fortinet Inc
- 17.2.3.1. Overview
- 17.2.3.2. Products
- 17.2.3.3. SWOT Analysis
- 17.2.3.4. Recent Developments
- 17.2.3.5. Financials (Based on Availability)
- 17.2.4 Check Point Software Technologies Ltd
- 17.2.4.1. Overview
- 17.2.4.2. Products
- 17.2.4.3. SWOT Analysis
- 17.2.4.4. Recent Developments
- 17.2.4.5. Financials (Based on Availability)
- 17.2.5 Forcepoint
- 17.2.5.1. Overview
- 17.2.5.2. Products
- 17.2.5.3. SWOT Analysis
- 17.2.5.4. Recent Developments
- 17.2.5.5. Financials (Based on Availability)
- 17.2.6 Cisco Systems Inc
- 17.2.6.1. Overview
- 17.2.6.2. Products
- 17.2.6.3. SWOT Analysis
- 17.2.6.4. Recent Developments
- 17.2.6.5. Financials (Based on Availability)
- 17.2.7 VMWare Inc
- 17.2.7.1. Overview
- 17.2.7.2. Products
- 17.2.7.3. SWOT Analysis
- 17.2.7.4. Recent Developments
- 17.2.7.5. Financials (Based on Availability)
- 17.2.8 Palo Alto Networks
- 17.2.8.1. Overview
- 17.2.8.2. Products
- 17.2.8.3. SWOT Analysis
- 17.2.8.4. Recent Developments
- 17.2.8.5. Financials (Based on Availability)
- 17.2.9 Versa Networks Inc
- 17.2.9.1. Overview
- 17.2.9.2. Products
- 17.2.9.3. SWOT Analysis
- 17.2.9.4. Recent Developments
- 17.2.9.5. Financials (Based on Availability)
- 17.2.10 Cloudflare Inc
- 17.2.10.1. Overview
- 17.2.10.2. Products
- 17.2.10.3. SWOT Analysis
- 17.2.10.4. Recent Developments
- 17.2.10.5. Financials (Based on Availability)
- 17.2.1 Cato Networks
List of Figures
- Figure 1: Global Secure Access Service Edge Industry Revenue Breakdown (Million, %) by Region 2024 & 2032
- Figure 2: North America Secure Access Service Edge Industry Revenue (Million), by Country 2024 & 2032
- Figure 3: North America Secure Access Service Edge Industry Revenue Share (%), by Country 2024 & 2032
- Figure 4: Europe Secure Access Service Edge Industry Revenue (Million), by Country 2024 & 2032
- Figure 5: Europe Secure Access Service Edge Industry Revenue Share (%), by Country 2024 & 2032
- Figure 6: Asia Pacific Secure Access Service Edge Industry Revenue (Million), by Country 2024 & 2032
- Figure 7: Asia Pacific Secure Access Service Edge Industry Revenue Share (%), by Country 2024 & 2032
- Figure 8: South America Secure Access Service Edge Industry Revenue (Million), by Country 2024 & 2032
- Figure 9: South America Secure Access Service Edge Industry Revenue Share (%), by Country 2024 & 2032
- Figure 10: North America Secure Access Service Edge Industry Revenue (Million), by Country 2024 & 2032
- Figure 11: North America Secure Access Service Edge Industry Revenue Share (%), by Country 2024 & 2032
- Figure 12: MEA Secure Access Service Edge Industry Revenue (Million), by Country 2024 & 2032
- Figure 13: MEA Secure Access Service Edge Industry Revenue Share (%), by Country 2024 & 2032
- Figure 14: North America Secure Access Service Edge Industry Revenue (Million), by Offering Type 2024 & 2032
- Figure 15: North America Secure Access Service Edge Industry Revenue Share (%), by Offering Type 2024 & 2032
- Figure 16: North America Secure Access Service Edge Industry Revenue (Million), by Organization Size 2024 & 2032
- Figure 17: North America Secure Access Service Edge Industry Revenue Share (%), by Organization Size 2024 & 2032
- Figure 18: North America Secure Access Service Edge Industry Revenue (Million), by End-user Vertical 2024 & 2032
- Figure 19: North America Secure Access Service Edge Industry Revenue Share (%), by End-user Vertical 2024 & 2032
- Figure 20: North America Secure Access Service Edge Industry Revenue (Million), by Country 2024 & 2032
- Figure 21: North America Secure Access Service Edge Industry Revenue Share (%), by Country 2024 & 2032
- Figure 22: Europe Secure Access Service Edge Industry Revenue (Million), by Offering Type 2024 & 2032
- Figure 23: Europe Secure Access Service Edge Industry Revenue Share (%), by Offering Type 2024 & 2032
- Figure 24: Europe Secure Access Service Edge Industry Revenue (Million), by Organization Size 2024 & 2032
- Figure 25: Europe Secure Access Service Edge Industry Revenue Share (%), by Organization Size 2024 & 2032
- Figure 26: Europe Secure Access Service Edge Industry Revenue (Million), by End-user Vertical 2024 & 2032
- Figure 27: Europe Secure Access Service Edge Industry Revenue Share (%), by End-user Vertical 2024 & 2032
- Figure 28: Europe Secure Access Service Edge Industry Revenue (Million), by Country 2024 & 2032
- Figure 29: Europe Secure Access Service Edge Industry Revenue Share (%), by Country 2024 & 2032
- Figure 30: Asia Secure Access Service Edge Industry Revenue (Million), by Offering Type 2024 & 2032
- Figure 31: Asia Secure Access Service Edge Industry Revenue Share (%), by Offering Type 2024 & 2032
- Figure 32: Asia Secure Access Service Edge Industry Revenue (Million), by Organization Size 2024 & 2032
- Figure 33: Asia Secure Access Service Edge Industry Revenue Share (%), by Organization Size 2024 & 2032
- Figure 34: Asia Secure Access Service Edge Industry Revenue (Million), by End-user Vertical 2024 & 2032
- Figure 35: Asia Secure Access Service Edge Industry Revenue Share (%), by End-user Vertical 2024 & 2032
- Figure 36: Asia Secure Access Service Edge Industry Revenue (Million), by Country 2024 & 2032
- Figure 37: Asia Secure Access Service Edge Industry Revenue Share (%), by Country 2024 & 2032
- Figure 38: Latin America Secure Access Service Edge Industry Revenue (Million), by Offering Type 2024 & 2032
- Figure 39: Latin America Secure Access Service Edge Industry Revenue Share (%), by Offering Type 2024 & 2032
- Figure 40: Latin America Secure Access Service Edge Industry Revenue (Million), by Organization Size 2024 & 2032
- Figure 41: Latin America Secure Access Service Edge Industry Revenue Share (%), by Organization Size 2024 & 2032
- Figure 42: Latin America Secure Access Service Edge Industry Revenue (Million), by End-user Vertical 2024 & 2032
- Figure 43: Latin America Secure Access Service Edge Industry Revenue Share (%), by End-user Vertical 2024 & 2032
- Figure 44: Latin America Secure Access Service Edge Industry Revenue (Million), by Country 2024 & 2032
- Figure 45: Latin America Secure Access Service Edge Industry Revenue Share (%), by Country 2024 & 2032
- Figure 46: Middle East and Africa Secure Access Service Edge Industry Revenue (Million), by Offering Type 2024 & 2032
- Figure 47: Middle East and Africa Secure Access Service Edge Industry Revenue Share (%), by Offering Type 2024 & 2032
- Figure 48: Middle East and Africa Secure Access Service Edge Industry Revenue (Million), by Organization Size 2024 & 2032
- Figure 49: Middle East and Africa Secure Access Service Edge Industry Revenue Share (%), by Organization Size 2024 & 2032
- Figure 50: Middle East and Africa Secure Access Service Edge Industry Revenue (Million), by End-user Vertical 2024 & 2032
- Figure 51: Middle East and Africa Secure Access Service Edge Industry Revenue Share (%), by End-user Vertical 2024 & 2032
- Figure 52: Middle East and Africa Secure Access Service Edge Industry Revenue (Million), by Country 2024 & 2032
- Figure 53: Middle East and Africa Secure Access Service Edge Industry Revenue Share (%), by Country 2024 & 2032
List of Tables
- Table 1: Global Secure Access Service Edge Industry Revenue Million Forecast, by Region 2019 & 2032
- Table 2: Global Secure Access Service Edge Industry Revenue Million Forecast, by Offering Type 2019 & 2032
- Table 3: Global Secure Access Service Edge Industry Revenue Million Forecast, by Organization Size 2019 & 2032
- Table 4: Global Secure Access Service Edge Industry Revenue Million Forecast, by End-user Vertical 2019 & 2032
- Table 5: Global Secure Access Service Edge Industry Revenue Million Forecast, by Region 2019 & 2032
- Table 6: Global Secure Access Service Edge Industry Revenue Million Forecast, by Country 2019 & 2032
- Table 7: United States Secure Access Service Edge Industry Revenue (Million) Forecast, by Application 2019 & 2032
- Table 8: Canada Secure Access Service Edge Industry Revenue (Million) Forecast, by Application 2019 & 2032
- Table 9: Mexico Secure Access Service Edge Industry Revenue (Million) Forecast, by Application 2019 & 2032
- Table 10: Global Secure Access Service Edge Industry Revenue Million Forecast, by Country 2019 & 2032
- Table 11: Germany Secure Access Service Edge Industry Revenue (Million) Forecast, by Application 2019 & 2032
- Table 12: United Kingdom Secure Access Service Edge Industry Revenue (Million) Forecast, by Application 2019 & 2032
- Table 13: France Secure Access Service Edge Industry Revenue (Million) Forecast, by Application 2019 & 2032
- Table 14: Spain Secure Access Service Edge Industry Revenue (Million) Forecast, by Application 2019 & 2032
- Table 15: Italy Secure Access Service Edge Industry Revenue (Million) Forecast, by Application 2019 & 2032
- Table 16: Spain Secure Access Service Edge Industry Revenue (Million) Forecast, by Application 2019 & 2032
- Table 17: Belgium Secure Access Service Edge Industry Revenue (Million) Forecast, by Application 2019 & 2032
- Table 18: Netherland Secure Access Service Edge Industry Revenue (Million) Forecast, by Application 2019 & 2032
- Table 19: Nordics Secure Access Service Edge Industry Revenue (Million) Forecast, by Application 2019 & 2032
- Table 20: Rest of Europe Secure Access Service Edge Industry Revenue (Million) Forecast, by Application 2019 & 2032
- Table 21: Global Secure Access Service Edge Industry Revenue Million Forecast, by Country 2019 & 2032
- Table 22: China Secure Access Service Edge Industry Revenue (Million) Forecast, by Application 2019 & 2032
- Table 23: Japan Secure Access Service Edge Industry Revenue (Million) Forecast, by Application 2019 & 2032
- Table 24: India Secure Access Service Edge Industry Revenue (Million) Forecast, by Application 2019 & 2032
- Table 25: South Korea Secure Access Service Edge Industry Revenue (Million) Forecast, by Application 2019 & 2032
- Table 26: Southeast Asia Secure Access Service Edge Industry Revenue (Million) Forecast, by Application 2019 & 2032
- Table 27: Australia Secure Access Service Edge Industry Revenue (Million) Forecast, by Application 2019 & 2032
- Table 28: Indonesia Secure Access Service Edge Industry Revenue (Million) Forecast, by Application 2019 & 2032
- Table 29: Phillipes Secure Access Service Edge Industry Revenue (Million) Forecast, by Application 2019 & 2032
- Table 30: Singapore Secure Access Service Edge Industry Revenue (Million) Forecast, by Application 2019 & 2032
- Table 31: Thailandc Secure Access Service Edge Industry Revenue (Million) Forecast, by Application 2019 & 2032
- Table 32: Rest of Asia Pacific Secure Access Service Edge Industry Revenue (Million) Forecast, by Application 2019 & 2032
- Table 33: Global Secure Access Service Edge Industry Revenue Million Forecast, by Country 2019 & 2032
- Table 34: Brazil Secure Access Service Edge Industry Revenue (Million) Forecast, by Application 2019 & 2032
- Table 35: Argentina Secure Access Service Edge Industry Revenue (Million) Forecast, by Application 2019 & 2032
- Table 36: Peru Secure Access Service Edge Industry Revenue (Million) Forecast, by Application 2019 & 2032
- Table 37: Chile Secure Access Service Edge Industry Revenue (Million) Forecast, by Application 2019 & 2032
- Table 38: Colombia Secure Access Service Edge Industry Revenue (Million) Forecast, by Application 2019 & 2032
- Table 39: Ecuador Secure Access Service Edge Industry Revenue (Million) Forecast, by Application 2019 & 2032
- Table 40: Venezuela Secure Access Service Edge Industry Revenue (Million) Forecast, by Application 2019 & 2032
- Table 41: Rest of South America Secure Access Service Edge Industry Revenue (Million) Forecast, by Application 2019 & 2032
- Table 42: Global Secure Access Service Edge Industry Revenue Million Forecast, by Country 2019 & 2032
- Table 43: United States Secure Access Service Edge Industry Revenue (Million) Forecast, by Application 2019 & 2032
- Table 44: Canada Secure Access Service Edge Industry Revenue (Million) Forecast, by Application 2019 & 2032
- Table 45: Mexico Secure Access Service Edge Industry Revenue (Million) Forecast, by Application 2019 & 2032
- Table 46: Global Secure Access Service Edge Industry Revenue Million Forecast, by Country 2019 & 2032
- Table 47: United Arab Emirates Secure Access Service Edge Industry Revenue (Million) Forecast, by Application 2019 & 2032
- Table 48: Saudi Arabia Secure Access Service Edge Industry Revenue (Million) Forecast, by Application 2019 & 2032
- Table 49: South Africa Secure Access Service Edge Industry Revenue (Million) Forecast, by Application 2019 & 2032
- Table 50: Rest of Middle East and Africa Secure Access Service Edge Industry Revenue (Million) Forecast, by Application 2019 & 2032
- Table 51: Global Secure Access Service Edge Industry Revenue Million Forecast, by Offering Type 2019 & 2032
- Table 52: Global Secure Access Service Edge Industry Revenue Million Forecast, by Organization Size 2019 & 2032
- Table 53: Global Secure Access Service Edge Industry Revenue Million Forecast, by End-user Vertical 2019 & 2032
- Table 54: Global Secure Access Service Edge Industry Revenue Million Forecast, by Country 2019 & 2032
- Table 55: United States Secure Access Service Edge Industry Revenue (Million) Forecast, by Application 2019 & 2032
- Table 56: Canada Secure Access Service Edge Industry Revenue (Million) Forecast, by Application 2019 & 2032
- Table 57: Global Secure Access Service Edge Industry Revenue Million Forecast, by Offering Type 2019 & 2032
- Table 58: Global Secure Access Service Edge Industry Revenue Million Forecast, by Organization Size 2019 & 2032
- Table 59: Global Secure Access Service Edge Industry Revenue Million Forecast, by End-user Vertical 2019 & 2032
- Table 60: Global Secure Access Service Edge Industry Revenue Million Forecast, by Country 2019 & 2032
- Table 61: Germany Secure Access Service Edge Industry Revenue (Million) Forecast, by Application 2019 & 2032
- Table 62: United Kingdom Secure Access Service Edge Industry Revenue (Million) Forecast, by Application 2019 & 2032
- Table 63: France Secure Access Service Edge Industry Revenue (Million) Forecast, by Application 2019 & 2032
- Table 64: Spain Secure Access Service Edge Industry Revenue (Million) Forecast, by Application 2019 & 2032
- Table 65: Italy Secure Access Service Edge Industry Revenue (Million) Forecast, by Application 2019 & 2032
- Table 66: Belgium Secure Access Service Edge Industry Revenue (Million) Forecast, by Application 2019 & 2032
- Table 67: Netherlands Secure Access Service Edge Industry Revenue (Million) Forecast, by Application 2019 & 2032
- Table 68: Luxembourg Secure Access Service Edge Industry Revenue (Million) Forecast, by Application 2019 & 2032
- Table 69: Denmark Secure Access Service Edge Industry Revenue (Million) Forecast, by Application 2019 & 2032
- Table 70: Finland Secure Access Service Edge Industry Revenue (Million) Forecast, by Application 2019 & 2032
- Table 71: Norway Secure Access Service Edge Industry Revenue (Million) Forecast, by Application 2019 & 2032
- Table 72: Sweden Secure Access Service Edge Industry Revenue (Million) Forecast, by Application 2019 & 2032
- Table 73: Iceland Secure Access Service Edge Industry Revenue (Million) Forecast, by Application 2019 & 2032
- Table 74: Global Secure Access Service Edge Industry Revenue Million Forecast, by Offering Type 2019 & 2032
- Table 75: Global Secure Access Service Edge Industry Revenue Million Forecast, by Organization Size 2019 & 2032
- Table 76: Global Secure Access Service Edge Industry Revenue Million Forecast, by End-user Vertical 2019 & 2032
- Table 77: Global Secure Access Service Edge Industry Revenue Million Forecast, by Country 2019 & 2032
- Table 78: India Secure Access Service Edge Industry Revenue (Million) Forecast, by Application 2019 & 2032
- Table 79: China Secure Access Service Edge Industry Revenue (Million) Forecast, by Application 2019 & 2032
- Table 80: Japan Secure Access Service Edge Industry Revenue (Million) Forecast, by Application 2019 & 2032
- Table 81: Taiwan Secure Access Service Edge Industry Revenue (Million) Forecast, by Application 2019 & 2032
- Table 82: South Korea Secure Access Service Edge Industry Revenue (Million) Forecast, by Application 2019 & 2032
- Table 83: Malaysia Secure Access Service Edge Industry Revenue (Million) Forecast, by Application 2019 & 2032
- Table 84: Hong Kong Secure Access Service Edge Industry Revenue (Million) Forecast, by Application 2019 & 2032
- Table 85: Australia and New Zealand Secure Access Service Edge Industry Revenue (Million) Forecast, by Application 2019 & 2032
- Table 86: Global Secure Access Service Edge Industry Revenue Million Forecast, by Offering Type 2019 & 2032
- Table 87: Global Secure Access Service Edge Industry Revenue Million Forecast, by Organization Size 2019 & 2032
- Table 88: Global Secure Access Service Edge Industry Revenue Million Forecast, by End-user Vertical 2019 & 2032
- Table 89: Global Secure Access Service Edge Industry Revenue Million Forecast, by Country 2019 & 2032
- Table 90: Global Secure Access Service Edge Industry Revenue Million Forecast, by Offering Type 2019 & 2032
- Table 91: Global Secure Access Service Edge Industry Revenue Million Forecast, by Organization Size 2019 & 2032
- Table 92: Global Secure Access Service Edge Industry Revenue Million Forecast, by End-user Vertical 2019 & 2032
- Table 93: Global Secure Access Service Edge Industry Revenue Million Forecast, by Country 2019 & 2032
Frequently Asked Questions
1. What is the projected Compound Annual Growth Rate (CAGR) of the Secure Access Service Edge Industry?
The projected CAGR is approximately 20.48%.
2. Which companies are prominent players in the Secure Access Service Edge Industry?
Key companies in the market include Cato Networks, Akamai Technologies Inc, Fortinet Inc, Check Point Software Technologies Ltd, Forcepoint, Cisco Systems Inc, VMWare Inc, Palo Alto Networks, Versa Networks Inc, Cloudflare Inc.
3. What are the main segments of the Secure Access Service Edge Industry?
The market segments include Offering Type, Organization Size, End-user Vertical.
4. Can you provide details about the market size?
The market size is estimated to be USD XX Million as of 2022.
5. What are some drivers contributing to market growth?
Growing Need For a Single Network Architecture that Combines SD-WAN. FWaaS. SWG. CASB. and ZTNA Capabilities; Lack of Security Procedures and Tools; Mandatory Compliance with Data Protection and Regulatory Legislation.
6. What are the notable trends driving market growth?
Large Enterprises will Hold Major Market Shares.
7. Are there any restraints impacting market growth?
Lack of Knowledge of Cloud Resources. Cloud Security Architecture. and SD-WAN Strategy; High Upfront Implementation Costs and Lack of Standardization Around SASE Architecture and Its Components.
8. Can you provide examples of recent developments in the market?
August 2023 - Carlsberg Group selected Cato Networks for a massive global SASE deployment. Cato Networks announced Carlsberg Group as its latest enterprise customer. The third-largest brewer in the world chose a single-vendor SASE to transform its global network and security infrastructure. The Cato deployment will span over 200 locations and 25,000 remote users across the world. Instead of security appliances, Carlsberg will rely on Cato's cloud-native security capabilities, including SWG, CASB, DLP, ZTNA, FWaaS, IPS, and NGAM.
9. What pricing options are available for accessing the report?
Pricing options include single-user, multi-user, and enterprise licenses priced at USD 4750, USD 5250, and USD 8750 respectively.
10. Is the market size provided in terms of value or volume?
The market size is provided in terms of value, measured in Million.
11. Are there any specific market keywords associated with the report?
Yes, the market keyword associated with the report is "Secure Access Service Edge Industry," which aids in identifying and referencing the specific market segment covered.
12. How do I determine which pricing option suits my needs best?
The pricing options vary based on user requirements and access needs. Individual users may opt for single-user licenses, while businesses requiring broader access may choose multi-user or enterprise licenses for cost-effective access to the report.
13. Are there any additional resources or data provided in the Secure Access Service Edge Industry report?
While the report offers comprehensive insights, it's advisable to review the specific contents or supplementary materials provided to ascertain if additional resources or data are available.
14. How can I stay updated on further developments or reports in the Secure Access Service Edge Industry?
To stay informed about further developments, trends, and reports in the Secure Access Service Edge Industry, consider subscribing to industry newsletters, following relevant companies and organizations, or regularly checking reputable industry news sources and publications.
Methodology
Step 1 - Identification of Relevant Samples Size from Population Database


Step 2 - Approaches for Defining Global Market Size (Value, Volume* & Price*)

Note*: In applicable scenarios
Step 3 - Data Sources
Primary Research
- Web Analytics
- Survey Reports
- Research Institute
- Latest Research Reports
- Opinion Leaders
Secondary Research
- Annual Reports
- White Paper
- Latest Press Release
- Industry Association
- Paid Database
- Investor Presentations

Step 4 - Data Triangulation
Involves using different sources of information in order to increase the validity of a study
These sources are likely to be stakeholders in a program - participants, other researchers, program staff, other community members, and so on.
Then we put all data in single framework & apply various statistical tools to find out the dynamic on the market.
During the analysis stage, feedback from the stakeholder groups would be compared to determine areas of agreement as well as areas of divergence
