

Key Insights
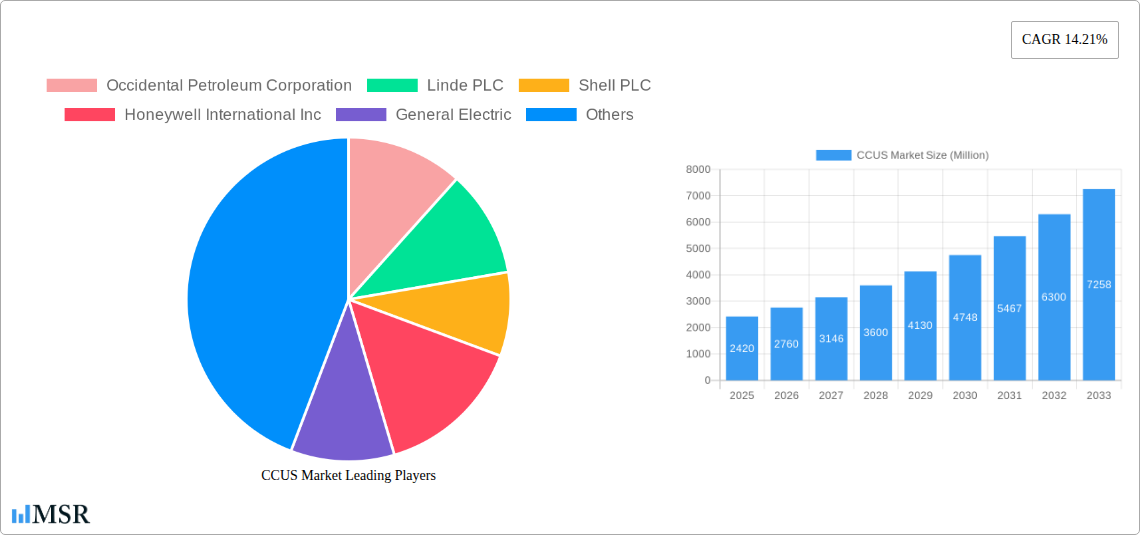
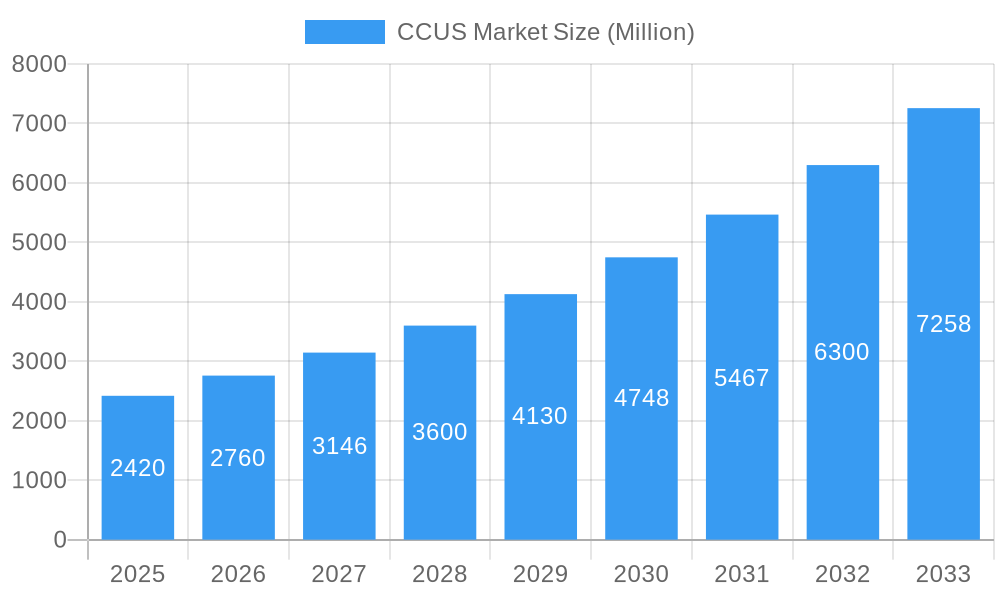
The Carbon Capture, Utilization, and Storage (CCUS) market is experiencing robust growth, projected to reach \$2.42 billion in 2025 and maintain a Compound Annual Growth Rate (CAGR) of 14.21% from 2025 to 2033. This expansion is driven by increasing global concerns about climate change and stringent government regulations aimed at reducing carbon emissions. The energy sector, particularly oil and gas, coal and biomass power plants, and iron and steel industries, represent significant end-user segments, actively seeking CCUS technologies to minimize their environmental footprint. Technological advancements in pre-combustion, oxy-fuel combustion, and post-combustion capture methods are further fueling market growth. The United States, with its diverse energy landscape and geographically spread industrial base across regions like the Northeast, Southeast, Midwest, Southwest, and West, presents a substantial market opportunity. Major players like Occidental Petroleum, Linde PLC, Shell PLC, and others are investing heavily in research, development, and deployment of CCUS solutions, fostering competition and innovation within the market. Despite significant growth, challenges such as high capital costs associated with CCUS infrastructure and the need for robust carbon transportation and storage networks continue to act as restraints on widespread adoption. However, government incentives, carbon pricing mechanisms, and technological improvements are gradually mitigating these limitations.
CCUS Market Market Size (In Billion)
The future of the CCUS market looks promising, particularly with the increasing emphasis on achieving net-zero emissions targets. The market is expected to witness continued expansion across various end-user industries and geographical locations. The development and adoption of more efficient and cost-effective capture technologies, along with supportive policy frameworks, will be crucial drivers in shaping the future trajectory of the CCUS market. Furthermore, exploring carbon utilization pathways, which convert captured CO2 into valuable products, is poised to open up new avenues for revenue generation and market growth. Continued innovation, collaboration among stakeholders, and sustained policy support will be essential for unlocking the full potential of CCUS in mitigating climate change and driving sustainable economic development.
CCUS Market Company Market Share
CCUS Market Report: A Comprehensive Analysis (2019-2033)
This comprehensive report provides an in-depth analysis of the Carbon Capture, Utilization, and Storage (CCUS) market, offering invaluable insights for stakeholders across the value chain. The study covers the period from 2019 to 2033, with a focus on the 2025-2033 forecast period, incorporating key industry developments and competitive landscapes. The market is segmented by end-user industry (Oil and Gas, Coal and Biomass Power Plant, Iron and Steel, Chemical, Cement) and technology (Pre-combustion Capture, Oxy-fuel Combustion Capture, Post-combustion Capture). Leading players such as Occidental Petroleum Corporation, Linde PLC, Shell PLC, and many others are profiled, highlighting their strategies and market positions. This report is essential for investors, businesses, and policymakers seeking to understand and navigate the dynamic CCUS market. The projected market size in 2025 is estimated at xx Million, with a Compound Annual Growth Rate (CAGR) of xx% from 2025 to 2033.
CCUS Market Market Concentration & Dynamics
The CCUS market exhibits moderate concentration, with several large multinational corporations holding significant market share. However, the presence of numerous smaller players, particularly in specialized technology segments, creates a dynamic and competitive landscape. Innovation ecosystems are rapidly evolving, driven by research investments and collaborative partnerships aimed at improving capture technologies, storage solutions, and utilization pathways. Regulatory frameworks, including carbon pricing mechanisms and government incentives, play a crucial role in shaping market growth. Substitute technologies, such as renewable energy sources, pose a competitive challenge, but the growing need for emissions reduction drives demand for CCUS solutions. End-user trends reflect increasing adoption across diverse sectors, with the Oil and Gas industry currently being a dominant end-user. M&A activity remains robust, with several high-profile deals in recent years indicating a strong appetite for consolidation and expansion in this sector.
- Market Share: The top 5 players hold approximately xx% of the market share in 2025.
- M&A Deal Count: xx major M&A transactions were recorded between 2019 and 2024.
- Innovation: Significant investments are focused on enhancing capture efficiency and reducing the overall cost of CCUS deployment.
- Regulatory Landscape: Stringent emission reduction targets are driving the adoption of CCUS technologies globally.
CCUS Market Industry Insights & Trends
The CCUS market is experiencing robust growth driven by increasing concerns about climate change and stringent environmental regulations globally. Governments worldwide are implementing policies to incentivize CCUS adoption, contributing to market expansion. Technological advancements in capture, utilization, and storage technologies are making CCUS more efficient and cost-effective. Furthermore, evolving consumer behaviors show increasing demand for environmentally friendly products and services, indirectly boosting the demand for emissions reduction solutions like CCUS. The market is expected to reach xx Million by 2033, driven primarily by the Oil & Gas, Power, and Industrial sectors. The increasing focus on carbon neutrality and net-zero emission targets provides a long-term growth trajectory for the CCUS market.
Key Markets & Segments Leading CCUS Market
The Oil and Gas sector currently dominates the CCUS market, driven by its inherent need to reduce emissions and enhance oil recovery through enhanced oil recovery (EOR) techniques. The power generation sector (Coal and Biomass Power Plants) is a rapidly growing segment, while the Iron and Steel, Chemical, and Cement industries are also adopting CCUS technologies to achieve emissions reduction goals. Geographically, North America and Europe are leading the market, followed by Asia-Pacific.
Dominant Segments:
- By End-user Industry: Oil and Gas
- By Technology: Post-combustion Capture
Drivers:
- Oil and Gas: Stringent emission regulations, enhanced oil recovery opportunities, carbon offset credits.
- Power Generation: Government incentives, renewable energy integration, decarbonization targets.
- Other Industries (Iron & Steel, Chemical, Cement): Meeting stringent emissions reduction targets, accessing carbon credits.
CCUS Market Product Developments
Recent advancements in CCUS technologies have focused on improving capture efficiency, reducing energy consumption, and developing more cost-effective storage solutions. This includes innovations in solvents, membranes, and other capture technologies, as well as improved monitoring and management techniques for geological storage. The development of innovative utilization pathways for captured CO2, such as in the production of chemicals or fuels, is further enhancing the market potential. These advancements improve the competitive edge by providing more sustainable and economically viable solutions for emission reduction.
Challenges in the CCUS Market Market
Several challenges hinder widespread CCUS adoption. High capital and operational costs remain a significant barrier, along with technological limitations in certain applications and geographic locations. Regulatory uncertainty in some regions and the complexity of obtaining necessary permits and approvals can create delays and increase project risk. Furthermore, the development and reliable scaling of CO2 transportation and storage infrastructure present an ongoing challenge. These factors are estimated to impact the market by reducing penetration in xx% of potential applications by 2033.
Forces Driving CCUS Market Growth
Several factors are driving CCUS market growth, including rising global carbon emission reduction targets, supportive government policies (tax incentives, carbon pricing), increasing awareness of climate change, and technological advancements that are reducing the cost and improving the efficiency of CCUS systems. The expanding applications of CCUS in various industries, including oil and gas, power generation, and industrial processes, further fuel market expansion. For example, the recent collaboration between Shell and ONGC in India demonstrates the potential for CCUS in enhancing oil recovery and combating climate change.
Challenges in the CCUS Market Market (Long-Term Growth Catalysts)
Long-term growth catalysts include continued innovation in capture technologies leading to lower costs and higher efficiencies, the development of novel CO2 utilization pathways, and the expansion of CCUS infrastructure. Strategic partnerships between industry players, research institutions, and governments will facilitate faster development and deployment. The potential for international carbon trading mechanisms also provides a long-term growth opportunity. These catalysts have the potential to drive significant market expansion within the forecast period, potentially increasing the adoption rate by xx%.
Emerging Opportunities in CCUS Market
Emerging opportunities in the CCUS market include the utilization of captured CO2 for enhanced oil recovery (EOR), the production of valuable chemicals and fuels, and the integration of CCUS into the broader energy transition strategy. The development of novel capture technologies, such as direct air capture (DAC), represents a significant opportunity for growth, although the associated high costs need further addressing. The expansion of CCUS deployment into new geographic markets and industrial sectors also presents substantial growth opportunities.
Leading Players in the CCUS Market Sector
- Occidental Petroleum Corporation
- Linde PLC
- Shell PLC
- Honeywell International Inc
- General Electric
- Exxon Mobil Corporation
- Japan CCS Co Ltd
- SLB
- Fluor Corporation
- Baker Hughes Company
- Halliburton
- Aker Solutions
- Dakota Gasification Company
- JX Nippon Oil & Gas Exploration Corporation
- Siemens Energy
- Air Liquide
- Mitsubishi Heavy Industries Ltd
Key Milestones in CCUS Market Industry
- March 2024: JX Nippon Oil & Gas Exploration Corporation and Chevron New Energies signed a memorandum of understanding to assess CO2 export from Japan to Asia-Pacific CCS initiatives. This expands the market footprint for CCUS projects across borders.
- March 2024: Shell and ONGC collaborated on a storage study and EOR assessment in India, furthering CCUS adoption for emissions mitigation and enhanced oil production.
- February 2024: Fluor Corporation and Chevron New Energies signed a license agreement for Fluor's Econamine FG PlusSM technology, demonstrating the growing adoption of advanced capture technologies.
Strategic Outlook for CCUS Market Market
The future of the CCUS market is bright, driven by the urgent need to reduce greenhouse gas emissions and achieve global climate goals. Continued technological advancements, supportive government policies, and strategic collaborations will be key to unlocking the full potential of CCUS. The market is expected to witness significant growth over the next decade, driven by increasing investments, expanding applications across various sectors, and the development of sustainable and cost-effective CCUS solutions. The integration of CCUS into broader energy transition strategies represents a strategic opportunity for long-term sustainable growth.
CCUS Market Segmentation
-
1. Technology
- 1.1. Pre-combustion Capture
- 1.2. Oxy-fuel Combustion Capture
- 1.3. Post-combustion Capture
-
2. End-user Industry
- 2.1. Oil and Gas
- 2.2. Coal and Biomass Power Plant
- 2.3. Iron and Steel
- 2.4. Chemical
- 2.5. Cement
CCUS Market Segmentation By Geography
-
1. Asia Pacific
- 1.1. China
- 1.2. India
- 1.3. Japan
- 1.4. Australia
- 1.5. Rest of Asia Pacific
-
2. North America
- 2.1. United States
- 2.2. Canada
- 2.3. Mexico
-
3. Europe
- 3.1. Germany
- 3.2. United Kingdom
- 3.3. France
- 3.4. Norway
- 3.5. Netherlands
- 3.6. Rest of Europe
- 4. Rest of the World
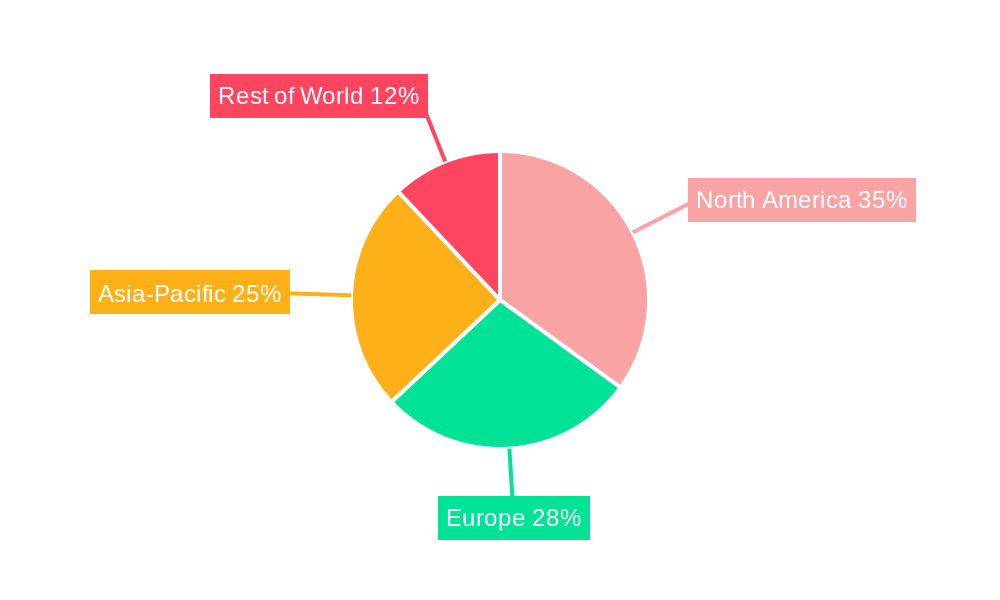
CCUS Market Regional Market Share
Geographic Coverage of CCUS Market
CCUS Market REPORT HIGHLIGHTS
| Aspects | Details |
|---|---|
| Study Period | 2020-2034 |
| Base Year | 2025 |
| Estimated Year | 2026 |
| Forecast Period | 2026-2034 |
| Historical Period | 2020-2025 |
| Growth Rate | CAGR of 14.21% from 2020-2034 |
| Segmentation |
|
Table of Contents
- 1. Introduction
- 1.1. Research Scope
- 1.2. Market Segmentation
- 1.3. Research Objective
- 1.4. Definitions and Assumptions
- 2. Executive Summary
- 2.1. Market Snapshot
- 3. Market Dynamics
- 3.1. Market Drivers
- 3.2. Market Restrains
- 3.3. Market Trends
- 3.4. Market Opportunities
- 4. Market Factor Analysis
- 4.1. Porters Five Forces
- 4.1.1. Bargaining Power of Suppliers
- 4.1.2. Bargaining Power of Buyers
- 4.1.3. Threat of New Entrants
- 4.1.4. Threat of Substitutes
- 4.1.5. Competitive Rivalry
- 4.2. PESTEL analysis
- 4.3. BCG Analysis
- 4.3.1. Stars (High Growth, High Market Share)
- 4.3.2. Cash Cows (Low Growth, High Market Share)
- 4.3.3. Question Mark (High Growth, Low Market Share)
- 4.3.4. Dogs (Low Growth, Low Market Share)
- 4.4. Ansoff Matrix Analysis
- 4.5. Supply Chain Analysis
- 4.6. Regulatory Landscape
- 4.7. Current Market Potential and Opportunity Assessment (TAM–SAM–SOM Framework)
- 4.8. MSR Analyst Note
- 4.1. Porters Five Forces
- 5. Market Analysis, Insights and Forecast 2021-2033
- 5.1. Market Analysis, Insights and Forecast - by Technology
- 5.1.1. Pre-combustion Capture
- 5.1.2. Oxy-fuel Combustion Capture
- 5.1.3. Post-combustion Capture
- 5.2. Market Analysis, Insights and Forecast - by End-user Industry
- 5.2.1. Oil and Gas
- 5.2.2. Coal and Biomass Power Plant
- 5.2.3. Iron and Steel
- 5.2.4. Chemical
- 5.2.5. Cement
- 5.3. Market Analysis, Insights and Forecast - by Region
- 5.3.1. Asia Pacific
- 5.3.2. North America
- 5.3.3. Europe
- 5.3.4. Rest of the World
- 5.1. Market Analysis, Insights and Forecast - by Technology
- 6. CCUS Market Analysis, Insights and Forecast, 2021-2033
- 6.1. Market Analysis, Insights and Forecast - by Technology
- 6.1.1. Pre-combustion Capture
- 6.1.2. Oxy-fuel Combustion Capture
- 6.1.3. Post-combustion Capture
- 6.2. Market Analysis, Insights and Forecast - by End-user Industry
- 6.2.1. Oil and Gas
- 6.2.2. Coal and Biomass Power Plant
- 6.2.3. Iron and Steel
- 6.2.4. Chemical
- 6.2.5. Cement
- 6.1. Market Analysis, Insights and Forecast - by Technology
- 7. Asia Pacific CCUS Market Analysis, Insights and Forecast, 2020-2032
- 7.1. Market Analysis, Insights and Forecast - by Technology
- 7.1.1. Pre-combustion Capture
- 7.1.2. Oxy-fuel Combustion Capture
- 7.1.3. Post-combustion Capture
- 7.2. Market Analysis, Insights and Forecast - by End-user Industry
- 7.2.1. Oil and Gas
- 7.2.2. Coal and Biomass Power Plant
- 7.2.3. Iron and Steel
- 7.2.4. Chemical
- 7.2.5. Cement
- 7.1. Market Analysis, Insights and Forecast - by Technology
- 8. North America CCUS Market Analysis, Insights and Forecast, 2020-2032
- 8.1. Market Analysis, Insights and Forecast - by Technology
- 8.1.1. Pre-combustion Capture
- 8.1.2. Oxy-fuel Combustion Capture
- 8.1.3. Post-combustion Capture
- 8.2. Market Analysis, Insights and Forecast - by End-user Industry
- 8.2.1. Oil and Gas
- 8.2.2. Coal and Biomass Power Plant
- 8.2.3. Iron and Steel
- 8.2.4. Chemical
- 8.2.5. Cement
- 8.1. Market Analysis, Insights and Forecast - by Technology
- 9. Europe CCUS Market Analysis, Insights and Forecast, 2020-2032
- 9.1. Market Analysis, Insights and Forecast - by Technology
- 9.1.1. Pre-combustion Capture
- 9.1.2. Oxy-fuel Combustion Capture
- 9.1.3. Post-combustion Capture
- 9.2. Market Analysis, Insights and Forecast - by End-user Industry
- 9.2.1. Oil and Gas
- 9.2.2. Coal and Biomass Power Plant
- 9.2.3. Iron and Steel
- 9.2.4. Chemical
- 9.2.5. Cement
- 9.1. Market Analysis, Insights and Forecast - by Technology
- 10. Rest of the World CCUS Market Analysis, Insights and Forecast, 2020-2032
- 10.1. Market Analysis, Insights and Forecast - by Technology
- 10.1.1. Pre-combustion Capture
- 10.1.2. Oxy-fuel Combustion Capture
- 10.1.3. Post-combustion Capture
- 10.2. Market Analysis, Insights and Forecast - by End-user Industry
- 10.2.1. Oil and Gas
- 10.2.2. Coal and Biomass Power Plant
- 10.2.3. Iron and Steel
- 10.2.4. Chemical
- 10.2.5. Cement
- 10.1. Market Analysis, Insights and Forecast - by Technology
- 11. Competitive Analysis
- 11.1. Company Profiles
- 11.1.1 Occidental Petroleum Corporation
- 11.1.1.1. Company Overview
- 11.1.1.2. Products
- 11.1.1.3. Company Financials
- 11.1.1.4. SWOT Analysis
- 11.1.2 Linde PLC
- 11.1.2.1. Company Overview
- 11.1.2.2. Products
- 11.1.2.3. Company Financials
- 11.1.2.4. SWOT Analysis
- 11.1.3 Shell PLC
- 11.1.3.1. Company Overview
- 11.1.3.2. Products
- 11.1.3.3. Company Financials
- 11.1.3.4. SWOT Analysis
- 11.1.4 Honeywell International Inc
- 11.1.4.1. Company Overview
- 11.1.4.2. Products
- 11.1.4.3. Company Financials
- 11.1.4.4. SWOT Analysis
- 11.1.5 General Electric
- 11.1.5.1. Company Overview
- 11.1.5.2. Products
- 11.1.5.3. Company Financials
- 11.1.5.4. SWOT Analysis
- 11.1.6 Exxon Mobil Corporation
- 11.1.6.1. Company Overview
- 11.1.6.2. Products
- 11.1.6.3. Company Financials
- 11.1.6.4. SWOT Analysis
- 11.1.7 Japan CCS Co Ltd
- 11.1.7.1. Company Overview
- 11.1.7.2. Products
- 11.1.7.3. Company Financials
- 11.1.7.4. SWOT Analysis
- 11.1.8 SLB*List Not Exhaustive
- 11.1.8.1. Company Overview
- 11.1.8.2. Products
- 11.1.8.3. Company Financials
- 11.1.8.4. SWOT Analysis
- 11.1.9 Fluor Corporation
- 11.1.9.1. Company Overview
- 11.1.9.2. Products
- 11.1.9.3. Company Financials
- 11.1.9.4. SWOT Analysis
- 11.1.10 Baker Hughes Company
- 11.1.10.1. Company Overview
- 11.1.10.2. Products
- 11.1.10.3. Company Financials
- 11.1.10.4. SWOT Analysis
- 11.1.11 Halliburton
- 11.1.11.1. Company Overview
- 11.1.11.2. Products
- 11.1.11.3. Company Financials
- 11.1.11.4. SWOT Analysis
- 11.1.12 Aker Solutions
- 11.1.12.1. Company Overview
- 11.1.12.2. Products
- 11.1.12.3. Company Financials
- 11.1.12.4. SWOT Analysis
- 11.1.13 Dakota Gasification Company
- 11.1.13.1. Company Overview
- 11.1.13.2. Products
- 11.1.13.3. Company Financials
- 11.1.13.4. SWOT Analysis
- 11.1.14 JX Nippon Oil & Gas Exploration Corporation
- 11.1.14.1. Company Overview
- 11.1.14.2. Products
- 11.1.14.3. Company Financials
- 11.1.14.4. SWOT Analysis
- 11.1.15 Siemens Energy
- 11.1.15.1. Company Overview
- 11.1.15.2. Products
- 11.1.15.3. Company Financials
- 11.1.15.4. SWOT Analysis
- 11.1.16 Air Liquide
- 11.1.16.1. Company Overview
- 11.1.16.2. Products
- 11.1.16.3. Company Financials
- 11.1.16.4. SWOT Analysis
- 11.1.17 Mitsubishi Heavy Industries Ltd
- 11.1.17.1. Company Overview
- 11.1.17.2. Products
- 11.1.17.3. Company Financials
- 11.1.17.4. SWOT Analysis
- 11.1.1 Occidental Petroleum Corporation
- 11.2. Market Entropy
- 11.2.1 Company's Key Areas Served
- 11.2.2 Recent Developments
- 11.3. Company Market Share Analysis 2025
- 11.3.1 Top 5 Companies Market Share Analysis
- 11.3.2 Top 3 Companies Market Share Analysis
- 11.4. List of Potential Customers
- 12. Research Methodology
List of Figures
- Figure 1: CCUS Market Revenue Breakdown (Million, %) by Product 2025 & 2033
- Figure 2: CCUS Market Share (%) by Company 2025
List of Tables
- Table 1: CCUS Market Revenue Million Forecast, by Technology 2020 & 2033
- Table 2: CCUS Market Volume K Tons Forecast, by Technology 2020 & 2033
- Table 3: CCUS Market Revenue Million Forecast, by End-user Industry 2020 & 2033
- Table 4: CCUS Market Volume K Tons Forecast, by End-user Industry 2020 & 2033
- Table 5: CCUS Market Revenue Million Forecast, by Region 2020 & 2033
- Table 6: CCUS Market Volume K Tons Forecast, by Region 2020 & 2033
- Table 7: CCUS Market Revenue Million Forecast, by Technology 2020 & 2033
- Table 8: CCUS Market Volume K Tons Forecast, by Technology 2020 & 2033
- Table 9: CCUS Market Revenue Million Forecast, by End-user Industry 2020 & 2033
- Table 10: CCUS Market Volume K Tons Forecast, by End-user Industry 2020 & 2033
- Table 11: CCUS Market Revenue Million Forecast, by Country 2020 & 2033
- Table 12: CCUS Market Volume K Tons Forecast, by Country 2020 & 2033
- Table 13: China CCUS Market Revenue (Million) Forecast, by Application 2020 & 2033
- Table 14: China CCUS Market Volume (K Tons) Forecast, by Application 2020 & 2033
- Table 15: India CCUS Market Revenue (Million) Forecast, by Application 2020 & 2033
- Table 16: India CCUS Market Volume (K Tons) Forecast, by Application 2020 & 2033
- Table 17: Japan CCUS Market Revenue (Million) Forecast, by Application 2020 & 2033
- Table 18: Japan CCUS Market Volume (K Tons) Forecast, by Application 2020 & 2033
- Table 19: Australia CCUS Market Revenue (Million) Forecast, by Application 2020 & 2033
- Table 20: Australia CCUS Market Volume (K Tons) Forecast, by Application 2020 & 2033
- Table 21: Rest of Asia Pacific CCUS Market Revenue (Million) Forecast, by Application 2020 & 2033
- Table 22: Rest of Asia Pacific CCUS Market Volume (K Tons) Forecast, by Application 2020 & 2033
- Table 23: CCUS Market Revenue Million Forecast, by Technology 2020 & 2033
- Table 24: CCUS Market Volume K Tons Forecast, by Technology 2020 & 2033
- Table 25: CCUS Market Revenue Million Forecast, by End-user Industry 2020 & 2033
- Table 26: CCUS Market Volume K Tons Forecast, by End-user Industry 2020 & 2033
- Table 27: CCUS Market Revenue Million Forecast, by Country 2020 & 2033
- Table 28: CCUS Market Volume K Tons Forecast, by Country 2020 & 2033
- Table 29: United States CCUS Market Revenue (Million) Forecast, by Application 2020 & 2033
- Table 30: United States CCUS Market Volume (K Tons) Forecast, by Application 2020 & 2033
- Table 31: Canada CCUS Market Revenue (Million) Forecast, by Application 2020 & 2033
- Table 32: Canada CCUS Market Volume (K Tons) Forecast, by Application 2020 & 2033
- Table 33: Mexico CCUS Market Revenue (Million) Forecast, by Application 2020 & 2033
- Table 34: Mexico CCUS Market Volume (K Tons) Forecast, by Application 2020 & 2033
- Table 35: CCUS Market Revenue Million Forecast, by Technology 2020 & 2033
- Table 36: CCUS Market Volume K Tons Forecast, by Technology 2020 & 2033
- Table 37: CCUS Market Revenue Million Forecast, by End-user Industry 2020 & 2033
- Table 38: CCUS Market Volume K Tons Forecast, by End-user Industry 2020 & 2033
- Table 39: CCUS Market Revenue Million Forecast, by Country 2020 & 2033
- Table 40: CCUS Market Volume K Tons Forecast, by Country 2020 & 2033
- Table 41: Germany CCUS Market Revenue (Million) Forecast, by Application 2020 & 2033
- Table 42: Germany CCUS Market Volume (K Tons) Forecast, by Application 2020 & 2033
- Table 43: United Kingdom CCUS Market Revenue (Million) Forecast, by Application 2020 & 2033
- Table 44: United Kingdom CCUS Market Volume (K Tons) Forecast, by Application 2020 & 2033
- Table 45: France CCUS Market Revenue (Million) Forecast, by Application 2020 & 2033
- Table 46: France CCUS Market Volume (K Tons) Forecast, by Application 2020 & 2033
- Table 47: Norway CCUS Market Revenue (Million) Forecast, by Application 2020 & 2033
- Table 48: Norway CCUS Market Volume (K Tons) Forecast, by Application 2020 & 2033
- Table 49: Netherlands CCUS Market Revenue (Million) Forecast, by Application 2020 & 2033
- Table 50: Netherlands CCUS Market Volume (K Tons) Forecast, by Application 2020 & 2033
- Table 51: Rest of Europe CCUS Market Revenue (Million) Forecast, by Application 2020 & 2033
- Table 52: Rest of Europe CCUS Market Volume (K Tons) Forecast, by Application 2020 & 2033
- Table 53: CCUS Market Revenue Million Forecast, by Technology 2020 & 2033
- Table 54: CCUS Market Volume K Tons Forecast, by Technology 2020 & 2033
- Table 55: CCUS Market Revenue Million Forecast, by End-user Industry 2020 & 2033
- Table 56: CCUS Market Volume K Tons Forecast, by End-user Industry 2020 & 2033
- Table 57: CCUS Market Revenue Million Forecast, by Country 2020 & 2033
- Table 58: CCUS Market Volume K Tons Forecast, by Country 2020 & 2033
Frequently Asked Questions
1. What is the projected Compound Annual Growth Rate (CAGR) of the CCUS Market?
The projected CAGR is approximately 14.21%.
2. Which companies are prominent players in the CCUS Market?
Key companies in the market include Occidental Petroleum Corporation, Linde PLC, Shell PLC, Honeywell International Inc, General Electric, Exxon Mobil Corporation, Japan CCS Co Ltd, SLB*List Not Exhaustive, Fluor Corporation, Baker Hughes Company, Halliburton, Aker Solutions, Dakota Gasification Company, JX Nippon Oil & Gas Exploration Corporation, Siemens Energy, Air Liquide, Mitsubishi Heavy Industries Ltd.
3. What are the main segments of the CCUS Market?
The market segments include Technology, End-user Industry.
4. Can you provide details about the market size?
The market size is estimated to be USD 2.42 Million as of 2022.
5. What are some drivers contributing to market growth?
Emerging Demand for CO2 Injection Technique for Enhanced Oil Recovery (EOR); Strict Government Norms Toward GHG Emissions.
6. What are the notable trends driving market growth?
Oil and Gas Segment to Dominate the Market.
7. Are there any restraints impacting market growth?
Huge CCS Technology Implementation Costs; Growth in Shale Investments.
8. Can you provide examples of recent developments in the market?
March 2024: JX Nippon Oil & Gas Exploration Corporation and Chevron New Energies, a division of Chevron U.S.A. Inc., entered into a memorandum of understanding aimed at assessing the potential export of carbon dioxide from Japan to carbon capture and storage (CCS) initiatives situated in Australia and other nations across Asia-Pacific. This agreement enhances the company's market footprint.
9. What pricing options are available for accessing the report?
Pricing options include single-user, multi-user, and enterprise licenses priced at USD 4750, USD 5250, and USD 8750 respectively.
10. Is the market size provided in terms of value or volume?
The market size is provided in terms of value, measured in Million and volume, measured in K Tons.
11. Are there any specific market keywords associated with the report?
Yes, the market keyword associated with the report is "CCUS Market," which aids in identifying and referencing the specific market segment covered.
12. How do I determine which pricing option suits my needs best?
The pricing options vary based on user requirements and access needs. Individual users may opt for single-user licenses, while businesses requiring broader access may choose multi-user or enterprise licenses for cost-effective access to the report.
13. Are there any additional resources or data provided in the CCUS Market report?
While the report offers comprehensive insights, it's advisable to review the specific contents or supplementary materials provided to ascertain if additional resources or data are available.
14. How can I stay updated on further developments or reports in the CCUS Market?
To stay informed about further developments, trends, and reports in the CCUS Market, consider subscribing to industry newsletters, following relevant companies and organizations, or regularly checking reputable industry news sources and publications.
Methodology
Step 1 - Identification of Relevant Samples Size from Population Database


Step 2 - Approaches for Defining Global Market Size (Value, Volume* & Price*)

Note*: In applicable scenarios
Step 3 - Data Sources
Primary Research
- Web Analytics
- Survey Reports
- Research Institute
- Latest Research Reports
- Opinion Leaders
Secondary Research
- Annual Reports
- White Paper
- Latest Press Release
- Industry Association
- Paid Database
- Investor Presentations

Step 4 - Data Triangulation
Involves using different sources of information in order to increase the validity of a study
These sources are likely to be stakeholders in a program - participants, other researchers, program staff, other community members, and so on.
Then we put all data in single framework & apply various statistical tools to find out the dynamic on the market.
During the analysis stage, feedback from the stakeholder groups would be compared to determine areas of agreement as well as areas of divergence