

Key Insights
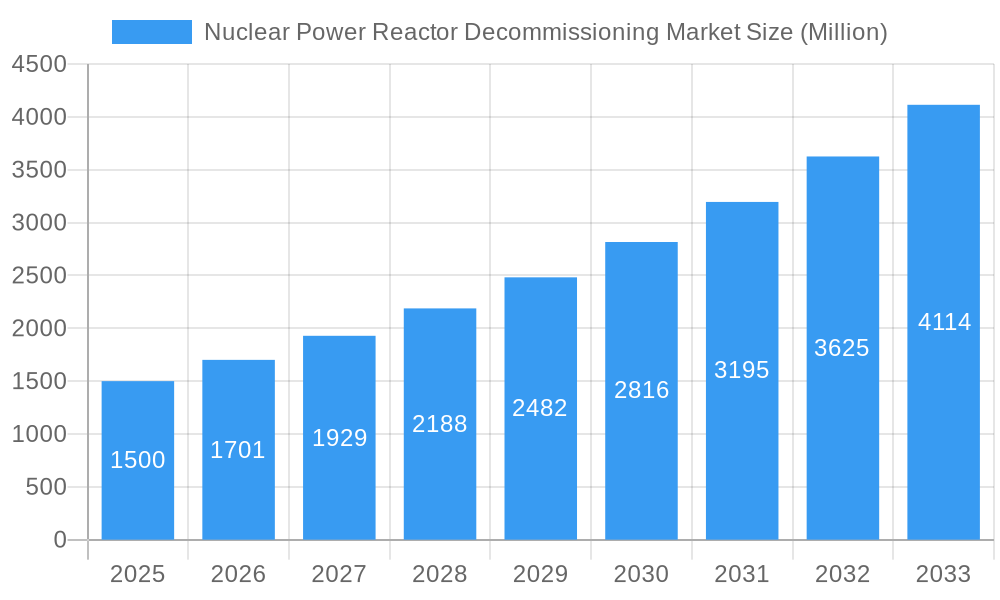
The global nuclear power reactor decommissioning market is poised for substantial expansion, driven by an aging global fleet of nuclear power plants and increasingly stringent regulatory mandates for safe and effective decommissioning. The market, currently valued at $8170.1 million as of 2023, is projected to grow at a Compound Annual Growth Rate (CAGR) of 4%, reaching significant future market sizes. Key growth drivers include the large number of reactors approaching their end-of-life, enhanced safety regulations influenced by past incidents, and the ongoing development of innovative and cost-effective decommissioning technologies. Furthermore, growing environmental awareness regarding responsible nuclear waste management is propelling market growth.
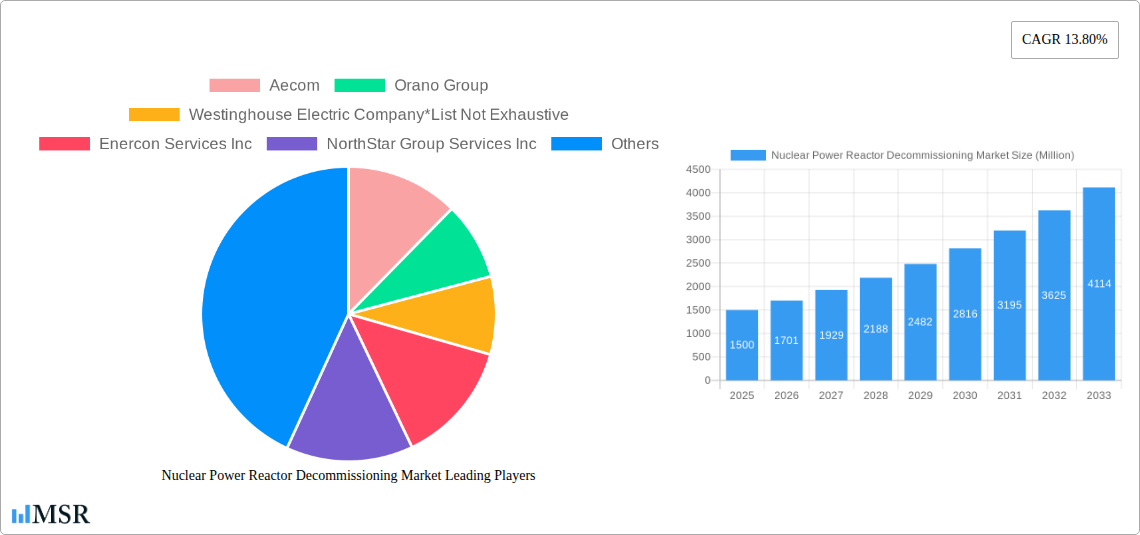
Nuclear Power Reactor Decommissioning Market Market Size (In Billion)
Market segmentation highlights dominant segments. Pressurized Water Reactors (PWRs) represent a significant share within reactor types, aligning with their global installation base. Commercial power reactors lead the application segment, fueled by extensive decommissioning activities. The capacity segment shows a notable concentration of projects involving reactors in the 100-1000 MW range. Leading industry players such as Aecom, Orano Group, and Westinghouse Electric Company are actively engaged, utilizing their technological capabilities and international presence. Regional analysis confirms robust growth in North America, Asia-Pacific, and Europe, mirroring the distribution of aging nuclear infrastructure. Despite challenges such as high costs and complex regulatory environments, the outlook for the nuclear power reactor decommissioning market remains highly favorable due to compelling economic, safety, and environmental imperatives.
Nuclear Power Reactor Decommissioning Market Company Market Share
Nuclear Power Reactor Decommissioning Market: A Comprehensive Report (2019-2033)
This in-depth report provides a comprehensive analysis of the global Nuclear Power Reactor Decommissioning Market, covering the period 2019-2033. It offers invaluable insights into market dynamics, key segments, leading players, and future growth opportunities, empowering stakeholders to make informed strategic decisions. The report meticulously analyzes market size, CAGR, and competitive landscape, incorporating detailed data on M&A activities, technological advancements, and regulatory changes. With a focus on actionable intelligence, this report is an essential resource for industry professionals, investors, and researchers seeking to understand and navigate this complex and evolving market. The market is projected to reach xx Million by 2033.
Nuclear Power Reactor Decommissioning Market Market Concentration & Dynamics
The global Nuclear Power Reactor Decommissioning market exhibits a moderately concentrated structure, with a few major players holding significant market share. Market concentration is influenced by factors including technological expertise, regulatory compliance, and financial resources required for large-scale decommissioning projects. Innovation within the sector is driven by the need for safer, more efficient, and cost-effective decommissioning techniques. Stringent regulatory frameworks, varying across nations, significantly impact market dynamics. The presence of substitute technologies, though limited, poses a competitive challenge. End-user trends, primarily driven by aging nuclear power plants and growing environmental concerns, are pushing the market forward. M&A activity within the sector has been moderate, with xx deals recorded between 2019 and 2024, primarily focused on expanding service offerings and geographical reach.
- Market Share: Top 5 players account for approximately xx% of the market.
- M&A Activity: An average of xx M&A deals per year were observed between 2019 and 2024.
- Regulatory Landscape: Variations in regulations across different countries significantly impact market access and operational strategies.
- Innovation: Focus on robotics, AI, and advanced waste management techniques are driving innovation.
Nuclear Power Reactor Decommissioning Market Industry Insights & Trends
The global Nuclear Power Reactor Decommissioning market is experiencing robust growth, driven by a combination of factors. The aging global nuclear power plant fleet necessitates large-scale decommissioning projects. Stringent regulations concerning nuclear waste disposal and environmental safety are further fueling market expansion. Technological advancements, including the development of advanced robotics and remote handling systems, are enhancing efficiency and reducing risks associated with decommissioning. Furthermore, increasing public awareness of environmental sustainability and the potential hazards of nuclear waste are contributing to heightened demand for specialized decommissioning services. The market is expected to witness a CAGR of xx% during the forecast period (2025-2033), reaching a projected value of xx Million by 2033. This growth is largely attributed to the increasing number of reactors nearing the end of their operational lifespan and the growing emphasis on safe and efficient waste management.
Key Markets & Segments Leading Nuclear Power Reactor Decommissioning Market
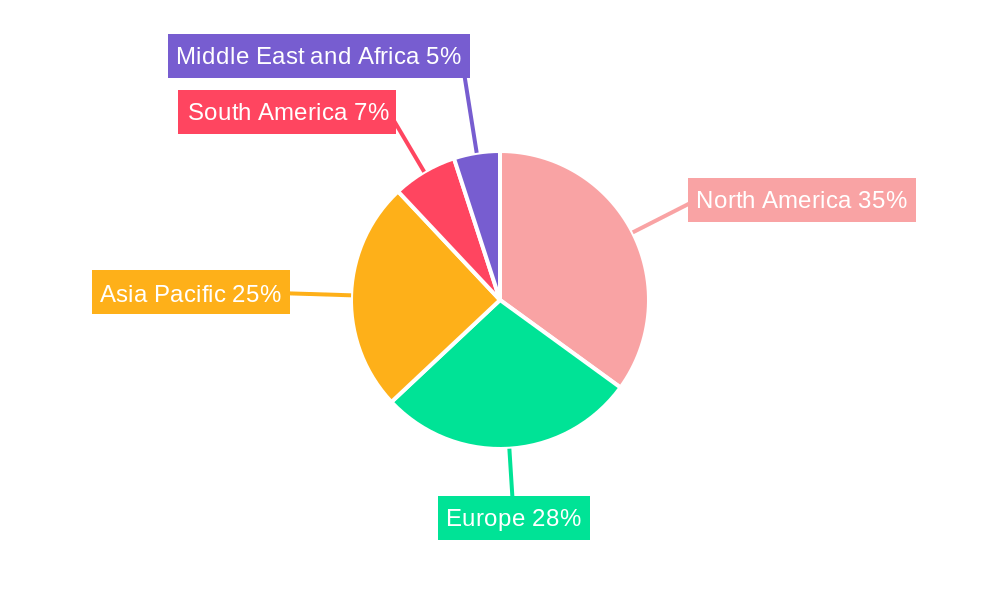
The North American market currently holds the largest share of the global Nuclear Power Reactor Decommissioning market, followed by Europe and Asia-Pacific. This dominance is attributable to the large number of aging reactors in these regions and the stringent regulatory environment driving decommissioning activities.
By Reactor Type: Pressurized Water Reactors (PWRs) constitute the largest segment due to their widespread global deployment.
By Application: Commercial power reactors dominate the application segment, reflecting the sheer volume of decommissioning projects for these facilities.
By Capacity: The 100-1000 MW capacity segment holds a substantial market share, representing a significant portion of the operational nuclear power plants globally.
Growth Drivers:
- Aging nuclear power plant fleet.
- Stringent environmental regulations.
- Technological advancements.
- Increased public awareness.
- Government incentives and funding.
Dominance Analysis: North America leads due to a high concentration of aging reactors and robust regulatory frameworks. The PWR segment dominates due to its prevalence globally.
Nuclear Power Reactor Decommissioning Market Product Developments
Recent years have witnessed significant advancements in decommissioning technologies, focusing on improving safety, efficiency, and reducing environmental impact. These innovations include the development of advanced robotics and automated systems for handling radioactive materials, improved waste management techniques, and the deployment of innovative dismantling strategies. These technological advancements are creating competitive advantages for companies offering these services, improving cost-effectiveness, and minimizing risks. The market is witnessing a shift towards more sophisticated and sustainable decommissioning solutions.
Challenges in the Nuclear Power Reactor Decommissioning Market Market
The Nuclear Power Reactor Decommissioning market faces several challenges, including stringent regulatory requirements involving complex licensing processes and compliance procedures. This results in project delays and increased costs. Supply chain issues, particularly regarding specialized equipment and materials, further constrain market growth. Lastly, intense competition among established players and new entrants puts pressure on profit margins. These factors collectively impact project timelines and overall market expansion.
Forces Driving Nuclear Power Reactor Decommissioning Market Growth
Several factors contribute to the growth of the Nuclear Power Reactor Decommissioning market. Technological advancements, such as the development of robotic systems for handling radioactive materials, significantly improve efficiency and safety. Government regulations mandating safe decommissioning and waste management practices also drive market growth. Furthermore, the increasing number of aging nuclear power plants reaching the end of their operational lives fuels the demand for these services.
Long-Term Growth Catalysts in the Nuclear Power Reactor Decommissioning Market
Long-term growth in the Nuclear Power Reactor Decommissioning market will be driven by continued technological innovations, leading to more efficient and cost-effective decommissioning processes. Strategic partnerships between technology providers and decommissioning companies will enhance capabilities and accelerate market penetration. Expansion into new markets with aging nuclear infrastructure will further contribute to long-term growth.
Emerging Opportunities in Nuclear Power Reactor Decommissioning Market
Emerging opportunities include the development of advanced recycling technologies for nuclear waste, minimizing long-term storage needs. The growing interest in small modular reactors (SMRs) will eventually create a new segment for decommissioning services. Furthermore, the exploration of innovative financing models for decommissioning projects can unlock substantial growth potential.
Leading Players in the Nuclear Power Reactor Decommissioning Market Sector
- Aecom
- Orano Group
- Westinghouse Electric Company
- Enercon Services Inc
- NorthStar Group Services Inc
- GE Hitachi Nuclear Services
- James Fisher & Sons PLC
- Bechtel Group Inc
- Fluor Corporation
- Babcock International Group PLC
- Studsvik AB
Key Milestones in Nuclear Power Reactor Decommissioning Market Industry
- 2020: Introduction of advanced robotic systems by [Company Name].
- 2022: Successful completion of a large-scale decommissioning project by [Company Name], demonstrating improved efficiency.
- 2023: Significant regulatory changes impacting decommissioning procedures in [Country].
- 2024: [Company Name] and [Company Name] announce a strategic partnership to expand decommissioning services globally.
Strategic Outlook for Nuclear Power Reactor Decommissioning Market Market
The future of the Nuclear Power Reactor Decommissioning market appears promising, driven by the continued aging of global nuclear power plants and increasing regulatory pressure for safe and sustainable decommissioning practices. Companies that invest in technological advancements, build strategic partnerships, and effectively navigate the regulatory landscape will be best positioned to capture significant market share and drive future growth. The long-term outlook is positive, with substantial growth potential driven by both the increasing number of decommissioning projects and the evolution of decommissioning technologies.
Nuclear Power Reactor Decommissioning Market Segmentation
-
1. Reactor Type
- 1.1. Pressurized Water Reactor
- 1.2. Pressurized Heavy Water Reactor
- 1.3. Boiling Water Reactor
- 1.4. High-temperature Gas-cooled Reactor
- 1.5. Liquid Metal Fast Breeder Reactor
- 1.6. Other Reactor Types
-
2. Application
- 2.1. Commercial Power Reactor
- 2.2. Prototype Power Reactor
- 2.3. Research Reactor
-
3. Capacity
- 3.1. Below 100 MW
- 3.2. 100-1000 MW
- 3.3. Above 1000 MW
Nuclear Power Reactor Decommissioning Market Segmentation By Geography
- 1. North America
- 2. Asia Pacific
- 3. Europe
- 4. South America
- 5. Middle East and Africa
Nuclear Power Reactor Decommissioning Market Regional Market Share
Geographic Coverage of Nuclear Power Reactor Decommissioning Market
Nuclear Power Reactor Decommissioning Market REPORT HIGHLIGHTS
| Aspects | Details |
|---|---|
| Study Period | 2020-2034 |
| Base Year | 2025 |
| Estimated Year | 2026 |
| Forecast Period | 2026-2034 |
| Historical Period | 2020-2025 |
| Growth Rate | CAGR of 4% from 2020-2034 |
| Segmentation |
|
Table of Contents
- 1. Introduction
- 1.1. Research Scope
- 1.2. Market Segmentation
- 1.3. Research Objective
- 1.4. Definitions and Assumptions
- 2. Executive Summary
- 2.1. Market Snapshot
- 3. Market Dynamics
- 3.1. Market Drivers
- 3.2. Market Restrains
- 3.3. Market Trends
- 3.4. Market Opportunities
- 4. Market Factor Analysis
- 4.1. Porters Five Forces
- 4.1.1. Bargaining Power of Suppliers
- 4.1.2. Bargaining Power of Buyers
- 4.1.3. Threat of New Entrants
- 4.1.4. Threat of Substitutes
- 4.1.5. Competitive Rivalry
- 4.2. PESTEL analysis
- 4.3. BCG Analysis
- 4.3.1. Stars (High Growth, High Market Share)
- 4.3.2. Cash Cows (Low Growth, High Market Share)
- 4.3.3. Question Mark (High Growth, Low Market Share)
- 4.3.4. Dogs (Low Growth, Low Market Share)
- 4.4. Ansoff Matrix Analysis
- 4.5. Supply Chain Analysis
- 4.6. Regulatory Landscape
- 4.7. Current Market Potential and Opportunity Assessment (TAM–SAM–SOM Framework)
- 4.8. MSR Analyst Note
- 4.1. Porters Five Forces
- 5. Market Analysis, Insights and Forecast 2021-2033
- 5.1. Market Analysis, Insights and Forecast - by Reactor Type
- 5.1.1. Pressurized Water Reactor
- 5.1.2. Pressurized Heavy Water Reactor
- 5.1.3. Boiling Water Reactor
- 5.1.4. High-temperature Gas-cooled Reactor
- 5.1.5. Liquid Metal Fast Breeder Reactor
- 5.1.6. Other Reactor Types
- 5.2. Market Analysis, Insights and Forecast - by Application
- 5.2.1. Commercial Power Reactor
- 5.2.2. Prototype Power Reactor
- 5.2.3. Research Reactor
- 5.3. Market Analysis, Insights and Forecast - by Capacity
- 5.3.1. Below 100 MW
- 5.3.2. 100-1000 MW
- 5.3.3. Above 1000 MW
- 5.4. Market Analysis, Insights and Forecast - by Region
- 5.4.1. North America
- 5.4.2. Asia Pacific
- 5.4.3. Europe
- 5.4.4. South America
- 5.4.5. Middle East and Africa
- 5.1. Market Analysis, Insights and Forecast - by Reactor Type
- 6. Global Nuclear Power Reactor Decommissioning Market Analysis, Insights and Forecast, 2021-2033
- 6.1. Market Analysis, Insights and Forecast - by Reactor Type
- 6.1.1. Pressurized Water Reactor
- 6.1.2. Pressurized Heavy Water Reactor
- 6.1.3. Boiling Water Reactor
- 6.1.4. High-temperature Gas-cooled Reactor
- 6.1.5. Liquid Metal Fast Breeder Reactor
- 6.1.6. Other Reactor Types
- 6.2. Market Analysis, Insights and Forecast - by Application
- 6.2.1. Commercial Power Reactor
- 6.2.2. Prototype Power Reactor
- 6.2.3. Research Reactor
- 6.3. Market Analysis, Insights and Forecast - by Capacity
- 6.3.1. Below 100 MW
- 6.3.2. 100-1000 MW
- 6.3.3. Above 1000 MW
- 6.1. Market Analysis, Insights and Forecast - by Reactor Type
- 7. North America Nuclear Power Reactor Decommissioning Market Analysis, Insights and Forecast, 2020-2032
- 7.1. Market Analysis, Insights and Forecast - by Reactor Type
- 7.1.1. Pressurized Water Reactor
- 7.1.2. Pressurized Heavy Water Reactor
- 7.1.3. Boiling Water Reactor
- 7.1.4. High-temperature Gas-cooled Reactor
- 7.1.5. Liquid Metal Fast Breeder Reactor
- 7.1.6. Other Reactor Types
- 7.2. Market Analysis, Insights and Forecast - by Application
- 7.2.1. Commercial Power Reactor
- 7.2.2. Prototype Power Reactor
- 7.2.3. Research Reactor
- 7.3. Market Analysis, Insights and Forecast - by Capacity
- 7.3.1. Below 100 MW
- 7.3.2. 100-1000 MW
- 7.3.3. Above 1000 MW
- 7.1. Market Analysis, Insights and Forecast - by Reactor Type
- 8. Asia Pacific Nuclear Power Reactor Decommissioning Market Analysis, Insights and Forecast, 2020-2032
- 8.1. Market Analysis, Insights and Forecast - by Reactor Type
- 8.1.1. Pressurized Water Reactor
- 8.1.2. Pressurized Heavy Water Reactor
- 8.1.3. Boiling Water Reactor
- 8.1.4. High-temperature Gas-cooled Reactor
- 8.1.5. Liquid Metal Fast Breeder Reactor
- 8.1.6. Other Reactor Types
- 8.2. Market Analysis, Insights and Forecast - by Application
- 8.2.1. Commercial Power Reactor
- 8.2.2. Prototype Power Reactor
- 8.2.3. Research Reactor
- 8.3. Market Analysis, Insights and Forecast - by Capacity
- 8.3.1. Below 100 MW
- 8.3.2. 100-1000 MW
- 8.3.3. Above 1000 MW
- 8.1. Market Analysis, Insights and Forecast - by Reactor Type
- 9. Europe Nuclear Power Reactor Decommissioning Market Analysis, Insights and Forecast, 2020-2032
- 9.1. Market Analysis, Insights and Forecast - by Reactor Type
- 9.1.1. Pressurized Water Reactor
- 9.1.2. Pressurized Heavy Water Reactor
- 9.1.3. Boiling Water Reactor
- 9.1.4. High-temperature Gas-cooled Reactor
- 9.1.5. Liquid Metal Fast Breeder Reactor
- 9.1.6. Other Reactor Types
- 9.2. Market Analysis, Insights and Forecast - by Application
- 9.2.1. Commercial Power Reactor
- 9.2.2. Prototype Power Reactor
- 9.2.3. Research Reactor
- 9.3. Market Analysis, Insights and Forecast - by Capacity
- 9.3.1. Below 100 MW
- 9.3.2. 100-1000 MW
- 9.3.3. Above 1000 MW
- 9.1. Market Analysis, Insights and Forecast - by Reactor Type
- 10. South America Nuclear Power Reactor Decommissioning Market Analysis, Insights and Forecast, 2020-2032
- 10.1. Market Analysis, Insights and Forecast - by Reactor Type
- 10.1.1. Pressurized Water Reactor
- 10.1.2. Pressurized Heavy Water Reactor
- 10.1.3. Boiling Water Reactor
- 10.1.4. High-temperature Gas-cooled Reactor
- 10.1.5. Liquid Metal Fast Breeder Reactor
- 10.1.6. Other Reactor Types
- 10.2. Market Analysis, Insights and Forecast - by Application
- 10.2.1. Commercial Power Reactor
- 10.2.2. Prototype Power Reactor
- 10.2.3. Research Reactor
- 10.3. Market Analysis, Insights and Forecast - by Capacity
- 10.3.1. Below 100 MW
- 10.3.2. 100-1000 MW
- 10.3.3. Above 1000 MW
- 10.1. Market Analysis, Insights and Forecast - by Reactor Type
- 11. Middle East and Africa Nuclear Power Reactor Decommissioning Market Analysis, Insights and Forecast, 2020-2032
- 11.1. Market Analysis, Insights and Forecast - by Reactor Type
- 11.1.1. Pressurized Water Reactor
- 11.1.2. Pressurized Heavy Water Reactor
- 11.1.3. Boiling Water Reactor
- 11.1.4. High-temperature Gas-cooled Reactor
- 11.1.5. Liquid Metal Fast Breeder Reactor
- 11.1.6. Other Reactor Types
- 11.2. Market Analysis, Insights and Forecast - by Application
- 11.2.1. Commercial Power Reactor
- 11.2.2. Prototype Power Reactor
- 11.2.3. Research Reactor
- 11.3. Market Analysis, Insights and Forecast - by Capacity
- 11.3.1. Below 100 MW
- 11.3.2. 100-1000 MW
- 11.3.3. Above 1000 MW
- 11.1. Market Analysis, Insights and Forecast - by Reactor Type
- 12. Competitive Analysis
- 12.1. Company Profiles
- 12.1.1 Aecom
- 12.1.1.1. Company Overview
- 12.1.1.2. Products
- 12.1.1.3. Company Financials
- 12.1.1.4. SWOT Analysis
- 12.1.2 Orano Group
- 12.1.2.1. Company Overview
- 12.1.2.2. Products
- 12.1.2.3. Company Financials
- 12.1.2.4. SWOT Analysis
- 12.1.3 Westinghouse Electric Company*List Not Exhaustive
- 12.1.3.1. Company Overview
- 12.1.3.2. Products
- 12.1.3.3. Company Financials
- 12.1.3.4. SWOT Analysis
- 12.1.4 Enercon Services Inc
- 12.1.4.1. Company Overview
- 12.1.4.2. Products
- 12.1.4.3. Company Financials
- 12.1.4.4. SWOT Analysis
- 12.1.5 NorthStar Group Services Inc
- 12.1.5.1. Company Overview
- 12.1.5.2. Products
- 12.1.5.3. Company Financials
- 12.1.5.4. SWOT Analysis
- 12.1.6 GE Hitachi Nuclear Services
- 12.1.6.1. Company Overview
- 12.1.6.2. Products
- 12.1.6.3. Company Financials
- 12.1.6.4. SWOT Analysis
- 12.1.7 James Fisher & Sons PLC
- 12.1.7.1. Company Overview
- 12.1.7.2. Products
- 12.1.7.3. Company Financials
- 12.1.7.4. SWOT Analysis
- 12.1.8 Bechtel Group Inc
- 12.1.8.1. Company Overview
- 12.1.8.2. Products
- 12.1.8.3. Company Financials
- 12.1.8.4. SWOT Analysis
- 12.1.9 Fluor Corporation
- 12.1.9.1. Company Overview
- 12.1.9.2. Products
- 12.1.9.3. Company Financials
- 12.1.9.4. SWOT Analysis
- 12.1.10 Babcock International Group PLC
- 12.1.10.1. Company Overview
- 12.1.10.2. Products
- 12.1.10.3. Company Financials
- 12.1.10.4. SWOT Analysis
- 12.1.11 Studsvik AB
- 12.1.11.1. Company Overview
- 12.1.11.2. Products
- 12.1.11.3. Company Financials
- 12.1.11.4. SWOT Analysis
- 12.1.1 Aecom
- 12.2. Market Entropy
- 12.2.1 Company's Key Areas Served
- 12.2.2 Recent Developments
- 12.3. Company Market Share Analysis 2025
- 12.3.1 Top 5 Companies Market Share Analysis
- 12.3.2 Top 3 Companies Market Share Analysis
- 12.4. List of Potential Customers
- 13. Research Methodology
List of Figures
- Figure 1: Global Nuclear Power Reactor Decommissioning Market Revenue Breakdown (million, %) by Region 2025 & 2033
- Figure 2: North America Nuclear Power Reactor Decommissioning Market Revenue (million), by Reactor Type 2025 & 2033
- Figure 3: North America Nuclear Power Reactor Decommissioning Market Revenue Share (%), by Reactor Type 2025 & 2033
- Figure 4: North America Nuclear Power Reactor Decommissioning Market Revenue (million), by Application 2025 & 2033
- Figure 5: North America Nuclear Power Reactor Decommissioning Market Revenue Share (%), by Application 2025 & 2033
- Figure 6: North America Nuclear Power Reactor Decommissioning Market Revenue (million), by Capacity 2025 & 2033
- Figure 7: North America Nuclear Power Reactor Decommissioning Market Revenue Share (%), by Capacity 2025 & 2033
- Figure 8: North America Nuclear Power Reactor Decommissioning Market Revenue (million), by Country 2025 & 2033
- Figure 9: North America Nuclear Power Reactor Decommissioning Market Revenue Share (%), by Country 2025 & 2033
- Figure 10: Asia Pacific Nuclear Power Reactor Decommissioning Market Revenue (million), by Reactor Type 2025 & 2033
- Figure 11: Asia Pacific Nuclear Power Reactor Decommissioning Market Revenue Share (%), by Reactor Type 2025 & 2033
- Figure 12: Asia Pacific Nuclear Power Reactor Decommissioning Market Revenue (million), by Application 2025 & 2033
- Figure 13: Asia Pacific Nuclear Power Reactor Decommissioning Market Revenue Share (%), by Application 2025 & 2033
- Figure 14: Asia Pacific Nuclear Power Reactor Decommissioning Market Revenue (million), by Capacity 2025 & 2033
- Figure 15: Asia Pacific Nuclear Power Reactor Decommissioning Market Revenue Share (%), by Capacity 2025 & 2033
- Figure 16: Asia Pacific Nuclear Power Reactor Decommissioning Market Revenue (million), by Country 2025 & 2033
- Figure 17: Asia Pacific Nuclear Power Reactor Decommissioning Market Revenue Share (%), by Country 2025 & 2033
- Figure 18: Europe Nuclear Power Reactor Decommissioning Market Revenue (million), by Reactor Type 2025 & 2033
- Figure 19: Europe Nuclear Power Reactor Decommissioning Market Revenue Share (%), by Reactor Type 2025 & 2033
- Figure 20: Europe Nuclear Power Reactor Decommissioning Market Revenue (million), by Application 2025 & 2033
- Figure 21: Europe Nuclear Power Reactor Decommissioning Market Revenue Share (%), by Application 2025 & 2033
- Figure 22: Europe Nuclear Power Reactor Decommissioning Market Revenue (million), by Capacity 2025 & 2033
- Figure 23: Europe Nuclear Power Reactor Decommissioning Market Revenue Share (%), by Capacity 2025 & 2033
- Figure 24: Europe Nuclear Power Reactor Decommissioning Market Revenue (million), by Country 2025 & 2033
- Figure 25: Europe Nuclear Power Reactor Decommissioning Market Revenue Share (%), by Country 2025 & 2033
- Figure 26: South America Nuclear Power Reactor Decommissioning Market Revenue (million), by Reactor Type 2025 & 2033
- Figure 27: South America Nuclear Power Reactor Decommissioning Market Revenue Share (%), by Reactor Type 2025 & 2033
- Figure 28: South America Nuclear Power Reactor Decommissioning Market Revenue (million), by Application 2025 & 2033
- Figure 29: South America Nuclear Power Reactor Decommissioning Market Revenue Share (%), by Application 2025 & 2033
- Figure 30: South America Nuclear Power Reactor Decommissioning Market Revenue (million), by Capacity 2025 & 2033
- Figure 31: South America Nuclear Power Reactor Decommissioning Market Revenue Share (%), by Capacity 2025 & 2033
- Figure 32: South America Nuclear Power Reactor Decommissioning Market Revenue (million), by Country 2025 & 2033
- Figure 33: South America Nuclear Power Reactor Decommissioning Market Revenue Share (%), by Country 2025 & 2033
- Figure 34: Middle East and Africa Nuclear Power Reactor Decommissioning Market Revenue (million), by Reactor Type 2025 & 2033
- Figure 35: Middle East and Africa Nuclear Power Reactor Decommissioning Market Revenue Share (%), by Reactor Type 2025 & 2033
- Figure 36: Middle East and Africa Nuclear Power Reactor Decommissioning Market Revenue (million), by Application 2025 & 2033
- Figure 37: Middle East and Africa Nuclear Power Reactor Decommissioning Market Revenue Share (%), by Application 2025 & 2033
- Figure 38: Middle East and Africa Nuclear Power Reactor Decommissioning Market Revenue (million), by Capacity 2025 & 2033
- Figure 39: Middle East and Africa Nuclear Power Reactor Decommissioning Market Revenue Share (%), by Capacity 2025 & 2033
- Figure 40: Middle East and Africa Nuclear Power Reactor Decommissioning Market Revenue (million), by Country 2025 & 2033
- Figure 41: Middle East and Africa Nuclear Power Reactor Decommissioning Market Revenue Share (%), by Country 2025 & 2033
List of Tables
- Table 1: Global Nuclear Power Reactor Decommissioning Market Revenue million Forecast, by Reactor Type 2020 & 2033
- Table 2: Global Nuclear Power Reactor Decommissioning Market Revenue million Forecast, by Application 2020 & 2033
- Table 3: Global Nuclear Power Reactor Decommissioning Market Revenue million Forecast, by Capacity 2020 & 2033
- Table 4: Global Nuclear Power Reactor Decommissioning Market Revenue million Forecast, by Region 2020 & 2033
- Table 5: Global Nuclear Power Reactor Decommissioning Market Revenue million Forecast, by Reactor Type 2020 & 2033
- Table 6: Global Nuclear Power Reactor Decommissioning Market Revenue million Forecast, by Application 2020 & 2033
- Table 7: Global Nuclear Power Reactor Decommissioning Market Revenue million Forecast, by Capacity 2020 & 2033
- Table 8: Global Nuclear Power Reactor Decommissioning Market Revenue million Forecast, by Country 2020 & 2033
- Table 9: Global Nuclear Power Reactor Decommissioning Market Revenue million Forecast, by Reactor Type 2020 & 2033
- Table 10: Global Nuclear Power Reactor Decommissioning Market Revenue million Forecast, by Application 2020 & 2033
- Table 11: Global Nuclear Power Reactor Decommissioning Market Revenue million Forecast, by Capacity 2020 & 2033
- Table 12: Global Nuclear Power Reactor Decommissioning Market Revenue million Forecast, by Country 2020 & 2033
- Table 13: Global Nuclear Power Reactor Decommissioning Market Revenue million Forecast, by Reactor Type 2020 & 2033
- Table 14: Global Nuclear Power Reactor Decommissioning Market Revenue million Forecast, by Application 2020 & 2033
- Table 15: Global Nuclear Power Reactor Decommissioning Market Revenue million Forecast, by Capacity 2020 & 2033
- Table 16: Global Nuclear Power Reactor Decommissioning Market Revenue million Forecast, by Country 2020 & 2033
- Table 17: Global Nuclear Power Reactor Decommissioning Market Revenue million Forecast, by Reactor Type 2020 & 2033
- Table 18: Global Nuclear Power Reactor Decommissioning Market Revenue million Forecast, by Application 2020 & 2033
- Table 19: Global Nuclear Power Reactor Decommissioning Market Revenue million Forecast, by Capacity 2020 & 2033
- Table 20: Global Nuclear Power Reactor Decommissioning Market Revenue million Forecast, by Country 2020 & 2033
- Table 21: Global Nuclear Power Reactor Decommissioning Market Revenue million Forecast, by Reactor Type 2020 & 2033
- Table 22: Global Nuclear Power Reactor Decommissioning Market Revenue million Forecast, by Application 2020 & 2033
- Table 23: Global Nuclear Power Reactor Decommissioning Market Revenue million Forecast, by Capacity 2020 & 2033
- Table 24: Global Nuclear Power Reactor Decommissioning Market Revenue million Forecast, by Country 2020 & 2033
Frequently Asked Questions
1. What is the projected Compound Annual Growth Rate (CAGR) of the Nuclear Power Reactor Decommissioning Market?
The projected CAGR is approximately 4%.
2. Which companies are prominent players in the Nuclear Power Reactor Decommissioning Market?
Key companies in the market include Aecom, Orano Group, Westinghouse Electric Company*List Not Exhaustive, Enercon Services Inc, NorthStar Group Services Inc, GE Hitachi Nuclear Services, James Fisher & Sons PLC, Bechtel Group Inc, Fluor Corporation, Babcock International Group PLC, Studsvik AB.
3. What are the main segments of the Nuclear Power Reactor Decommissioning Market?
The market segments include Reactor Type, Application, Capacity.
4. Can you provide details about the market size?
The market size is estimated to be USD 8170.1 million as of 2022.
5. What are some drivers contributing to market growth?
4.; Presence of Strict Government Regulations to Control Air Pollution.
6. What are the notable trends driving market growth?
Commercial Reactors Segment is Expected to Dominate the Market.
7. Are there any restraints impacting market growth?
4.; Increasing Adoption of Renewable Energy.
8. Can you provide examples of recent developments in the market?
N/A
9. What pricing options are available for accessing the report?
Pricing options include single-user, multi-user, and enterprise licenses priced at USD 4750, USD 5250, and USD 8750 respectively.
10. Is the market size provided in terms of value or volume?
The market size is provided in terms of value, measured in million.
11. Are there any specific market keywords associated with the report?
Yes, the market keyword associated with the report is "Nuclear Power Reactor Decommissioning Market," which aids in identifying and referencing the specific market segment covered.
12. How do I determine which pricing option suits my needs best?
The pricing options vary based on user requirements and access needs. Individual users may opt for single-user licenses, while businesses requiring broader access may choose multi-user or enterprise licenses for cost-effective access to the report.
13. Are there any additional resources or data provided in the Nuclear Power Reactor Decommissioning Market report?
While the report offers comprehensive insights, it's advisable to review the specific contents or supplementary materials provided to ascertain if additional resources or data are available.
14. How can I stay updated on further developments or reports in the Nuclear Power Reactor Decommissioning Market?
To stay informed about further developments, trends, and reports in the Nuclear Power Reactor Decommissioning Market, consider subscribing to industry newsletters, following relevant companies and organizations, or regularly checking reputable industry news sources and publications.
Methodology
Step 1 - Identification of Relevant Samples Size from Population Database


Step 2 - Approaches for Defining Global Market Size (Value, Volume* & Price*)

Note*: In applicable scenarios
Step 3 - Data Sources
Primary Research
- Web Analytics
- Survey Reports
- Research Institute
- Latest Research Reports
- Opinion Leaders
Secondary Research
- Annual Reports
- White Paper
- Latest Press Release
- Industry Association
- Paid Database
- Investor Presentations

Step 4 - Data Triangulation
Involves using different sources of information in order to increase the validity of a study
These sources are likely to be stakeholders in a program - participants, other researchers, program staff, other community members, and so on.
Then we put all data in single framework & apply various statistical tools to find out the dynamic on the market.
During the analysis stage, feedback from the stakeholder groups would be compared to determine areas of agreement as well as areas of divergence