

Key Insights
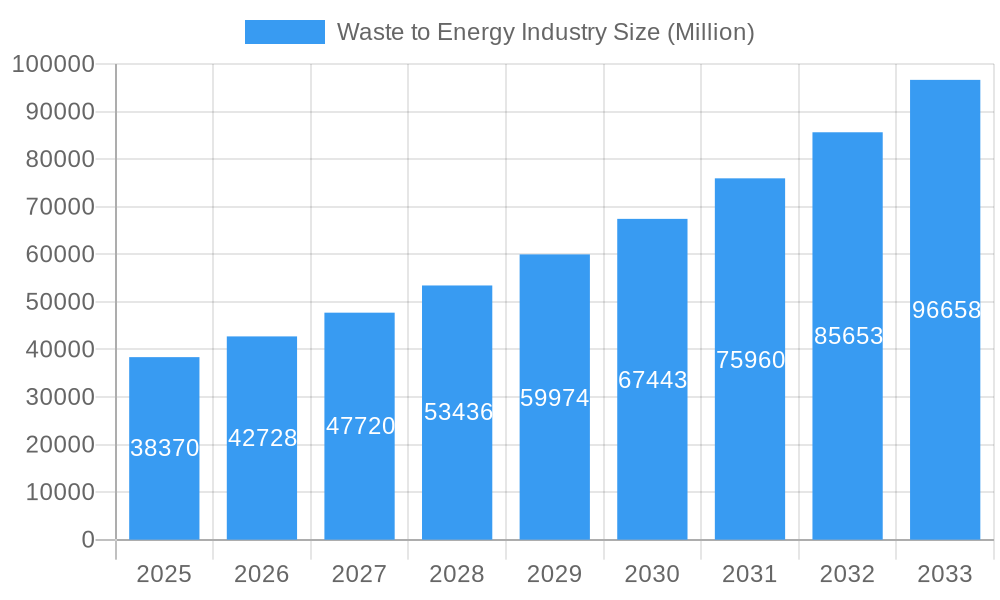
The global waste-to-energy (WtE) market, valued at $38.37 billion in 2025, is experiencing robust growth, projected to expand at a Compound Annual Growth Rate (CAGR) of 11.22% from 2025 to 2033. This surge is driven by several key factors. Stringent government regulations aimed at reducing landfill waste and promoting sustainable waste management practices are creating significant demand for WtE technologies. The increasing scarcity of landfill space, coupled with rising environmental concerns, further fuels market expansion. Moreover, advancements in WtE technologies, particularly in the areas of thermal and biological conversion, are enhancing efficiency and reducing environmental impact, making them more attractive to both private and public sector stakeholders. The shift towards renewable energy sources and the potential for WtE plants to generate electricity and valuable byproducts like biofuels also contribute to the market's growth trajectory. Technological advancements continue to improve efficiency and reduce emissions, making waste-to-energy a more environmentally friendly and economically viable option.
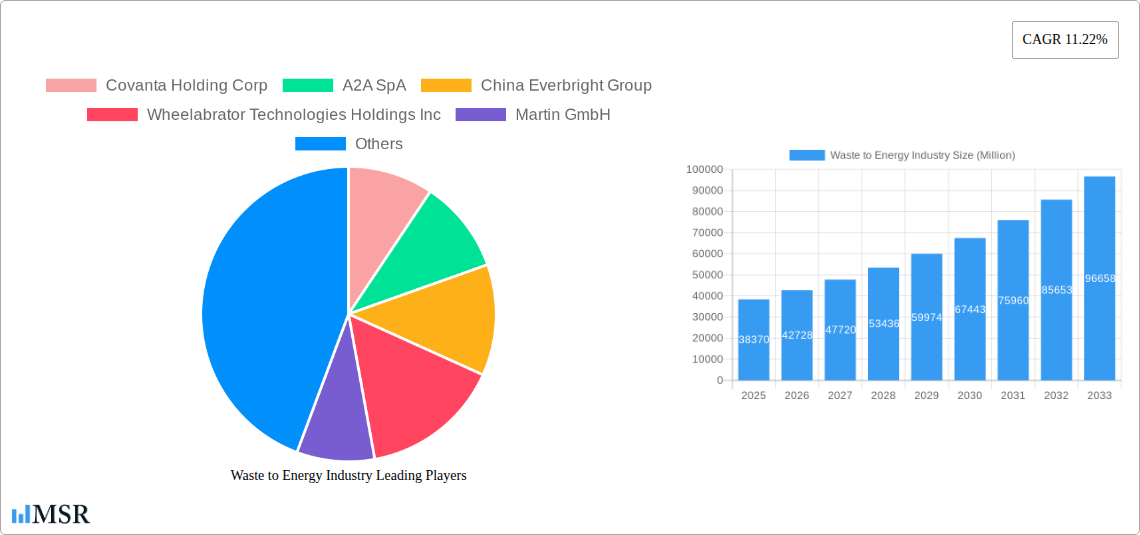
Waste to Energy Industry Market Size (In Billion)
Growth is further segmented by technology type, with thermal conversion (incineration with energy recovery) currently dominating the market, followed by biological conversion (anaerobic digestion and composting). However, the physical conversion segment, encompassing mechanical biological treatment (MBT), is poised for substantial growth due to its capacity to handle diverse waste streams and produce valuable recyclables. Geographically, North America and Europe hold significant market share, driven by established infrastructure and supportive regulatory environments. However, the Asia-Pacific region, particularly China and India, is expected to witness the fastest growth due to rapid urbanization, rising waste generation, and government initiatives promoting WtE adoption. Key players in the market include established international corporations and regional players focusing on innovation and expansion. While the market faces challenges such as high initial investment costs and public perception concerns regarding potential environmental impacts, ongoing technological advancements and supportive government policies are expected to mitigate these limitations, ensuring continued market growth over the forecast period.
Waste to Energy Industry Company Market Share
Waste-to-Energy Industry Market Report: 2019-2033
This comprehensive report provides a detailed analysis of the global waste-to-energy market, offering invaluable insights for stakeholders, investors, and industry professionals. With a study period spanning 2019-2033, a base year of 2025, and a forecast period of 2025-2033, this report leverages extensive data and expert analysis to illuminate current market dynamics and future growth trajectories. The market is valued at USD xx Million in 2025 and is projected to reach USD xx Million by 2033, exhibiting a CAGR of xx%.
Waste to Energy Industry Market Concentration & Dynamics
The global waste-to-energy market demonstrates a moderately concentrated landscape, with a handful of multinational corporations holding significant market share. Companies like Covanta Holding Corp, Veolia Environnement SA, and Waste Management Inc. command leading positions, driven by their extensive operational footprints and technological expertise. However, the market also features a dynamic ecosystem of smaller, specialized players and regional operators, fostering competition and innovation.
Market Concentration Metrics (2025):
- Top 5 players: xx% market share
- Top 10 players: xx% market share
Market Dynamics:
- Innovation Ecosystems: Significant investments in research and development are driving advancements in waste-to-energy technologies, particularly in areas such as advanced thermal treatment and bioenergy production.
- Regulatory Frameworks: Government policies aimed at reducing landfill waste and promoting renewable energy are shaping market growth, with variations in regulations across different geographies.
- Substitute Products: While waste-to-energy offers a sustainable alternative to landfill disposal, it faces competition from other waste management solutions, including recycling and anaerobic digestion.
- End-User Trends: Increasing environmental awareness and the growing need for sustainable energy solutions are driving demand for waste-to-energy services across residential, commercial, and industrial sectors.
- M&A Activities: The waste-to-energy sector has witnessed a considerable number of mergers and acquisitions (M&As) in recent years (xx deals in the last 5 years), reflecting consolidation trends and strategic expansions by major players.
Waste to Energy Industry Industry Insights & Trends
The waste-to-energy market is experiencing robust growth, propelled by several key factors. Stringent environmental regulations globally are pushing for a reduction in landfill waste, creating a fertile ground for waste-to-energy solutions. Simultaneously, the urgent need for renewable energy sources and diversification of energy portfolios is further fueling the demand. Technological advancements, especially in improving energy efficiency and reducing emissions, are also contributing to the market expansion. Furthermore, increasing urbanization and industrialization are leading to a surge in waste generation, providing a substantial feedstock for waste-to-energy plants. Consumer behavior is evolving towards greater environmental consciousness, fostering a demand for sustainable waste management solutions. This positive interplay of regulatory pressures, technological breakthroughs, and evolving consumer preferences is predicted to maintain the market's robust growth trajectory throughout the forecast period.
Key Markets & Segments Leading Waste to Energy Industry
The global waste-to-energy market demonstrates significant regional variations in growth and adoption. While developed economies like Europe and North America are relatively mature markets, developing countries in Asia and Africa present immense potential for growth. China, with its massive waste generation and ambitious renewable energy targets, is a key market. Similarly, the increasing awareness of environmental issues and governments' push for sustainable solutions in emerging economies are driving significant investments and infrastructure development within the waste-to-energy sector.
Dominant Segment: Thermal Technology
Thermal technologies currently hold the largest market share within the waste-to-energy sector due to their established maturity, relatively lower costs, and suitability for diverse waste streams.
Drivers:
- Economic Growth: Rapid economic development in emerging markets is increasing waste generation, providing fuel for waste-to-energy plants.
- Infrastructure Development: Investment in new waste-to-energy infrastructure is crucial for market expansion, especially in developing regions.
Waste to Energy Industry Product Developments
Recent advancements in waste-to-energy technologies are focused on enhancing energy efficiency, reducing greenhouse gas emissions, and improving the overall sustainability of waste processing. Innovations include advanced gasification systems, improved energy recovery techniques, and technologies aimed at extracting valuable resources from waste streams. This drives growth by offering improved cost-effectiveness and reduced environmental impact, enhancing the sector's competitiveness.
Challenges in the Waste to Energy Industry Market
The waste-to-energy industry faces challenges, including stringent environmental regulations, requiring significant capital investment to meet emission standards. Supply chain disruptions can impact plant operations, and obtaining permits and licenses for waste-to-energy facilities can be time-consuming and complex. Competition from other waste management solutions and fluctuating energy prices also influence profitability. The high upfront capital costs and potential public opposition to new plants present further obstacles. These factors can collectively impede the industry's growth potential if not carefully addressed.
Forces Driving Waste to Energy Industry Growth
Technological advancements, particularly in waste gasification and plasma technologies, are boosting efficiency and reducing emissions. Government support through incentives and subsidies is crucial for fostering adoption. Stringent landfill regulations in many countries are driving the shift toward waste-to-energy solutions. The rising cost of landfill disposal, coupled with environmental concerns, is further incentivizing this transition. Increased focus on renewable energy targets globally contributes significantly to market growth.
Long-Term Growth Catalysts in the Waste to Energy Industry
Long-term growth will be driven by continued innovation in waste-to-energy technologies, leading to higher energy efficiency and reduced emissions. Strategic partnerships between waste management companies and energy producers will facilitate large-scale project development. Expansion into new geographic markets, especially developing economies, will provide substantial growth opportunities. The integration of waste-to-energy with other circular economy initiatives, such as material recovery, will further accelerate market expansion.
Emerging Opportunities in Waste to Energy Industry
The integration of waste-to-energy with smart city initiatives presents substantial opportunities. The development of advanced bioenergy technologies from organic waste will provide new revenue streams. Increased focus on producing valuable by-products from waste processing offers growth potential. The exploration of new waste streams, like plastic waste, provides a large untapped market. These developments are expected to drive significant investment and expansion in the sector.
Leading Players in the Waste to Energy Industry Sector
- Covanta Holding Corp
- A2A SpA
- China Everbright Group
- Wheelabrator Technologies Holdings Inc
- Martin GmbH
- Hitachi Zosen Corp
- Suez Group
- China Jinjiang Environment Holding Co Ltd
- Veolia Environnement SA
- Waste Management Inc
- Babcock & Wilcox Enterprises Inc
- Xcel Energy Inc
- MVV Energie AG
- Mitsubishi Heavy Industries Ltd
Key Milestones in Waste to Energy Industry Industry
- April 2023: Egypt signs a USD 120 Million contract for its first solid waste-to-electricity facility (Abou Rawash, Giza), processing 1,200 metric tons of waste daily. This signals significant growth potential in the African market.
- January 2023: Lostock Sustainable Energy Plant awards Babcock & Wilcox a USD 65 Million contract for a waste-to-energy plant near Manchester, UK, processing 600,000 metric tons annually and generating over 60 MW of power. This underscores the increasing investment in the European market.
Strategic Outlook for Waste to Energy Industry Market
The waste-to-energy market is poised for significant growth, driven by favorable government policies, technological advancements, and the growing need for sustainable waste management solutions. Strategic investments in innovative technologies, along with the expansion into new geographic markets, present lucrative opportunities for industry players. Focus on enhancing operational efficiency, optimizing energy recovery, and mitigating environmental impacts will be key to achieving long-term success. The increasing demand for renewable energy and the growing concerns over climate change are expected to further fuel the sector's growth in the coming years.
Waste to Energy Industry Segmentation
-
1. Technology
- 1.1. Physical
- 1.2. Thermal
- 1.3. Biological
Waste to Energy Industry Segmentation By Geography
-
1. North America
- 1.1. United States
- 1.2. Canada
- 1.3. Rest of North America
-
2. Asia Pacific
- 2.1. China
- 2.2. India
- 2.3. Japan
- 2.4. Malaysia
- 2.5. Thailand
- 2.6. Indonesia
- 2.7. Vietnam
- 2.8. Rest of Asia Pacific
-
3. Europe
- 3.1. Spain
- 3.2. Nordic
- 3.3. United Kingdom
- 3.4. Russia
- 3.5. Turkey
- 3.6. Germany
- 3.7. Italy
- 3.8. Rest of Europe
-
4. Middle East and Africa
- 4.1. United Arab Emirates
- 4.2. Saudi Arabia
- 4.3. South Africa
- 4.4. Nigeria
- 4.5. Qatar
- 4.6. Egypt
- 4.7. Rest of Middle East and Africa
-
5. South America
- 5.1. Brazil
- 5.2. Argentina
- 5.3. Colombia
- 5.4. Rest of South America
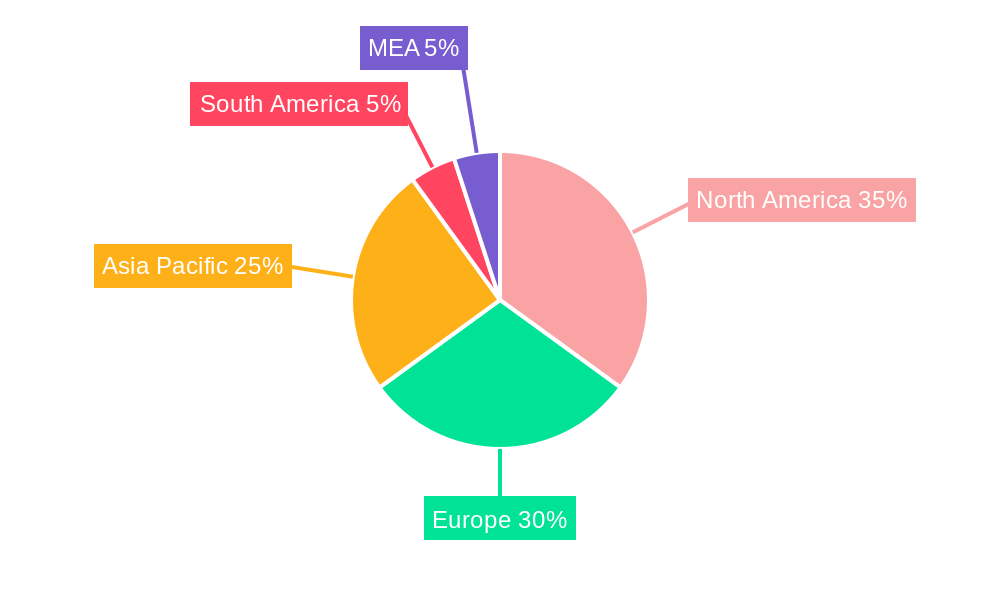
Waste to Energy Industry Regional Market Share
Geographic Coverage of Waste to Energy Industry
Waste to Energy Industry REPORT HIGHLIGHTS
| Aspects | Details |
|---|---|
| Study Period | 2020-2034 |
| Base Year | 2025 |
| Estimated Year | 2026 |
| Forecast Period | 2026-2034 |
| Historical Period | 2020-2025 |
| Growth Rate | CAGR of 11.22% from 2020-2034 |
| Segmentation |
|
Table of Contents
- 1. Introduction
- 1.1. Research Scope
- 1.2. Market Segmentation
- 1.3. Research Objective
- 1.4. Definitions and Assumptions
- 2. Executive Summary
- 2.1. Market Snapshot
- 3. Market Dynamics
- 3.1. Market Drivers
- 3.2. Market Restrains
- 3.3. Market Trends
- 3.4. Market Opportunities
- 4. Market Factor Analysis
- 4.1. Porters Five Forces
- 4.1.1. Bargaining Power of Suppliers
- 4.1.2. Bargaining Power of Buyers
- 4.1.3. Threat of New Entrants
- 4.1.4. Threat of Substitutes
- 4.1.5. Competitive Rivalry
- 4.2. PESTEL analysis
- 4.3. BCG Analysis
- 4.3.1. Stars (High Growth, High Market Share)
- 4.3.2. Cash Cows (Low Growth, High Market Share)
- 4.3.3. Question Mark (High Growth, Low Market Share)
- 4.3.4. Dogs (Low Growth, Low Market Share)
- 4.4. Ansoff Matrix Analysis
- 4.5. Supply Chain Analysis
- 4.6. Regulatory Landscape
- 4.7. Current Market Potential and Opportunity Assessment (TAM–SAM–SOM Framework)
- 4.8. MSR Analyst Note
- 4.1. Porters Five Forces
- 5. Market Analysis, Insights and Forecast 2021-2033
- 5.1. Market Analysis, Insights and Forecast - by Technology
- 5.1.1. Physical
- 5.1.2. Thermal
- 5.1.3. Biological
- 5.2. Market Analysis, Insights and Forecast - by Region
- 5.2.1. North America
- 5.2.2. Asia Pacific
- 5.2.3. Europe
- 5.2.4. Middle East and Africa
- 5.2.5. South America
- 5.1. Market Analysis, Insights and Forecast - by Technology
- 6. Global Waste to Energy Industry Analysis, Insights and Forecast, 2021-2033
- 6.1. Market Analysis, Insights and Forecast - by Technology
- 6.1.1. Physical
- 6.1.2. Thermal
- 6.1.3. Biological
- 6.1. Market Analysis, Insights and Forecast - by Technology
- 7. North America Waste to Energy Industry Analysis, Insights and Forecast, 2020-2032
- 7.1. Market Analysis, Insights and Forecast - by Technology
- 7.1.1. Physical
- 7.1.2. Thermal
- 7.1.3. Biological
- 7.1. Market Analysis, Insights and Forecast - by Technology
- 8. Asia Pacific Waste to Energy Industry Analysis, Insights and Forecast, 2020-2032
- 8.1. Market Analysis, Insights and Forecast - by Technology
- 8.1.1. Physical
- 8.1.2. Thermal
- 8.1.3. Biological
- 8.1. Market Analysis, Insights and Forecast - by Technology
- 9. Europe Waste to Energy Industry Analysis, Insights and Forecast, 2020-2032
- 9.1. Market Analysis, Insights and Forecast - by Technology
- 9.1.1. Physical
- 9.1.2. Thermal
- 9.1.3. Biological
- 9.1. Market Analysis, Insights and Forecast - by Technology
- 10. Middle East and Africa Waste to Energy Industry Analysis, Insights and Forecast, 2020-2032
- 10.1. Market Analysis, Insights and Forecast - by Technology
- 10.1.1. Physical
- 10.1.2. Thermal
- 10.1.3. Biological
- 10.1. Market Analysis, Insights and Forecast - by Technology
- 11. South America Waste to Energy Industry Analysis, Insights and Forecast, 2020-2032
- 11.1. Market Analysis, Insights and Forecast - by Technology
- 11.1.1. Physical
- 11.1.2. Thermal
- 11.1.3. Biological
- 11.1. Market Analysis, Insights and Forecast - by Technology
- 12. Competitive Analysis
- 12.1. Company Profiles
- 12.1.1 Covanta Holding Corp
- 12.1.1.1. Company Overview
- 12.1.1.2. Products
- 12.1.1.3. Company Financials
- 12.1.1.4. SWOT Analysis
- 12.1.2 A2A SpA
- 12.1.2.1. Company Overview
- 12.1.2.2. Products
- 12.1.2.3. Company Financials
- 12.1.2.4. SWOT Analysis
- 12.1.3 China Everbright Group
- 12.1.3.1. Company Overview
- 12.1.3.2. Products
- 12.1.3.3. Company Financials
- 12.1.3.4. SWOT Analysis
- 12.1.4 Wheelabrator Technologies Holdings Inc
- 12.1.4.1. Company Overview
- 12.1.4.2. Products
- 12.1.4.3. Company Financials
- 12.1.4.4. SWOT Analysis
- 12.1.5 Martin GmbH
- 12.1.5.1. Company Overview
- 12.1.5.2. Products
- 12.1.5.3. Company Financials
- 12.1.5.4. SWOT Analysis
- 12.1.6 Hitachi Zosen Corp
- 12.1.6.1. Company Overview
- 12.1.6.2. Products
- 12.1.6.3. Company Financials
- 12.1.6.4. SWOT Analysis
- 12.1.7 Suez Group
- 12.1.7.1. Company Overview
- 12.1.7.2. Products
- 12.1.7.3. Company Financials
- 12.1.7.4. SWOT Analysis
- 12.1.8 China Jinjiang Environment Holding Co Ltd
- 12.1.8.1. Company Overview
- 12.1.8.2. Products
- 12.1.8.3. Company Financials
- 12.1.8.4. SWOT Analysis
- 12.1.9 Veolia Environnement SA
- 12.1.9.1. Company Overview
- 12.1.9.2. Products
- 12.1.9.3. Company Financials
- 12.1.9.4. SWOT Analysis
- 12.1.10 Waste Management Inc
- 12.1.10.1. Company Overview
- 12.1.10.2. Products
- 12.1.10.3. Company Financials
- 12.1.10.4. SWOT Analysis
- 12.1.11 Babcock & Wilcox Enterprises Inc
- 12.1.11.1. Company Overview
- 12.1.11.2. Products
- 12.1.11.3. Company Financials
- 12.1.11.4. SWOT Analysis
- 12.1.12 Xcel Energy Inc
- 12.1.12.1. Company Overview
- 12.1.12.2. Products
- 12.1.12.3. Company Financials
- 12.1.12.4. SWOT Analysis
- 12.1.13 MVV Energie AG
- 12.1.13.1. Company Overview
- 12.1.13.2. Products
- 12.1.13.3. Company Financials
- 12.1.13.4. SWOT Analysis
- 12.1.14 Mitsubishi Heavy Industries Ltd
- 12.1.14.1. Company Overview
- 12.1.14.2. Products
- 12.1.14.3. Company Financials
- 12.1.14.4. SWOT Analysis
- 12.1.1 Covanta Holding Corp
- 12.2. Market Entropy
- 12.2.1 Company's Key Areas Served
- 12.2.2 Recent Developments
- 12.3. Company Market Share Analysis 2025
- 12.3.1 Top 5 Companies Market Share Analysis
- 12.3.2 Top 3 Companies Market Share Analysis
- 12.4. List of Potential Customers
- 13. Research Methodology
List of Figures
- Figure 1: Global Waste to Energy Industry Revenue Breakdown (Million, %) by Region 2025 & 2033
- Figure 2: Global Waste to Energy Industry Volume Breakdown (Gigawatt, %) by Region 2025 & 2033
- Figure 3: North America Waste to Energy Industry Revenue (Million), by Technology 2025 & 2033
- Figure 4: North America Waste to Energy Industry Volume (Gigawatt), by Technology 2025 & 2033
- Figure 5: North America Waste to Energy Industry Revenue Share (%), by Technology 2025 & 2033
- Figure 6: North America Waste to Energy Industry Volume Share (%), by Technology 2025 & 2033
- Figure 7: North America Waste to Energy Industry Revenue (Million), by Country 2025 & 2033
- Figure 8: North America Waste to Energy Industry Volume (Gigawatt), by Country 2025 & 2033
- Figure 9: North America Waste to Energy Industry Revenue Share (%), by Country 2025 & 2033
- Figure 10: North America Waste to Energy Industry Volume Share (%), by Country 2025 & 2033
- Figure 11: Asia Pacific Waste to Energy Industry Revenue (Million), by Technology 2025 & 2033
- Figure 12: Asia Pacific Waste to Energy Industry Volume (Gigawatt), by Technology 2025 & 2033
- Figure 13: Asia Pacific Waste to Energy Industry Revenue Share (%), by Technology 2025 & 2033
- Figure 14: Asia Pacific Waste to Energy Industry Volume Share (%), by Technology 2025 & 2033
- Figure 15: Asia Pacific Waste to Energy Industry Revenue (Million), by Country 2025 & 2033
- Figure 16: Asia Pacific Waste to Energy Industry Volume (Gigawatt), by Country 2025 & 2033
- Figure 17: Asia Pacific Waste to Energy Industry Revenue Share (%), by Country 2025 & 2033
- Figure 18: Asia Pacific Waste to Energy Industry Volume Share (%), by Country 2025 & 2033
- Figure 19: Europe Waste to Energy Industry Revenue (Million), by Technology 2025 & 2033
- Figure 20: Europe Waste to Energy Industry Volume (Gigawatt), by Technology 2025 & 2033
- Figure 21: Europe Waste to Energy Industry Revenue Share (%), by Technology 2025 & 2033
- Figure 22: Europe Waste to Energy Industry Volume Share (%), by Technology 2025 & 2033
- Figure 23: Europe Waste to Energy Industry Revenue (Million), by Country 2025 & 2033
- Figure 24: Europe Waste to Energy Industry Volume (Gigawatt), by Country 2025 & 2033
- Figure 25: Europe Waste to Energy Industry Revenue Share (%), by Country 2025 & 2033
- Figure 26: Europe Waste to Energy Industry Volume Share (%), by Country 2025 & 2033
- Figure 27: Middle East and Africa Waste to Energy Industry Revenue (Million), by Technology 2025 & 2033
- Figure 28: Middle East and Africa Waste to Energy Industry Volume (Gigawatt), by Technology 2025 & 2033
- Figure 29: Middle East and Africa Waste to Energy Industry Revenue Share (%), by Technology 2025 & 2033
- Figure 30: Middle East and Africa Waste to Energy Industry Volume Share (%), by Technology 2025 & 2033
- Figure 31: Middle East and Africa Waste to Energy Industry Revenue (Million), by Country 2025 & 2033
- Figure 32: Middle East and Africa Waste to Energy Industry Volume (Gigawatt), by Country 2025 & 2033
- Figure 33: Middle East and Africa Waste to Energy Industry Revenue Share (%), by Country 2025 & 2033
- Figure 34: Middle East and Africa Waste to Energy Industry Volume Share (%), by Country 2025 & 2033
- Figure 35: South America Waste to Energy Industry Revenue (Million), by Technology 2025 & 2033
- Figure 36: South America Waste to Energy Industry Volume (Gigawatt), by Technology 2025 & 2033
- Figure 37: South America Waste to Energy Industry Revenue Share (%), by Technology 2025 & 2033
- Figure 38: South America Waste to Energy Industry Volume Share (%), by Technology 2025 & 2033
- Figure 39: South America Waste to Energy Industry Revenue (Million), by Country 2025 & 2033
- Figure 40: South America Waste to Energy Industry Volume (Gigawatt), by Country 2025 & 2033
- Figure 41: South America Waste to Energy Industry Revenue Share (%), by Country 2025 & 2033
- Figure 42: South America Waste to Energy Industry Volume Share (%), by Country 2025 & 2033
List of Tables
- Table 1: Global Waste to Energy Industry Revenue Million Forecast, by Technology 2020 & 2033
- Table 2: Global Waste to Energy Industry Volume Gigawatt Forecast, by Technology 2020 & 2033
- Table 3: Global Waste to Energy Industry Revenue Million Forecast, by Region 2020 & 2033
- Table 4: Global Waste to Energy Industry Volume Gigawatt Forecast, by Region 2020 & 2033
- Table 5: Global Waste to Energy Industry Revenue Million Forecast, by Technology 2020 & 2033
- Table 6: Global Waste to Energy Industry Volume Gigawatt Forecast, by Technology 2020 & 2033
- Table 7: Global Waste to Energy Industry Revenue Million Forecast, by Country 2020 & 2033
- Table 8: Global Waste to Energy Industry Volume Gigawatt Forecast, by Country 2020 & 2033
- Table 9: United States Waste to Energy Industry Revenue (Million) Forecast, by Application 2020 & 2033
- Table 10: United States Waste to Energy Industry Volume (Gigawatt) Forecast, by Application 2020 & 2033
- Table 11: Canada Waste to Energy Industry Revenue (Million) Forecast, by Application 2020 & 2033
- Table 12: Canada Waste to Energy Industry Volume (Gigawatt) Forecast, by Application 2020 & 2033
- Table 13: Rest of North America Waste to Energy Industry Revenue (Million) Forecast, by Application 2020 & 2033
- Table 14: Rest of North America Waste to Energy Industry Volume (Gigawatt) Forecast, by Application 2020 & 2033
- Table 15: Global Waste to Energy Industry Revenue Million Forecast, by Technology 2020 & 2033
- Table 16: Global Waste to Energy Industry Volume Gigawatt Forecast, by Technology 2020 & 2033
- Table 17: Global Waste to Energy Industry Revenue Million Forecast, by Country 2020 & 2033
- Table 18: Global Waste to Energy Industry Volume Gigawatt Forecast, by Country 2020 & 2033
- Table 19: China Waste to Energy Industry Revenue (Million) Forecast, by Application 2020 & 2033
- Table 20: China Waste to Energy Industry Volume (Gigawatt) Forecast, by Application 2020 & 2033
- Table 21: India Waste to Energy Industry Revenue (Million) Forecast, by Application 2020 & 2033
- Table 22: India Waste to Energy Industry Volume (Gigawatt) Forecast, by Application 2020 & 2033
- Table 23: Japan Waste to Energy Industry Revenue (Million) Forecast, by Application 2020 & 2033
- Table 24: Japan Waste to Energy Industry Volume (Gigawatt) Forecast, by Application 2020 & 2033
- Table 25: Malaysia Waste to Energy Industry Revenue (Million) Forecast, by Application 2020 & 2033
- Table 26: Malaysia Waste to Energy Industry Volume (Gigawatt) Forecast, by Application 2020 & 2033
- Table 27: Thailand Waste to Energy Industry Revenue (Million) Forecast, by Application 2020 & 2033
- Table 28: Thailand Waste to Energy Industry Volume (Gigawatt) Forecast, by Application 2020 & 2033
- Table 29: Indonesia Waste to Energy Industry Revenue (Million) Forecast, by Application 2020 & 2033
- Table 30: Indonesia Waste to Energy Industry Volume (Gigawatt) Forecast, by Application 2020 & 2033
- Table 31: Vietnam Waste to Energy Industry Revenue (Million) Forecast, by Application 2020 & 2033
- Table 32: Vietnam Waste to Energy Industry Volume (Gigawatt) Forecast, by Application 2020 & 2033
- Table 33: Rest of Asia Pacific Waste to Energy Industry Revenue (Million) Forecast, by Application 2020 & 2033
- Table 34: Rest of Asia Pacific Waste to Energy Industry Volume (Gigawatt) Forecast, by Application 2020 & 2033
- Table 35: Global Waste to Energy Industry Revenue Million Forecast, by Technology 2020 & 2033
- Table 36: Global Waste to Energy Industry Volume Gigawatt Forecast, by Technology 2020 & 2033
- Table 37: Global Waste to Energy Industry Revenue Million Forecast, by Country 2020 & 2033
- Table 38: Global Waste to Energy Industry Volume Gigawatt Forecast, by Country 2020 & 2033
- Table 39: Spain Waste to Energy Industry Revenue (Million) Forecast, by Application 2020 & 2033
- Table 40: Spain Waste to Energy Industry Volume (Gigawatt) Forecast, by Application 2020 & 2033
- Table 41: Nordic Waste to Energy Industry Revenue (Million) Forecast, by Application 2020 & 2033
- Table 42: Nordic Waste to Energy Industry Volume (Gigawatt) Forecast, by Application 2020 & 2033
- Table 43: United Kingdom Waste to Energy Industry Revenue (Million) Forecast, by Application 2020 & 2033
- Table 44: United Kingdom Waste to Energy Industry Volume (Gigawatt) Forecast, by Application 2020 & 2033
- Table 45: Russia Waste to Energy Industry Revenue (Million) Forecast, by Application 2020 & 2033
- Table 46: Russia Waste to Energy Industry Volume (Gigawatt) Forecast, by Application 2020 & 2033
- Table 47: Turkey Waste to Energy Industry Revenue (Million) Forecast, by Application 2020 & 2033
- Table 48: Turkey Waste to Energy Industry Volume (Gigawatt) Forecast, by Application 2020 & 2033
- Table 49: Germany Waste to Energy Industry Revenue (Million) Forecast, by Application 2020 & 2033
- Table 50: Germany Waste to Energy Industry Volume (Gigawatt) Forecast, by Application 2020 & 2033
- Table 51: Italy Waste to Energy Industry Revenue (Million) Forecast, by Application 2020 & 2033
- Table 52: Italy Waste to Energy Industry Volume (Gigawatt) Forecast, by Application 2020 & 2033
- Table 53: Rest of Europe Waste to Energy Industry Revenue (Million) Forecast, by Application 2020 & 2033
- Table 54: Rest of Europe Waste to Energy Industry Volume (Gigawatt) Forecast, by Application 2020 & 2033
- Table 55: Global Waste to Energy Industry Revenue Million Forecast, by Technology 2020 & 2033
- Table 56: Global Waste to Energy Industry Volume Gigawatt Forecast, by Technology 2020 & 2033
- Table 57: Global Waste to Energy Industry Revenue Million Forecast, by Country 2020 & 2033
- Table 58: Global Waste to Energy Industry Volume Gigawatt Forecast, by Country 2020 & 2033
- Table 59: United Arab Emirates Waste to Energy Industry Revenue (Million) Forecast, by Application 2020 & 2033
- Table 60: United Arab Emirates Waste to Energy Industry Volume (Gigawatt) Forecast, by Application 2020 & 2033
- Table 61: Saudi Arabia Waste to Energy Industry Revenue (Million) Forecast, by Application 2020 & 2033
- Table 62: Saudi Arabia Waste to Energy Industry Volume (Gigawatt) Forecast, by Application 2020 & 2033
- Table 63: South Africa Waste to Energy Industry Revenue (Million) Forecast, by Application 2020 & 2033
- Table 64: South Africa Waste to Energy Industry Volume (Gigawatt) Forecast, by Application 2020 & 2033
- Table 65: Nigeria Waste to Energy Industry Revenue (Million) Forecast, by Application 2020 & 2033
- Table 66: Nigeria Waste to Energy Industry Volume (Gigawatt) Forecast, by Application 2020 & 2033
- Table 67: Qatar Waste to Energy Industry Revenue (Million) Forecast, by Application 2020 & 2033
- Table 68: Qatar Waste to Energy Industry Volume (Gigawatt) Forecast, by Application 2020 & 2033
- Table 69: Egypt Waste to Energy Industry Revenue (Million) Forecast, by Application 2020 & 2033
- Table 70: Egypt Waste to Energy Industry Volume (Gigawatt) Forecast, by Application 2020 & 2033
- Table 71: Rest of Middle East and Africa Waste to Energy Industry Revenue (Million) Forecast, by Application 2020 & 2033
- Table 72: Rest of Middle East and Africa Waste to Energy Industry Volume (Gigawatt) Forecast, by Application 2020 & 2033
- Table 73: Global Waste to Energy Industry Revenue Million Forecast, by Technology 2020 & 2033
- Table 74: Global Waste to Energy Industry Volume Gigawatt Forecast, by Technology 2020 & 2033
- Table 75: Global Waste to Energy Industry Revenue Million Forecast, by Country 2020 & 2033
- Table 76: Global Waste to Energy Industry Volume Gigawatt Forecast, by Country 2020 & 2033
- Table 77: Brazil Waste to Energy Industry Revenue (Million) Forecast, by Application 2020 & 2033
- Table 78: Brazil Waste to Energy Industry Volume (Gigawatt) Forecast, by Application 2020 & 2033
- Table 79: Argentina Waste to Energy Industry Revenue (Million) Forecast, by Application 2020 & 2033
- Table 80: Argentina Waste to Energy Industry Volume (Gigawatt) Forecast, by Application 2020 & 2033
- Table 81: Colombia Waste to Energy Industry Revenue (Million) Forecast, by Application 2020 & 2033
- Table 82: Colombia Waste to Energy Industry Volume (Gigawatt) Forecast, by Application 2020 & 2033
- Table 83: Rest of South America Waste to Energy Industry Revenue (Million) Forecast, by Application 2020 & 2033
- Table 84: Rest of South America Waste to Energy Industry Volume (Gigawatt) Forecast, by Application 2020 & 2033
Frequently Asked Questions
1. What is the projected Compound Annual Growth Rate (CAGR) of the Waste to Energy Industry?
The projected CAGR is approximately 11.22%.
2. Which companies are prominent players in the Waste to Energy Industry?
Key companies in the market include Covanta Holding Corp, A2A SpA, China Everbright Group, Wheelabrator Technologies Holdings Inc, Martin GmbH, Hitachi Zosen Corp, Suez Group, China Jinjiang Environment Holding Co Ltd, Veolia Environnement SA, Waste Management Inc, Babcock & Wilcox Enterprises Inc, Xcel Energy Inc, MVV Energie AG, Mitsubishi Heavy Industries Ltd.
3. What are the main segments of the Waste to Energy Industry?
The market segments include Technology.
4. Can you provide details about the market size?
The market size is estimated to be USD 38.37 Million as of 2022.
5. What are some drivers contributing to market growth?
4.; Increasing Amount of Waste Generation. Growing Concern for Waste Management to Meet the Needs for Sustainable Urban Living4.; Increasing Focus on Non-fossil Fuel Sources of Energy.
6. What are the notable trends driving market growth?
Thermal-based Waste-to-Energy Segment to Dominate the Market.
7. Are there any restraints impacting market growth?
4.; Expensive Nature of Incinerators.
8. Can you provide examples of recent developments in the market?
April 2023: Egypt signed a USD 120 million contract to design, develop, own, and manage the country's first solid waste-to-electricity facility. The contract was signed by the Giza governorate and a partnership consisting of Renergy Egypt and the National Authority for Military Production. As part of Egypt Vision 2030, the Abou Rawash, Giza plant would convert 1,200 metric tons of household solid waste per day to power.
9. What pricing options are available for accessing the report?
Pricing options include single-user, multi-user, and enterprise licenses priced at USD 4750, USD 5250, and USD 8750 respectively.
10. Is the market size provided in terms of value or volume?
The market size is provided in terms of value, measured in Million and volume, measured in Gigawatt.
11. Are there any specific market keywords associated with the report?
Yes, the market keyword associated with the report is "Waste to Energy Industry," which aids in identifying and referencing the specific market segment covered.
12. How do I determine which pricing option suits my needs best?
The pricing options vary based on user requirements and access needs. Individual users may opt for single-user licenses, while businesses requiring broader access may choose multi-user or enterprise licenses for cost-effective access to the report.
13. Are there any additional resources or data provided in the Waste to Energy Industry report?
While the report offers comprehensive insights, it's advisable to review the specific contents or supplementary materials provided to ascertain if additional resources or data are available.
14. How can I stay updated on further developments or reports in the Waste to Energy Industry?
To stay informed about further developments, trends, and reports in the Waste to Energy Industry, consider subscribing to industry newsletters, following relevant companies and organizations, or regularly checking reputable industry news sources and publications.
Methodology
Step 1 - Identification of Relevant Samples Size from Population Database


Step 2 - Approaches for Defining Global Market Size (Value, Volume* & Price*)

Note*: In applicable scenarios
Step 3 - Data Sources
Primary Research
- Web Analytics
- Survey Reports
- Research Institute
- Latest Research Reports
- Opinion Leaders
Secondary Research
- Annual Reports
- White Paper
- Latest Press Release
- Industry Association
- Paid Database
- Investor Presentations

Step 4 - Data Triangulation
Involves using different sources of information in order to increase the validity of a study
These sources are likely to be stakeholders in a program - participants, other researchers, program staff, other community members, and so on.
Then we put all data in single framework & apply various statistical tools to find out the dynamic on the market.
During the analysis stage, feedback from the stakeholder groups would be compared to determine areas of agreement as well as areas of divergence