

Key Insights
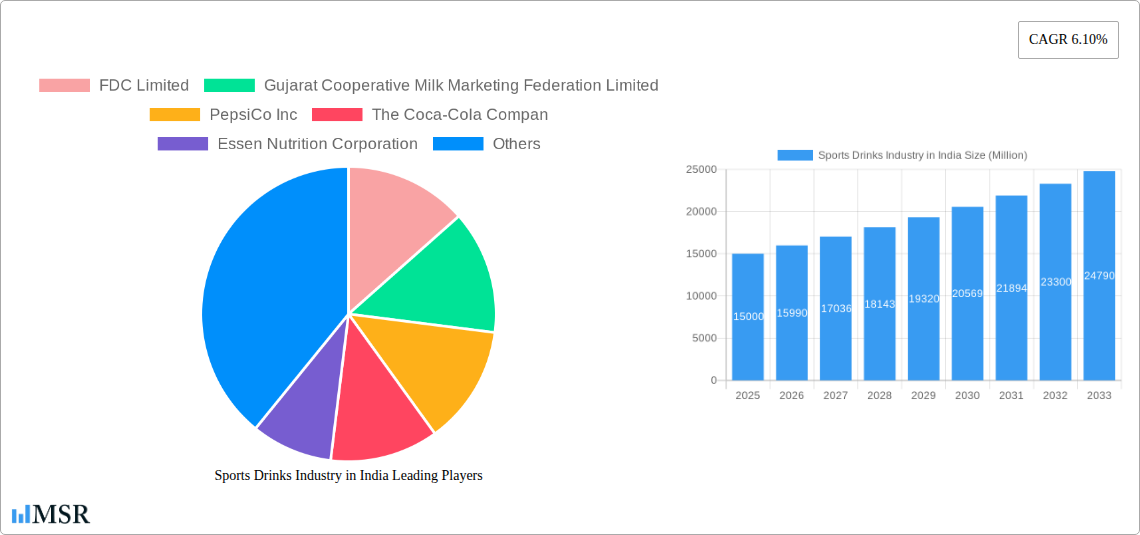
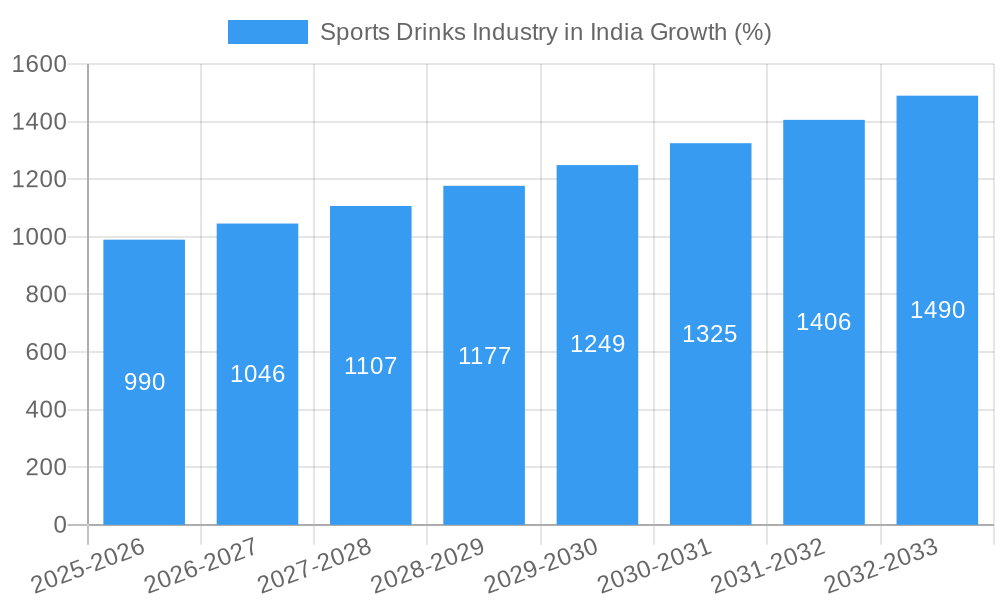
The Indian sports drinks market, valued at approximately ₹15000 million (estimated) in 2025, is poised for robust growth, exhibiting a Compound Annual Growth Rate (CAGR) of 6.10% from 2025 to 2033. This expansion is fueled by several key drivers. Rising health consciousness among Indian consumers, particularly younger demographics, is driving demand for electrolyte-enhanced beverages catering to fitness enthusiasts and athletes. The increasing popularity of fitness activities like yoga, marathons, and gym workouts further boosts consumption. Moreover, evolving lifestyles and increasing disposable incomes are creating a favorable environment for premium and functional beverages, including sports drinks. Strategic marketing campaigns focusing on hydration and performance enhancement also contribute to market growth. The market is segmented by product type (electrolyte-enhanced water, isotonic, hypotonic, hypertonic, protein-based drinks), packaging (PET bottles, metal cans, aseptic packages), and distribution channels (supermarkets, convenience stores, online retail, specialty stores). Competition is fierce, with established players like PepsiCo, Coca-Cola, and domestic brands like FDC Limited and Gujarat Cooperative Milk Marketing Federation Limited vying for market share.
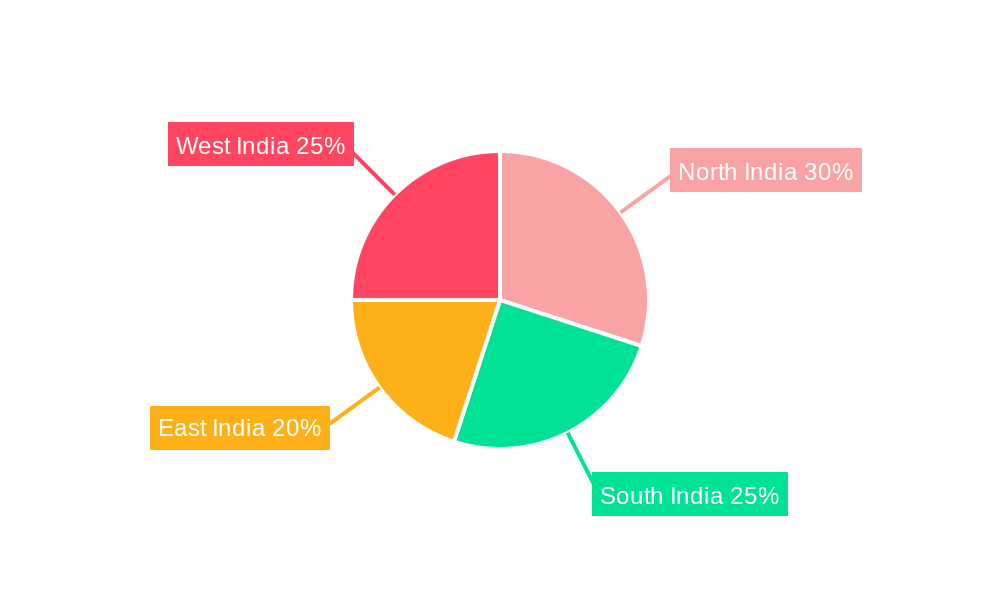
However, challenges exist. The presence of numerous regional and local brands creates intense competition, potentially impacting profitability for larger players. Concerns regarding high sugar content in some sports drinks might negatively influence consumer preferences, leading to a shift towards healthier, low-sugar alternatives. Fluctuations in raw material prices also represent a significant restraint. To navigate these challenges, companies are investing in research and development to create innovative, healthier formulations, while focusing on effective marketing to differentiate their products and reach target consumer segments. The expansion of e-commerce further presents significant growth opportunities, as online retail channels gain popularity amongst health-conscious consumers. Regional variations in consumption patterns and preferences also need to be considered by players for effective market penetration. The geographic segmentation (North, South, East, West India) reveals varied market dynamics, presenting opportunities for targeted marketing strategies.
Sports Drinks Industry in India: A Comprehensive Market Report (2019-2033)
This comprehensive report provides an in-depth analysis of the burgeoning sports drinks industry in India, covering market dynamics, key players, emerging trends, and future growth prospects. The report utilizes data from the historical period (2019-2024), base year (2025), and estimated year (2025) to forecast market trends until 2033. This detailed analysis is crucial for stakeholders looking to navigate this dynamic and rapidly expanding market.
Sports Drinks Industry in India Market Concentration & Dynamics
The Indian sports drinks market is experiencing significant growth, driven by increasing health consciousness, rising disposable incomes, and a growing participation in sports and fitness activities. However, the market remains concentrated among a few key players, with the top five companies holding approximately xx% of the market share in 2025. This report analyzes the competitive landscape, including market share data for key players like PepsiCo Inc, The Coca-Cola Company, and FDC Limited. Innovation is also a key factor, with companies constantly developing new product variations and formulations to cater to evolving consumer preferences.
- Market Concentration: High, with top 5 players holding xx% market share (2025).
- Innovation Ecosystem: Active, with focus on new flavors, functional ingredients, and sustainable packaging.
- Regulatory Framework: Relatively stable, but subject to evolving food safety and labeling regulations.
- Substitute Products: Water, fruit juices, and energy drinks pose competition.
- End-User Trends: Increasing demand for healthier, functional beverages with natural ingredients.
- M&A Activities: A moderate level of M&A activity is observed, with xx deals recorded in the past five years.
Sports Drinks Industry in India Industry Insights & Trends
The Indian sports drinks market is projected to reach xx Million by 2033, exhibiting a CAGR of xx% during the forecast period (2025-2033). Several factors contribute to this robust growth. The rising popularity of fitness and sports activities amongst the young population fuels the demand for hydration and performance-enhancing drinks. Increased health awareness is leading consumers to choose healthier options. Technological advancements in product formulation and packaging further enhance market appeal. Changing lifestyles, urbanization, and rising disposable incomes are additional contributors to the market's expansion. However, fluctuating raw material prices and intense competition remain potential challenges.
Key Markets & Segments Leading Sports Drinks Industry in India
The Indian sports drink market is geographically diverse, with significant growth observed across major urban centers and expanding rapidly into tier 2 and 3 cities. The Isotonic segment dominates the soft drink type category, followed by electrolyte-enhanced water. PET bottles are the most preferred packaging type due to convenience and affordability. Supermarket/hypermarkets and convenience stores remain the primary distribution channels.
Dominant Segments:
- Soft Drink Type: Isotonic drinks hold the largest market share.
- Packaging Type: PET bottles are the most prevalent.
- Distribution Channel: Supermarket/hypermarkets and convenience stores lead.
Growth Drivers:
- Economic Growth: Rising disposable incomes increase spending on premium beverages.
- Urbanization: Increased population density in cities boosts demand.
- Changing Lifestyles: More focus on health and fitness drives consumption.
- Infrastructure Development: Improved distribution networks increase market reach.
Sports Drinks Industry in India Product Developments
Recent years have witnessed significant innovation in sports drinks, focusing on enhanced functionality and improved taste profiles. The introduction of new flavors, functional ingredients (e.g., electrolytes, vitamins, and proteins), and sustainable packaging options reflect this trend. Companies are actively incorporating natural ingredients and reducing sugar content to cater to the growing health-conscious consumer base. These developments have created a more competitive market, leading to premiumization and differentiation amongst various brands.
Challenges in the Sports Drinks Industry in India Market
The Indian sports drinks market faces challenges such as intense competition from established players and the emergence of new entrants. Fluctuations in raw material prices impact production costs and profitability. Maintaining a consistent supply chain, especially in a diverse market like India, is also a significant operational hurdle. Further, stringent regulations and evolving consumer preferences necessitate continuous adaptation and innovation.
Forces Driving Sports Drinks Industry in India Growth
Several factors are driving the growth of the Indian sports drinks market. These include the rising popularity of fitness and sports, increased awareness of hydration's importance, and the growing adoption of active lifestyles. Government initiatives promoting sports and fitness also contribute positively. Technological advancements in production, resulting in improved product quality and efficient packaging solutions, further fuel market expansion.
Challenges in the Sports Drinks Industry in India Market
Long-term growth in the Indian sports drinks market will hinge on factors like strategic partnerships, expanding distribution networks, particularly in rural areas, and further product innovations catering to niche consumer segments. Investing in research and development to create healthier and more functional beverages remains critical for sustained growth.
Emerging Opportunities in Sports Drinks Industry in India
Emerging opportunities include the increasing demand for functional sports drinks with added benefits like immunity support or enhanced recovery. The growing online retail sector presents a substantial expansion opportunity. Further, tapping into underserved markets and introducing customized products for specific sports or demographics could unlock significant growth potential.
Leading Players in the Sports Drinks Industry in India Sector
- FDC Limited
- Gujarat Cooperative Milk Marketing Federation Limited
- PepsiCo Inc
- The Coca-Cola Company
- Essen Nutrition Corporation
- Cipla Limited
- Thai Beverages PCL
- Congo Brands
Key Milestones in Sports Drinks Industry in India Industry
- September 2023: Coca-Cola India launches Limca Sportz ION4, expanding its product line.
- May 2022: Coca-Cola India extends the Limca brand into the sports drinks category with Limca Sportz.
- January 2022: FDC Limited expands its portfolio with the launch of Electral Z+ (ORS+Zinc Solution).
Strategic Outlook for Sports Drinks Industry in India Market
The future of the Indian sports drinks market is promising, with significant growth potential driven by evolving consumer preferences, increasing health consciousness, and expanding market reach. Companies that prioritize innovation, sustainable practices, and effective distribution strategies will be well-positioned to capitalize on the market's growth trajectory. Strategic partnerships and targeted marketing campaigns will further enhance market penetration and brand visibility.
Sports Drinks Industry in India Segmentation
-
1. Soft Drink Type
- 1.1. Electrolyte-Enhanced Water
- 1.2. Hypertonic
- 1.3. Hypotonic
- 1.4. Isotonic
- 1.5. Protein-based Sport Drinks
-
2. Packaging Type
- 2.1. Aseptic packages
- 2.2. Metal Can
- 2.3. PET Bottles
-
3. Sub Distribution Channel
- 3.1. Convenience Stores
- 3.2. Online Retail
- 3.3. Specialty Stores
- 3.4. Supermarket/Hypermarket
- 3.5. Others
Sports Drinks Industry in India Segmentation By Geography
-
1. North America
- 1.1. United States
- 1.2. Canada
- 1.3. Mexico
-
2. South America
- 2.1. Brazil
- 2.2. Argentina
- 2.3. Rest of South America
-
3. Europe
- 3.1. United Kingdom
- 3.2. Germany
- 3.3. France
- 3.4. Italy
- 3.5. Spain
- 3.6. Russia
- 3.7. Benelux
- 3.8. Nordics
- 3.9. Rest of Europe
-
4. Middle East & Africa
- 4.1. Turkey
- 4.2. Israel
- 4.3. GCC
- 4.4. North Africa
- 4.5. South Africa
- 4.6. Rest of Middle East & Africa
-
5. Asia Pacific
- 5.1. China
- 5.2. India
- 5.3. Japan
- 5.4. South Korea
- 5.5. ASEAN
- 5.6. Oceania
- 5.7. Rest of Asia Pacific
Sports Drinks Industry in India REPORT HIGHLIGHTS
| Aspects | Details |
|---|---|
| Study Period | 2019-2033 |
| Base Year | 2024 |
| Estimated Year | 2025 |
| Forecast Period | 2025-2033 |
| Historical Period | 2019-2024 |
| Growth Rate | CAGR of 6.10% from 2019-2033 |
| Segmentation |
|
Table of Contents
- 1. Introduction
- 1.1. Research Scope
- 1.2. Market Segmentation
- 1.3. Research Methodology
- 1.4. Definitions and Assumptions
- 2. Executive Summary
- 2.1. Introduction
- 3. Market Dynamics
- 3.1. Introduction
- 3.2. Market Drivers
- 3.2.1. Increasing Demand for Functional and Fortified Food; Multi-functionality and Wide Application of Riboflavin
- 3.3. Market Restrains
- 3.3.1. Low Stability of Riboflavin on Exposure to Light and Heat
- 3.4. Market Trends
- 3.4.1. OTHER KEY INDUSTRY TRENDS COVERED IN THE REPORT
- 4. Market Factor Analysis
- 4.1. Porters Five Forces
- 4.2. Supply/Value Chain
- 4.3. PESTEL analysis
- 4.4. Market Entropy
- 4.5. Patent/Trademark Analysis
- 5. Global Sports Drinks Industry in India Analysis, Insights and Forecast, 2019-2031
- 5.1. Market Analysis, Insights and Forecast - by Soft Drink Type
- 5.1.1. Electrolyte-Enhanced Water
- 5.1.2. Hypertonic
- 5.1.3. Hypotonic
- 5.1.4. Isotonic
- 5.1.5. Protein-based Sport Drinks
- 5.2. Market Analysis, Insights and Forecast - by Packaging Type
- 5.2.1. Aseptic packages
- 5.2.2. Metal Can
- 5.2.3. PET Bottles
- 5.3. Market Analysis, Insights and Forecast - by Sub Distribution Channel
- 5.3.1. Convenience Stores
- 5.3.2. Online Retail
- 5.3.3. Specialty Stores
- 5.3.4. Supermarket/Hypermarket
- 5.3.5. Others
- 5.4. Market Analysis, Insights and Forecast - by Region
- 5.4.1. North America
- 5.4.2. South America
- 5.4.3. Europe
- 5.4.4. Middle East & Africa
- 5.4.5. Asia Pacific
- 5.1. Market Analysis, Insights and Forecast - by Soft Drink Type
- 6. North America Sports Drinks Industry in India Analysis, Insights and Forecast, 2019-2031
- 6.1. Market Analysis, Insights and Forecast - by Soft Drink Type
- 6.1.1. Electrolyte-Enhanced Water
- 6.1.2. Hypertonic
- 6.1.3. Hypotonic
- 6.1.4. Isotonic
- 6.1.5. Protein-based Sport Drinks
- 6.2. Market Analysis, Insights and Forecast - by Packaging Type
- 6.2.1. Aseptic packages
- 6.2.2. Metal Can
- 6.2.3. PET Bottles
- 6.3. Market Analysis, Insights and Forecast - by Sub Distribution Channel
- 6.3.1. Convenience Stores
- 6.3.2. Online Retail
- 6.3.3. Specialty Stores
- 6.3.4. Supermarket/Hypermarket
- 6.3.5. Others
- 6.1. Market Analysis, Insights and Forecast - by Soft Drink Type
- 7. South America Sports Drinks Industry in India Analysis, Insights and Forecast, 2019-2031
- 7.1. Market Analysis, Insights and Forecast - by Soft Drink Type
- 7.1.1. Electrolyte-Enhanced Water
- 7.1.2. Hypertonic
- 7.1.3. Hypotonic
- 7.1.4. Isotonic
- 7.1.5. Protein-based Sport Drinks
- 7.2. Market Analysis, Insights and Forecast - by Packaging Type
- 7.2.1. Aseptic packages
- 7.2.2. Metal Can
- 7.2.3. PET Bottles
- 7.3. Market Analysis, Insights and Forecast - by Sub Distribution Channel
- 7.3.1. Convenience Stores
- 7.3.2. Online Retail
- 7.3.3. Specialty Stores
- 7.3.4. Supermarket/Hypermarket
- 7.3.5. Others
- 7.1. Market Analysis, Insights and Forecast - by Soft Drink Type
- 8. Europe Sports Drinks Industry in India Analysis, Insights and Forecast, 2019-2031
- 8.1. Market Analysis, Insights and Forecast - by Soft Drink Type
- 8.1.1. Electrolyte-Enhanced Water
- 8.1.2. Hypertonic
- 8.1.3. Hypotonic
- 8.1.4. Isotonic
- 8.1.5. Protein-based Sport Drinks
- 8.2. Market Analysis, Insights and Forecast - by Packaging Type
- 8.2.1. Aseptic packages
- 8.2.2. Metal Can
- 8.2.3. PET Bottles
- 8.3. Market Analysis, Insights and Forecast - by Sub Distribution Channel
- 8.3.1. Convenience Stores
- 8.3.2. Online Retail
- 8.3.3. Specialty Stores
- 8.3.4. Supermarket/Hypermarket
- 8.3.5. Others
- 8.1. Market Analysis, Insights and Forecast - by Soft Drink Type
- 9. Middle East & Africa Sports Drinks Industry in India Analysis, Insights and Forecast, 2019-2031
- 9.1. Market Analysis, Insights and Forecast - by Soft Drink Type
- 9.1.1. Electrolyte-Enhanced Water
- 9.1.2. Hypertonic
- 9.1.3. Hypotonic
- 9.1.4. Isotonic
- 9.1.5. Protein-based Sport Drinks
- 9.2. Market Analysis, Insights and Forecast - by Packaging Type
- 9.2.1. Aseptic packages
- 9.2.2. Metal Can
- 9.2.3. PET Bottles
- 9.3. Market Analysis, Insights and Forecast - by Sub Distribution Channel
- 9.3.1. Convenience Stores
- 9.3.2. Online Retail
- 9.3.3. Specialty Stores
- 9.3.4. Supermarket/Hypermarket
- 9.3.5. Others
- 9.1. Market Analysis, Insights and Forecast - by Soft Drink Type
- 10. Asia Pacific Sports Drinks Industry in India Analysis, Insights and Forecast, 2019-2031
- 10.1. Market Analysis, Insights and Forecast - by Soft Drink Type
- 10.1.1. Electrolyte-Enhanced Water
- 10.1.2. Hypertonic
- 10.1.3. Hypotonic
- 10.1.4. Isotonic
- 10.1.5. Protein-based Sport Drinks
- 10.2. Market Analysis, Insights and Forecast - by Packaging Type
- 10.2.1. Aseptic packages
- 10.2.2. Metal Can
- 10.2.3. PET Bottles
- 10.3. Market Analysis, Insights and Forecast - by Sub Distribution Channel
- 10.3.1. Convenience Stores
- 10.3.2. Online Retail
- 10.3.3. Specialty Stores
- 10.3.4. Supermarket/Hypermarket
- 10.3.5. Others
- 10.1. Market Analysis, Insights and Forecast - by Soft Drink Type
- 11. North India Sports Drinks Industry in India Analysis, Insights and Forecast, 2019-2031
- 12. South India Sports Drinks Industry in India Analysis, Insights and Forecast, 2019-2031
- 13. East India Sports Drinks Industry in India Analysis, Insights and Forecast, 2019-2031
- 14. West India Sports Drinks Industry in India Analysis, Insights and Forecast, 2019-2031
- 15. Competitive Analysis
- 15.1. Global Market Share Analysis 2024
- 15.2. Company Profiles
- 15.2.1 FDC Limited
- 15.2.1.1. Overview
- 15.2.1.2. Products
- 15.2.1.3. SWOT Analysis
- 15.2.1.4. Recent Developments
- 15.2.1.5. Financials (Based on Availability)
- 15.2.2 Gujarat Cooperative Milk Marketing Federation Limited
- 15.2.2.1. Overview
- 15.2.2.2. Products
- 15.2.2.3. SWOT Analysis
- 15.2.2.4. Recent Developments
- 15.2.2.5. Financials (Based on Availability)
- 15.2.3 PepsiCo Inc
- 15.2.3.1. Overview
- 15.2.3.2. Products
- 15.2.3.3. SWOT Analysis
- 15.2.3.4. Recent Developments
- 15.2.3.5. Financials (Based on Availability)
- 15.2.4 The Coca-Cola Compan
- 15.2.4.1. Overview
- 15.2.4.2. Products
- 15.2.4.3. SWOT Analysis
- 15.2.4.4. Recent Developments
- 15.2.4.5. Financials (Based on Availability)
- 15.2.5 Essen Nutrition Corporation
- 15.2.5.1. Overview
- 15.2.5.2. Products
- 15.2.5.3. SWOT Analysis
- 15.2.5.4. Recent Developments
- 15.2.5.5. Financials (Based on Availability)
- 15.2.6 Cipla Limited
- 15.2.6.1. Overview
- 15.2.6.2. Products
- 15.2.6.3. SWOT Analysis
- 15.2.6.4. Recent Developments
- 15.2.6.5. Financials (Based on Availability)
- 15.2.7 Thai Beverages PCL
- 15.2.7.1. Overview
- 15.2.7.2. Products
- 15.2.7.3. SWOT Analysis
- 15.2.7.4. Recent Developments
- 15.2.7.5. Financials (Based on Availability)
- 15.2.8 Congo Brands
- 15.2.8.1. Overview
- 15.2.8.2. Products
- 15.2.8.3. SWOT Analysis
- 15.2.8.4. Recent Developments
- 15.2.8.5. Financials (Based on Availability)
- 15.2.1 FDC Limited
List of Figures
- Figure 1: Global Sports Drinks Industry in India Revenue Breakdown (Million, %) by Region 2024 & 2032
- Figure 2: India Sports Drinks Industry in India Revenue (Million), by Country 2024 & 2032
- Figure 3: India Sports Drinks Industry in India Revenue Share (%), by Country 2024 & 2032
- Figure 4: North America Sports Drinks Industry in India Revenue (Million), by Soft Drink Type 2024 & 2032
- Figure 5: North America Sports Drinks Industry in India Revenue Share (%), by Soft Drink Type 2024 & 2032
- Figure 6: North America Sports Drinks Industry in India Revenue (Million), by Packaging Type 2024 & 2032
- Figure 7: North America Sports Drinks Industry in India Revenue Share (%), by Packaging Type 2024 & 2032
- Figure 8: North America Sports Drinks Industry in India Revenue (Million), by Sub Distribution Channel 2024 & 2032
- Figure 9: North America Sports Drinks Industry in India Revenue Share (%), by Sub Distribution Channel 2024 & 2032
- Figure 10: North America Sports Drinks Industry in India Revenue (Million), by Country 2024 & 2032
- Figure 11: North America Sports Drinks Industry in India Revenue Share (%), by Country 2024 & 2032
- Figure 12: South America Sports Drinks Industry in India Revenue (Million), by Soft Drink Type 2024 & 2032
- Figure 13: South America Sports Drinks Industry in India Revenue Share (%), by Soft Drink Type 2024 & 2032
- Figure 14: South America Sports Drinks Industry in India Revenue (Million), by Packaging Type 2024 & 2032
- Figure 15: South America Sports Drinks Industry in India Revenue Share (%), by Packaging Type 2024 & 2032
- Figure 16: South America Sports Drinks Industry in India Revenue (Million), by Sub Distribution Channel 2024 & 2032
- Figure 17: South America Sports Drinks Industry in India Revenue Share (%), by Sub Distribution Channel 2024 & 2032
- Figure 18: South America Sports Drinks Industry in India Revenue (Million), by Country 2024 & 2032
- Figure 19: South America Sports Drinks Industry in India Revenue Share (%), by Country 2024 & 2032
- Figure 20: Europe Sports Drinks Industry in India Revenue (Million), by Soft Drink Type 2024 & 2032
- Figure 21: Europe Sports Drinks Industry in India Revenue Share (%), by Soft Drink Type 2024 & 2032
- Figure 22: Europe Sports Drinks Industry in India Revenue (Million), by Packaging Type 2024 & 2032
- Figure 23: Europe Sports Drinks Industry in India Revenue Share (%), by Packaging Type 2024 & 2032
- Figure 24: Europe Sports Drinks Industry in India Revenue (Million), by Sub Distribution Channel 2024 & 2032
- Figure 25: Europe Sports Drinks Industry in India Revenue Share (%), by Sub Distribution Channel 2024 & 2032
- Figure 26: Europe Sports Drinks Industry in India Revenue (Million), by Country 2024 & 2032
- Figure 27: Europe Sports Drinks Industry in India Revenue Share (%), by Country 2024 & 2032
- Figure 28: Middle East & Africa Sports Drinks Industry in India Revenue (Million), by Soft Drink Type 2024 & 2032
- Figure 29: Middle East & Africa Sports Drinks Industry in India Revenue Share (%), by Soft Drink Type 2024 & 2032
- Figure 30: Middle East & Africa Sports Drinks Industry in India Revenue (Million), by Packaging Type 2024 & 2032
- Figure 31: Middle East & Africa Sports Drinks Industry in India Revenue Share (%), by Packaging Type 2024 & 2032
- Figure 32: Middle East & Africa Sports Drinks Industry in India Revenue (Million), by Sub Distribution Channel 2024 & 2032
- Figure 33: Middle East & Africa Sports Drinks Industry in India Revenue Share (%), by Sub Distribution Channel 2024 & 2032
- Figure 34: Middle East & Africa Sports Drinks Industry in India Revenue (Million), by Country 2024 & 2032
- Figure 35: Middle East & Africa Sports Drinks Industry in India Revenue Share (%), by Country 2024 & 2032
- Figure 36: Asia Pacific Sports Drinks Industry in India Revenue (Million), by Soft Drink Type 2024 & 2032
- Figure 37: Asia Pacific Sports Drinks Industry in India Revenue Share (%), by Soft Drink Type 2024 & 2032
- Figure 38: Asia Pacific Sports Drinks Industry in India Revenue (Million), by Packaging Type 2024 & 2032
- Figure 39: Asia Pacific Sports Drinks Industry in India Revenue Share (%), by Packaging Type 2024 & 2032
- Figure 40: Asia Pacific Sports Drinks Industry in India Revenue (Million), by Sub Distribution Channel 2024 & 2032
- Figure 41: Asia Pacific Sports Drinks Industry in India Revenue Share (%), by Sub Distribution Channel 2024 & 2032
- Figure 42: Asia Pacific Sports Drinks Industry in India Revenue (Million), by Country 2024 & 2032
- Figure 43: Asia Pacific Sports Drinks Industry in India Revenue Share (%), by Country 2024 & 2032
List of Tables
- Table 1: Global Sports Drinks Industry in India Revenue Million Forecast, by Region 2019 & 2032
- Table 2: Global Sports Drinks Industry in India Revenue Million Forecast, by Soft Drink Type 2019 & 2032
- Table 3: Global Sports Drinks Industry in India Revenue Million Forecast, by Packaging Type 2019 & 2032
- Table 4: Global Sports Drinks Industry in India Revenue Million Forecast, by Sub Distribution Channel 2019 & 2032
- Table 5: Global Sports Drinks Industry in India Revenue Million Forecast, by Region 2019 & 2032
- Table 6: Global Sports Drinks Industry in India Revenue Million Forecast, by Country 2019 & 2032
- Table 7: North India Sports Drinks Industry in India Revenue (Million) Forecast, by Application 2019 & 2032
- Table 8: South India Sports Drinks Industry in India Revenue (Million) Forecast, by Application 2019 & 2032
- Table 9: East India Sports Drinks Industry in India Revenue (Million) Forecast, by Application 2019 & 2032
- Table 10: West India Sports Drinks Industry in India Revenue (Million) Forecast, by Application 2019 & 2032
- Table 11: Global Sports Drinks Industry in India Revenue Million Forecast, by Soft Drink Type 2019 & 2032
- Table 12: Global Sports Drinks Industry in India Revenue Million Forecast, by Packaging Type 2019 & 2032
- Table 13: Global Sports Drinks Industry in India Revenue Million Forecast, by Sub Distribution Channel 2019 & 2032
- Table 14: Global Sports Drinks Industry in India Revenue Million Forecast, by Country 2019 & 2032
- Table 15: United States Sports Drinks Industry in India Revenue (Million) Forecast, by Application 2019 & 2032
- Table 16: Canada Sports Drinks Industry in India Revenue (Million) Forecast, by Application 2019 & 2032
- Table 17: Mexico Sports Drinks Industry in India Revenue (Million) Forecast, by Application 2019 & 2032
- Table 18: Global Sports Drinks Industry in India Revenue Million Forecast, by Soft Drink Type 2019 & 2032
- Table 19: Global Sports Drinks Industry in India Revenue Million Forecast, by Packaging Type 2019 & 2032
- Table 20: Global Sports Drinks Industry in India Revenue Million Forecast, by Sub Distribution Channel 2019 & 2032
- Table 21: Global Sports Drinks Industry in India Revenue Million Forecast, by Country 2019 & 2032
- Table 22: Brazil Sports Drinks Industry in India Revenue (Million) Forecast, by Application 2019 & 2032
- Table 23: Argentina Sports Drinks Industry in India Revenue (Million) Forecast, by Application 2019 & 2032
- Table 24: Rest of South America Sports Drinks Industry in India Revenue (Million) Forecast, by Application 2019 & 2032
- Table 25: Global Sports Drinks Industry in India Revenue Million Forecast, by Soft Drink Type 2019 & 2032
- Table 26: Global Sports Drinks Industry in India Revenue Million Forecast, by Packaging Type 2019 & 2032
- Table 27: Global Sports Drinks Industry in India Revenue Million Forecast, by Sub Distribution Channel 2019 & 2032
- Table 28: Global Sports Drinks Industry in India Revenue Million Forecast, by Country 2019 & 2032
- Table 29: United Kingdom Sports Drinks Industry in India Revenue (Million) Forecast, by Application 2019 & 2032
- Table 30: Germany Sports Drinks Industry in India Revenue (Million) Forecast, by Application 2019 & 2032
- Table 31: France Sports Drinks Industry in India Revenue (Million) Forecast, by Application 2019 & 2032
- Table 32: Italy Sports Drinks Industry in India Revenue (Million) Forecast, by Application 2019 & 2032
- Table 33: Spain Sports Drinks Industry in India Revenue (Million) Forecast, by Application 2019 & 2032
- Table 34: Russia Sports Drinks Industry in India Revenue (Million) Forecast, by Application 2019 & 2032
- Table 35: Benelux Sports Drinks Industry in India Revenue (Million) Forecast, by Application 2019 & 2032
- Table 36: Nordics Sports Drinks Industry in India Revenue (Million) Forecast, by Application 2019 & 2032
- Table 37: Rest of Europe Sports Drinks Industry in India Revenue (Million) Forecast, by Application 2019 & 2032
- Table 38: Global Sports Drinks Industry in India Revenue Million Forecast, by Soft Drink Type 2019 & 2032
- Table 39: Global Sports Drinks Industry in India Revenue Million Forecast, by Packaging Type 2019 & 2032
- Table 40: Global Sports Drinks Industry in India Revenue Million Forecast, by Sub Distribution Channel 2019 & 2032
- Table 41: Global Sports Drinks Industry in India Revenue Million Forecast, by Country 2019 & 2032
- Table 42: Turkey Sports Drinks Industry in India Revenue (Million) Forecast, by Application 2019 & 2032
- Table 43: Israel Sports Drinks Industry in India Revenue (Million) Forecast, by Application 2019 & 2032
- Table 44: GCC Sports Drinks Industry in India Revenue (Million) Forecast, by Application 2019 & 2032
- Table 45: North Africa Sports Drinks Industry in India Revenue (Million) Forecast, by Application 2019 & 2032
- Table 46: South Africa Sports Drinks Industry in India Revenue (Million) Forecast, by Application 2019 & 2032
- Table 47: Rest of Middle East & Africa Sports Drinks Industry in India Revenue (Million) Forecast, by Application 2019 & 2032
- Table 48: Global Sports Drinks Industry in India Revenue Million Forecast, by Soft Drink Type 2019 & 2032
- Table 49: Global Sports Drinks Industry in India Revenue Million Forecast, by Packaging Type 2019 & 2032
- Table 50: Global Sports Drinks Industry in India Revenue Million Forecast, by Sub Distribution Channel 2019 & 2032
- Table 51: Global Sports Drinks Industry in India Revenue Million Forecast, by Country 2019 & 2032
- Table 52: China Sports Drinks Industry in India Revenue (Million) Forecast, by Application 2019 & 2032
- Table 53: India Sports Drinks Industry in India Revenue (Million) Forecast, by Application 2019 & 2032
- Table 54: Japan Sports Drinks Industry in India Revenue (Million) Forecast, by Application 2019 & 2032
- Table 55: South Korea Sports Drinks Industry in India Revenue (Million) Forecast, by Application 2019 & 2032
- Table 56: ASEAN Sports Drinks Industry in India Revenue (Million) Forecast, by Application 2019 & 2032
- Table 57: Oceania Sports Drinks Industry in India Revenue (Million) Forecast, by Application 2019 & 2032
- Table 58: Rest of Asia Pacific Sports Drinks Industry in India Revenue (Million) Forecast, by Application 2019 & 2032
Frequently Asked Questions
1. What is the projected Compound Annual Growth Rate (CAGR) of the Sports Drinks Industry in India?
The projected CAGR is approximately 6.10%.
2. Which companies are prominent players in the Sports Drinks Industry in India?
Key companies in the market include FDC Limited, Gujarat Cooperative Milk Marketing Federation Limited, PepsiCo Inc, The Coca-Cola Compan, Essen Nutrition Corporation, Cipla Limited, Thai Beverages PCL, Congo Brands.
3. What are the main segments of the Sports Drinks Industry in India?
The market segments include Soft Drink Type, Packaging Type, Sub Distribution Channel.
4. Can you provide details about the market size?
The market size is estimated to be USD XX Million as of 2022.
5. What are some drivers contributing to market growth?
Increasing Demand for Functional and Fortified Food; Multi-functionality and Wide Application of Riboflavin.
6. What are the notable trends driving market growth?
OTHER KEY INDUSTRY TRENDS COVERED IN THE REPORT.
7. Are there any restraints impacting market growth?
Low Stability of Riboflavin on Exposure to Light and Heat.
8. Can you provide examples of recent developments in the market?
September 2023: Limca Sportz, the sports drink from Coca-Cola India's home-grown brand Limca, is thrilled to announce the launch of its new variant Limca Sportz ION4 in India.May 2022: Coca-Cola India extended the brand Limca into the hydrating sports drinks category, with the product Limca sportz. This will be the first brand extension for Limca, which was acquired from Ramesh Chauhan’s Parle Bisleri Ltd. in the early 1990s along with other valuable brands such as Thums Up, Maaza, and Gold Spot. Limca stands at number four within Coca-Cola India’s sparkling portfolio.January 2022: FDC limited expanded its portfolio with launch of its brand ‘Electral Z+ (ORS+Zinc Solution)’ which is a ready-to-drink OTC product, having unique formulation manufactured by Halewood Laboratories Private Ltd.
9. What pricing options are available for accessing the report?
Pricing options include single-user, multi-user, and enterprise licenses priced at USD 3800, USD 4500, and USD 5800 respectively.
10. Is the market size provided in terms of value or volume?
The market size is provided in terms of value, measured in Million.
11. Are there any specific market keywords associated with the report?
Yes, the market keyword associated with the report is "Sports Drinks Industry in India," which aids in identifying and referencing the specific market segment covered.
12. How do I determine which pricing option suits my needs best?
The pricing options vary based on user requirements and access needs. Individual users may opt for single-user licenses, while businesses requiring broader access may choose multi-user or enterprise licenses for cost-effective access to the report.
13. Are there any additional resources or data provided in the Sports Drinks Industry in India report?
While the report offers comprehensive insights, it's advisable to review the specific contents or supplementary materials provided to ascertain if additional resources or data are available.
14. How can I stay updated on further developments or reports in the Sports Drinks Industry in India?
To stay informed about further developments, trends, and reports in the Sports Drinks Industry in India, consider subscribing to industry newsletters, following relevant companies and organizations, or regularly checking reputable industry news sources and publications.
Methodology
Step 1 - Identification of Relevant Samples Size from Population Database


Step 2 - Approaches for Defining Global Market Size (Value, Volume* & Price*)

Note*: In applicable scenarios
Step 3 - Data Sources
Primary Research
- Web Analytics
- Survey Reports
- Research Institute
- Latest Research Reports
- Opinion Leaders
Secondary Research
- Annual Reports
- White Paper
- Latest Press Release
- Industry Association
- Paid Database
- Investor Presentations

Step 4 - Data Triangulation
Involves using different sources of information in order to increase the validity of a study
These sources are likely to be stakeholders in a program - participants, other researchers, program staff, other community members, and so on.
Then we put all data in single framework & apply various statistical tools to find out the dynamic on the market.
During the analysis stage, feedback from the stakeholder groups would be compared to determine areas of agreement as well as areas of divergence
